Abstract
Purpose
Materials and Methods
Results
References
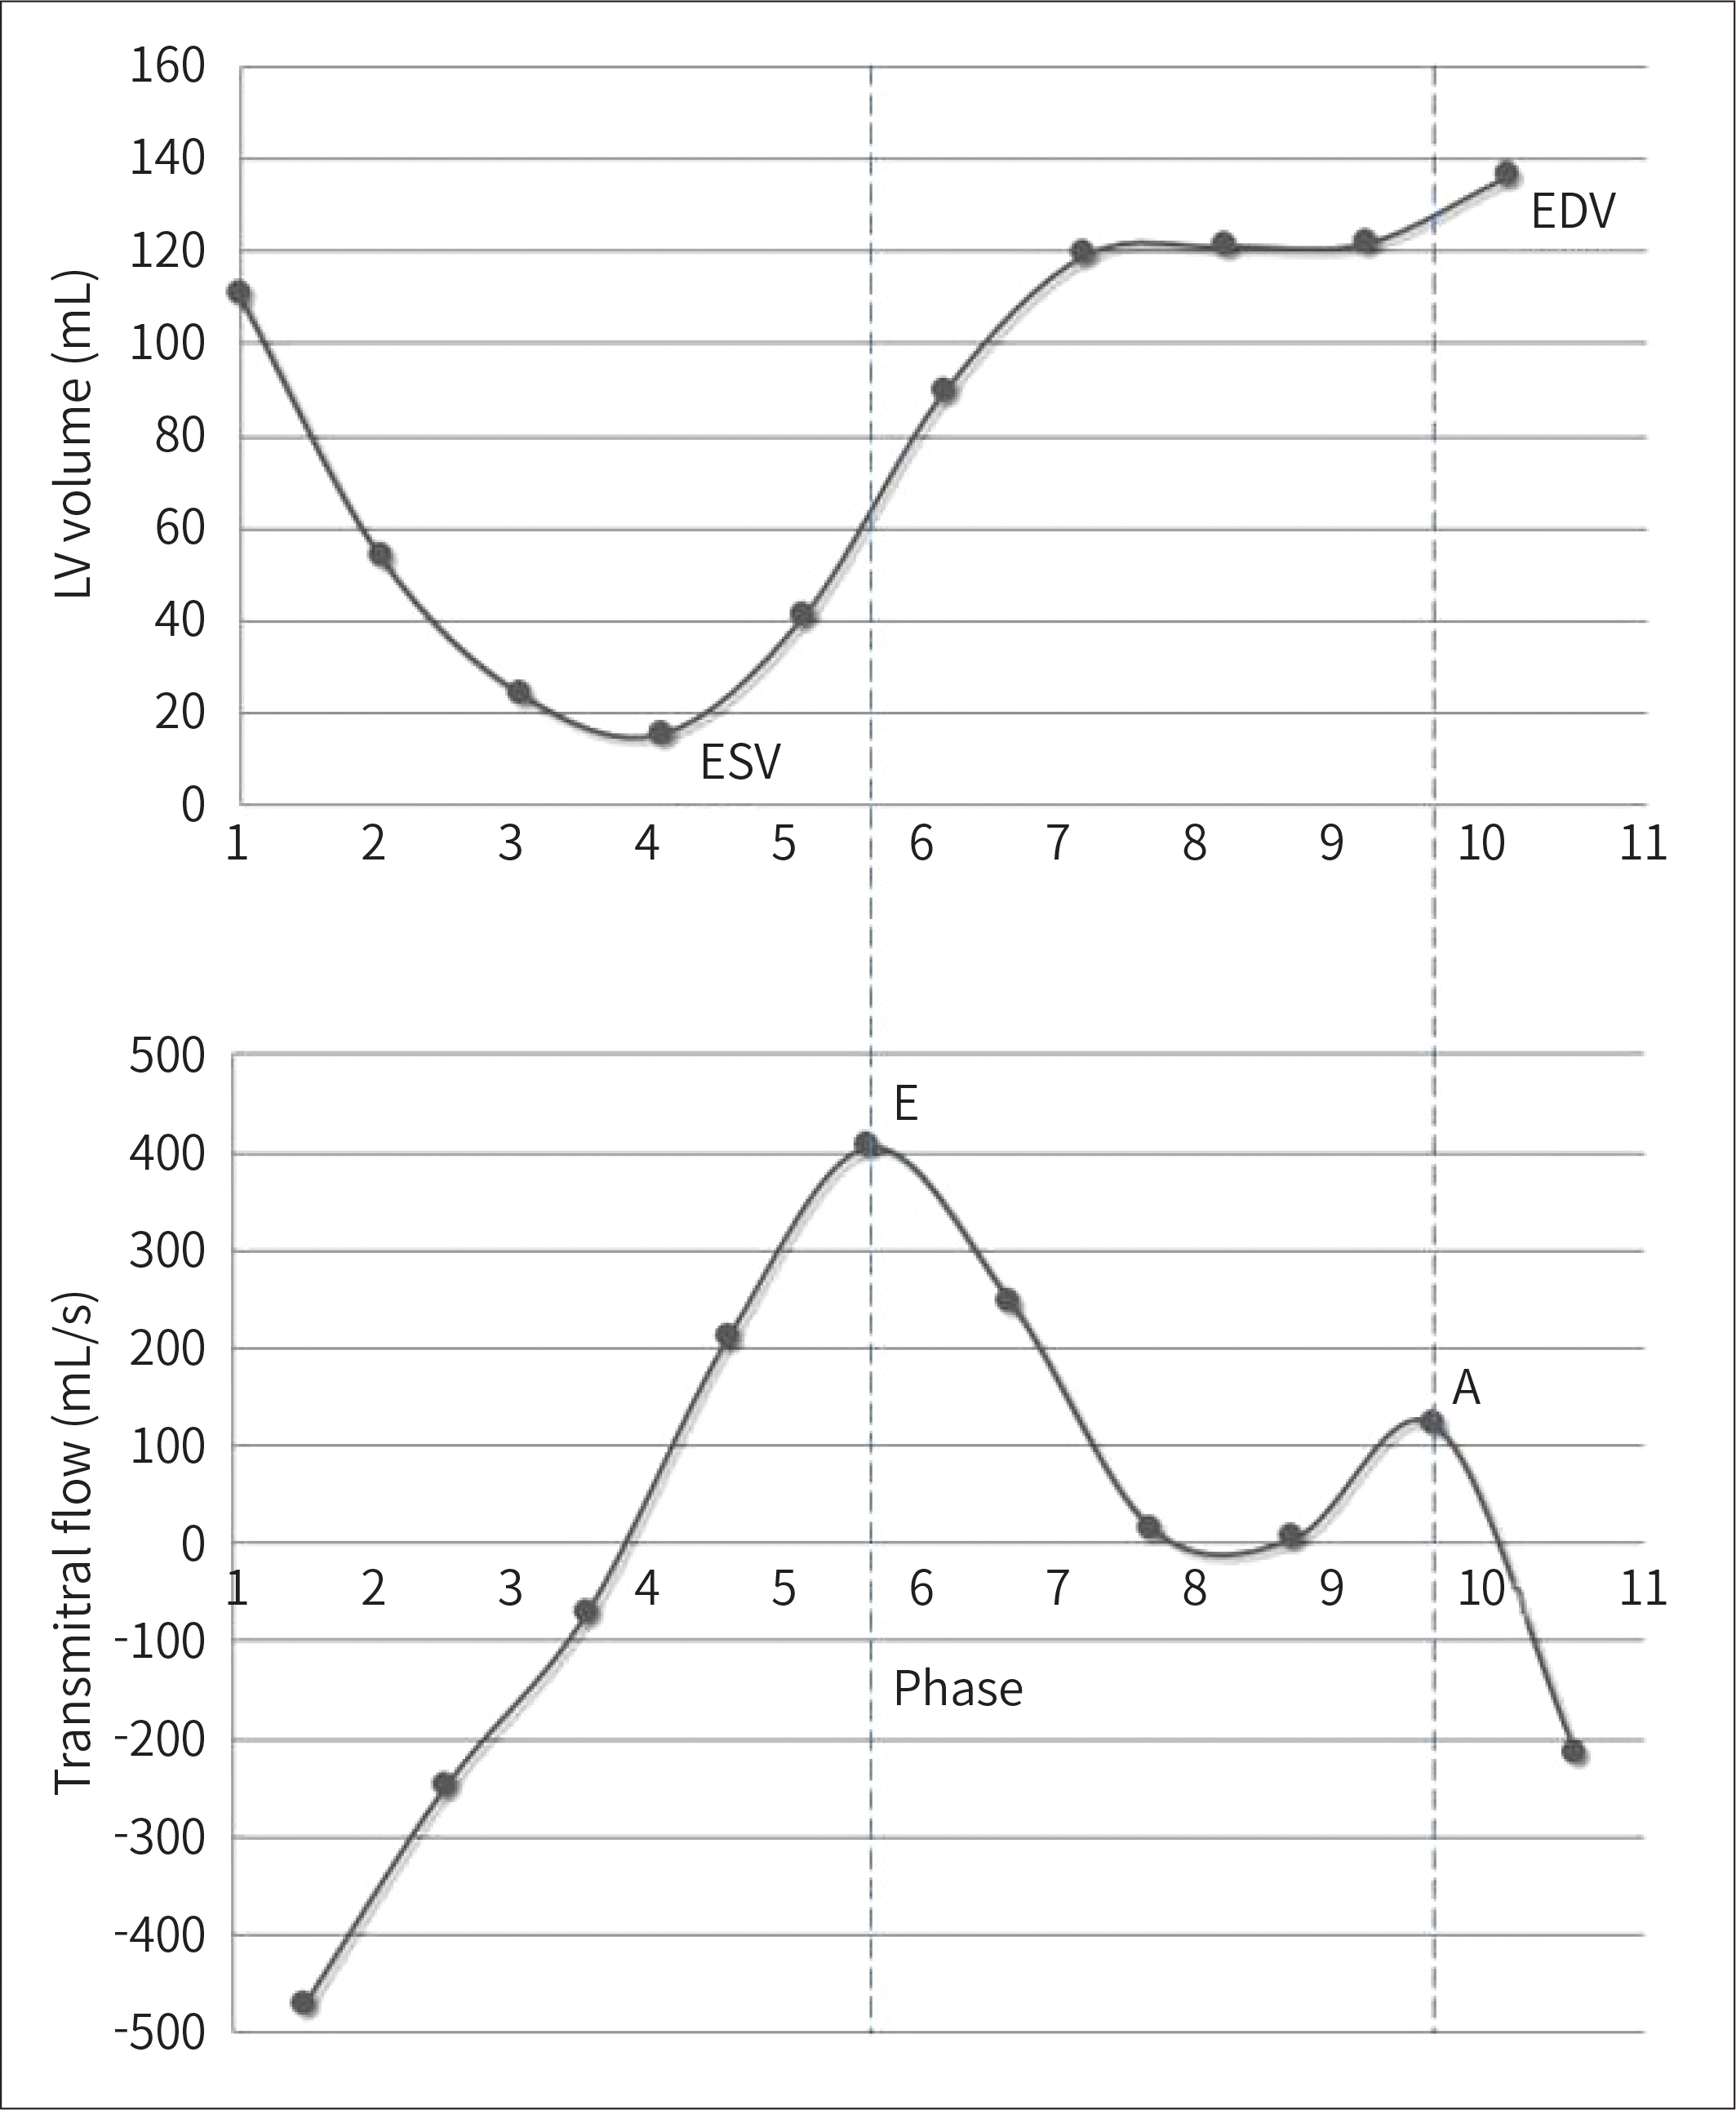
 | Fig. 1.The systolic functional analysis of the LV with CCTA. From CCTA with retrospective ECG gating, the LV volume is plotted along 10 phases during one cardiac cycle. Based on the LV time-volume curve (upper graph), LV volume differences between neighboring image sets were measured. Inter-phase time interval was calculated from simultaneously recorded heart rate. Subsequently, transmitral unit flow (mL/s, lower graph) was measured as inter-phase LV volume difference divided by time interval. A = peak trans-mitral velocity in late diastole, CCTA = coronary computed tomographic angiography, E = peak transmitral velocity in early diastole, ECG = electrocardiography, EDV = end diastolic volume, ESV = end systolic volume, LV = left ventricle |
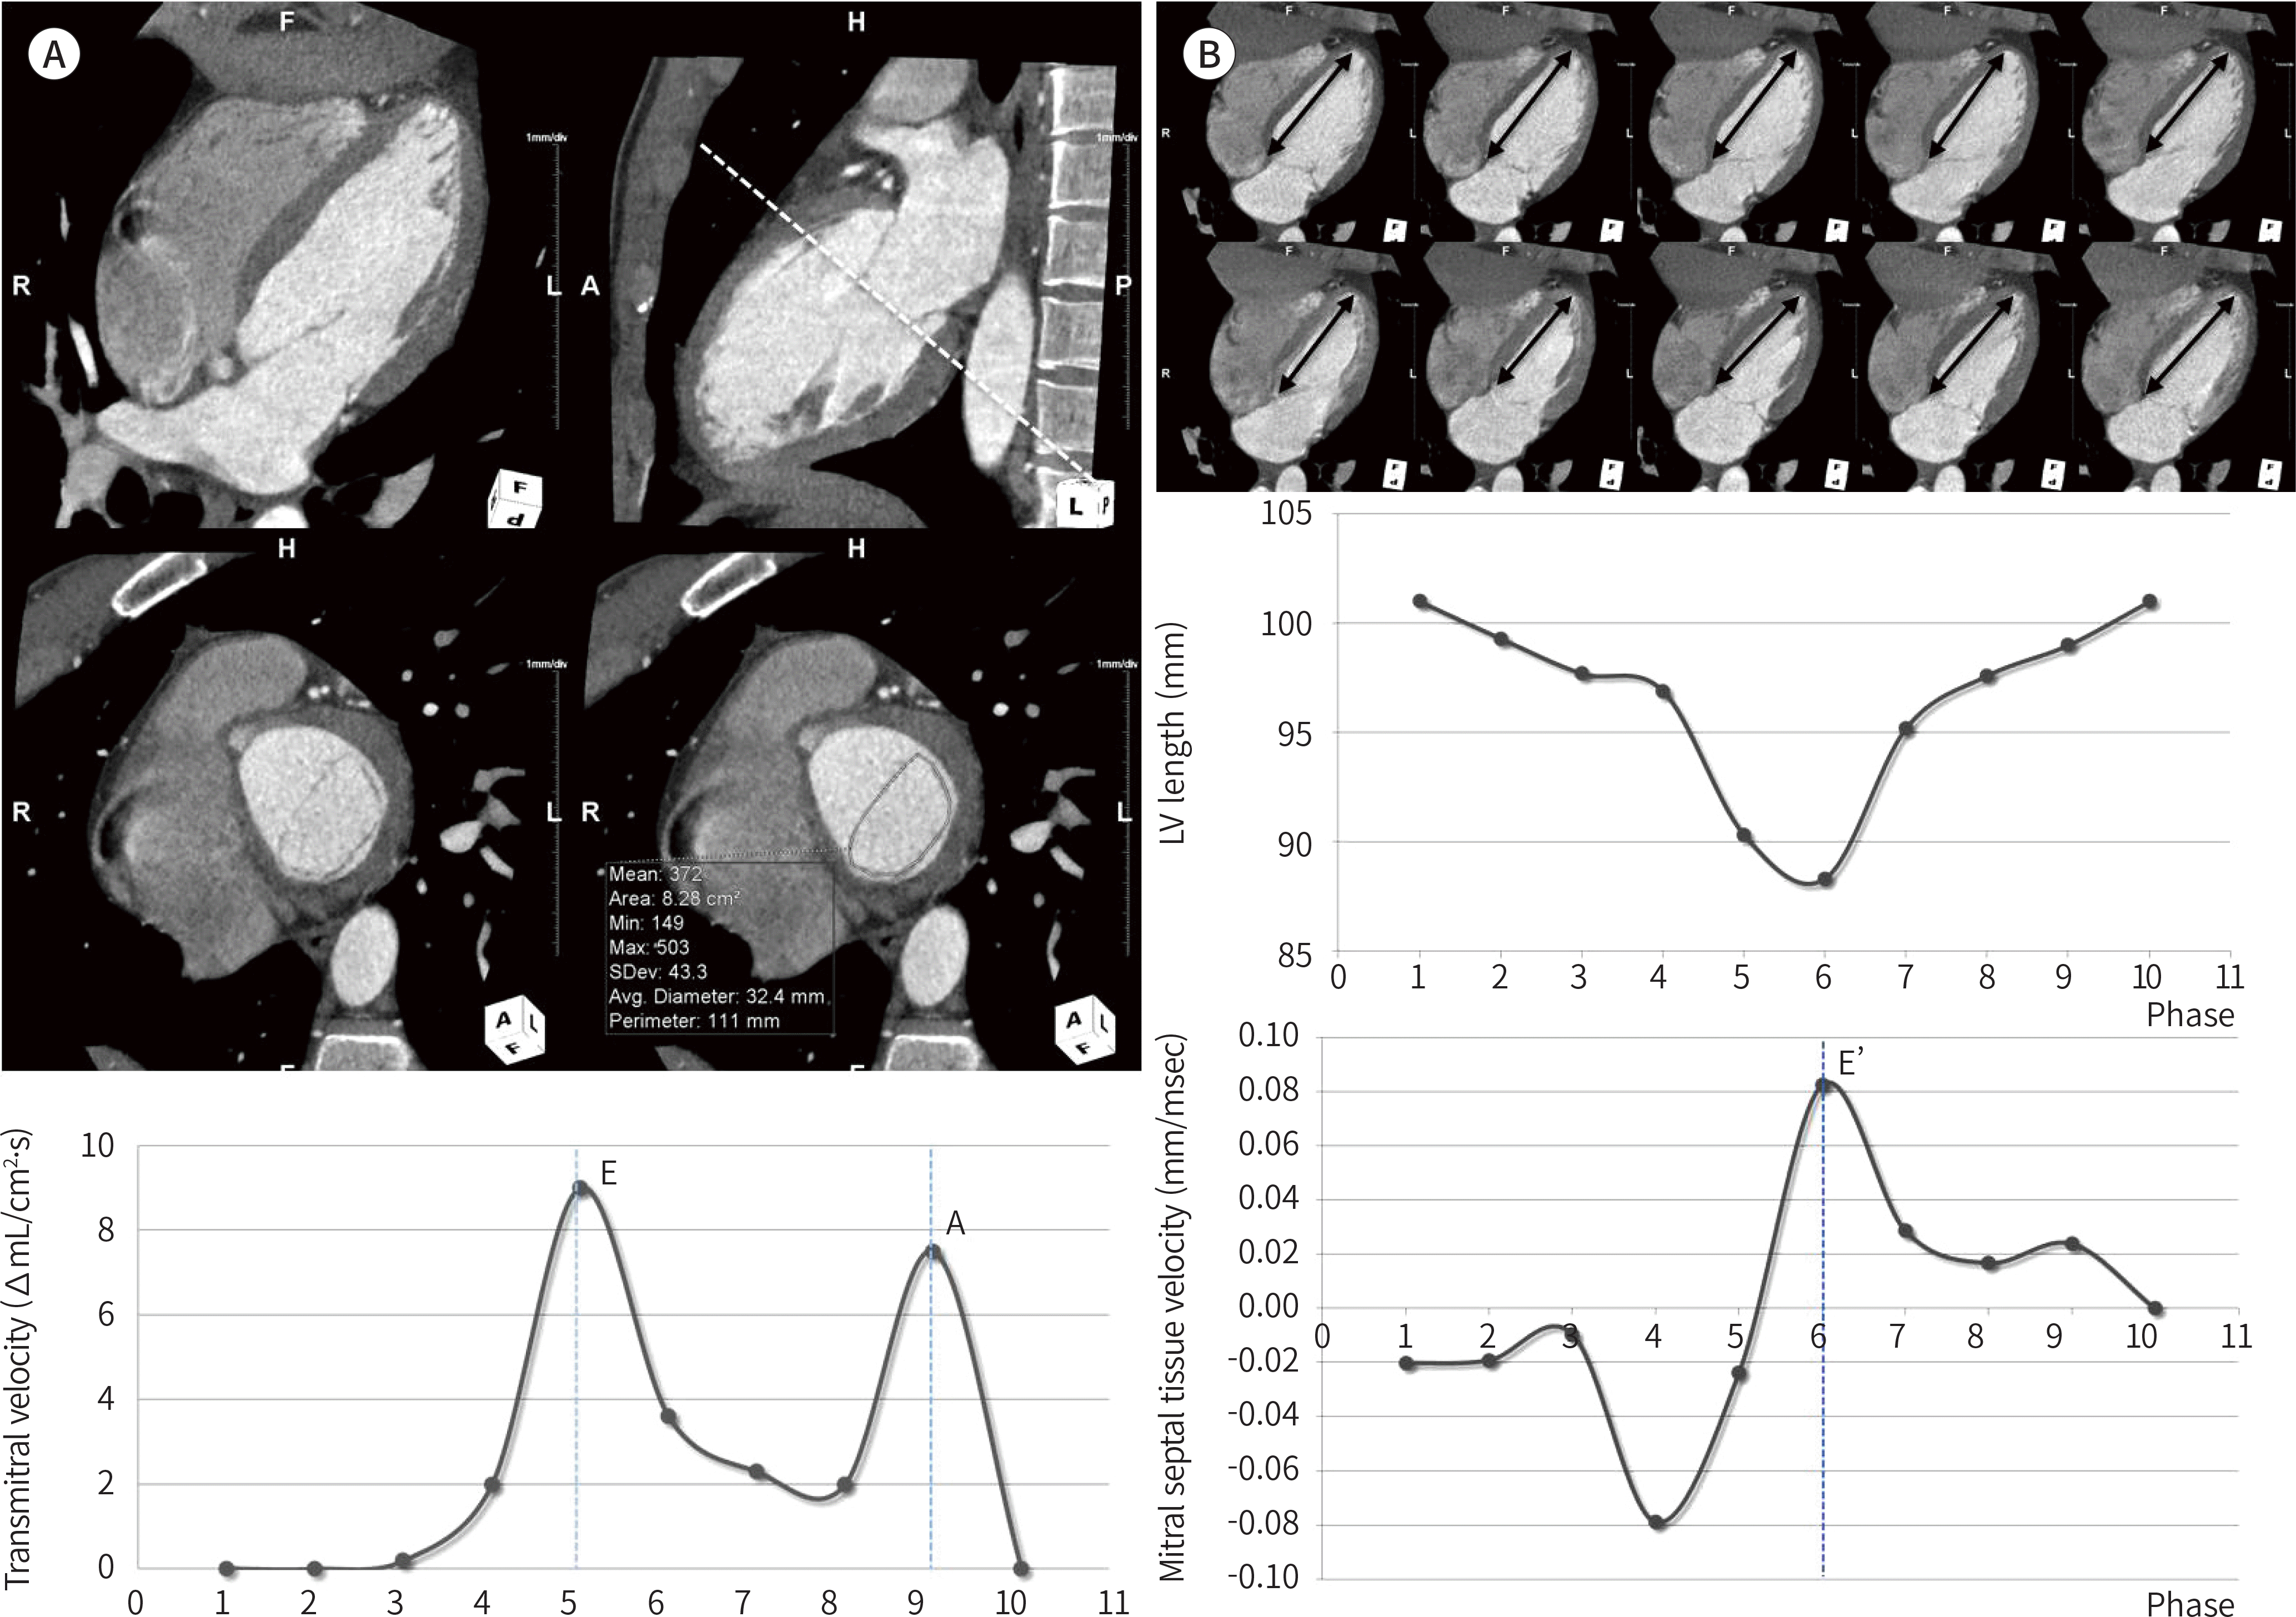
 | Fig. 2.The diastolic functional analysis of the LV with coronary computed tomography angiography. A. Mitral valvular orifice area is measured on the mitral valvular ‘en face' plane (dotted line) at distal end level of valvular leaflets on neighboring phase images. The LV axis for ‘en face' plane of mitral valve was positioned perpendicular to mid-mitral valve annulus on both 4-chamber view and 2-chamber view plans. Transmitral flow velocity at each cardiac phase can be measured from inter-phase LV volume change divided by mitral valvular orifice area. Early filling velocity (E) and atrial filling velocity (A) can be depicted atmid-systolic and end-diastolic phases. B. The longitudinal LV lengths (arrows) are measured for each phase between the annular attachment site of septal mitral valve leaflet and cardiac apex. For each phase, mitral septal annular velocity was computed using traveling distance of mitral septal annulus and heart rate. Finally, the early-diastolic mitral valvular annular tissue velocity (E') can be calculated. LV = left ventricle |
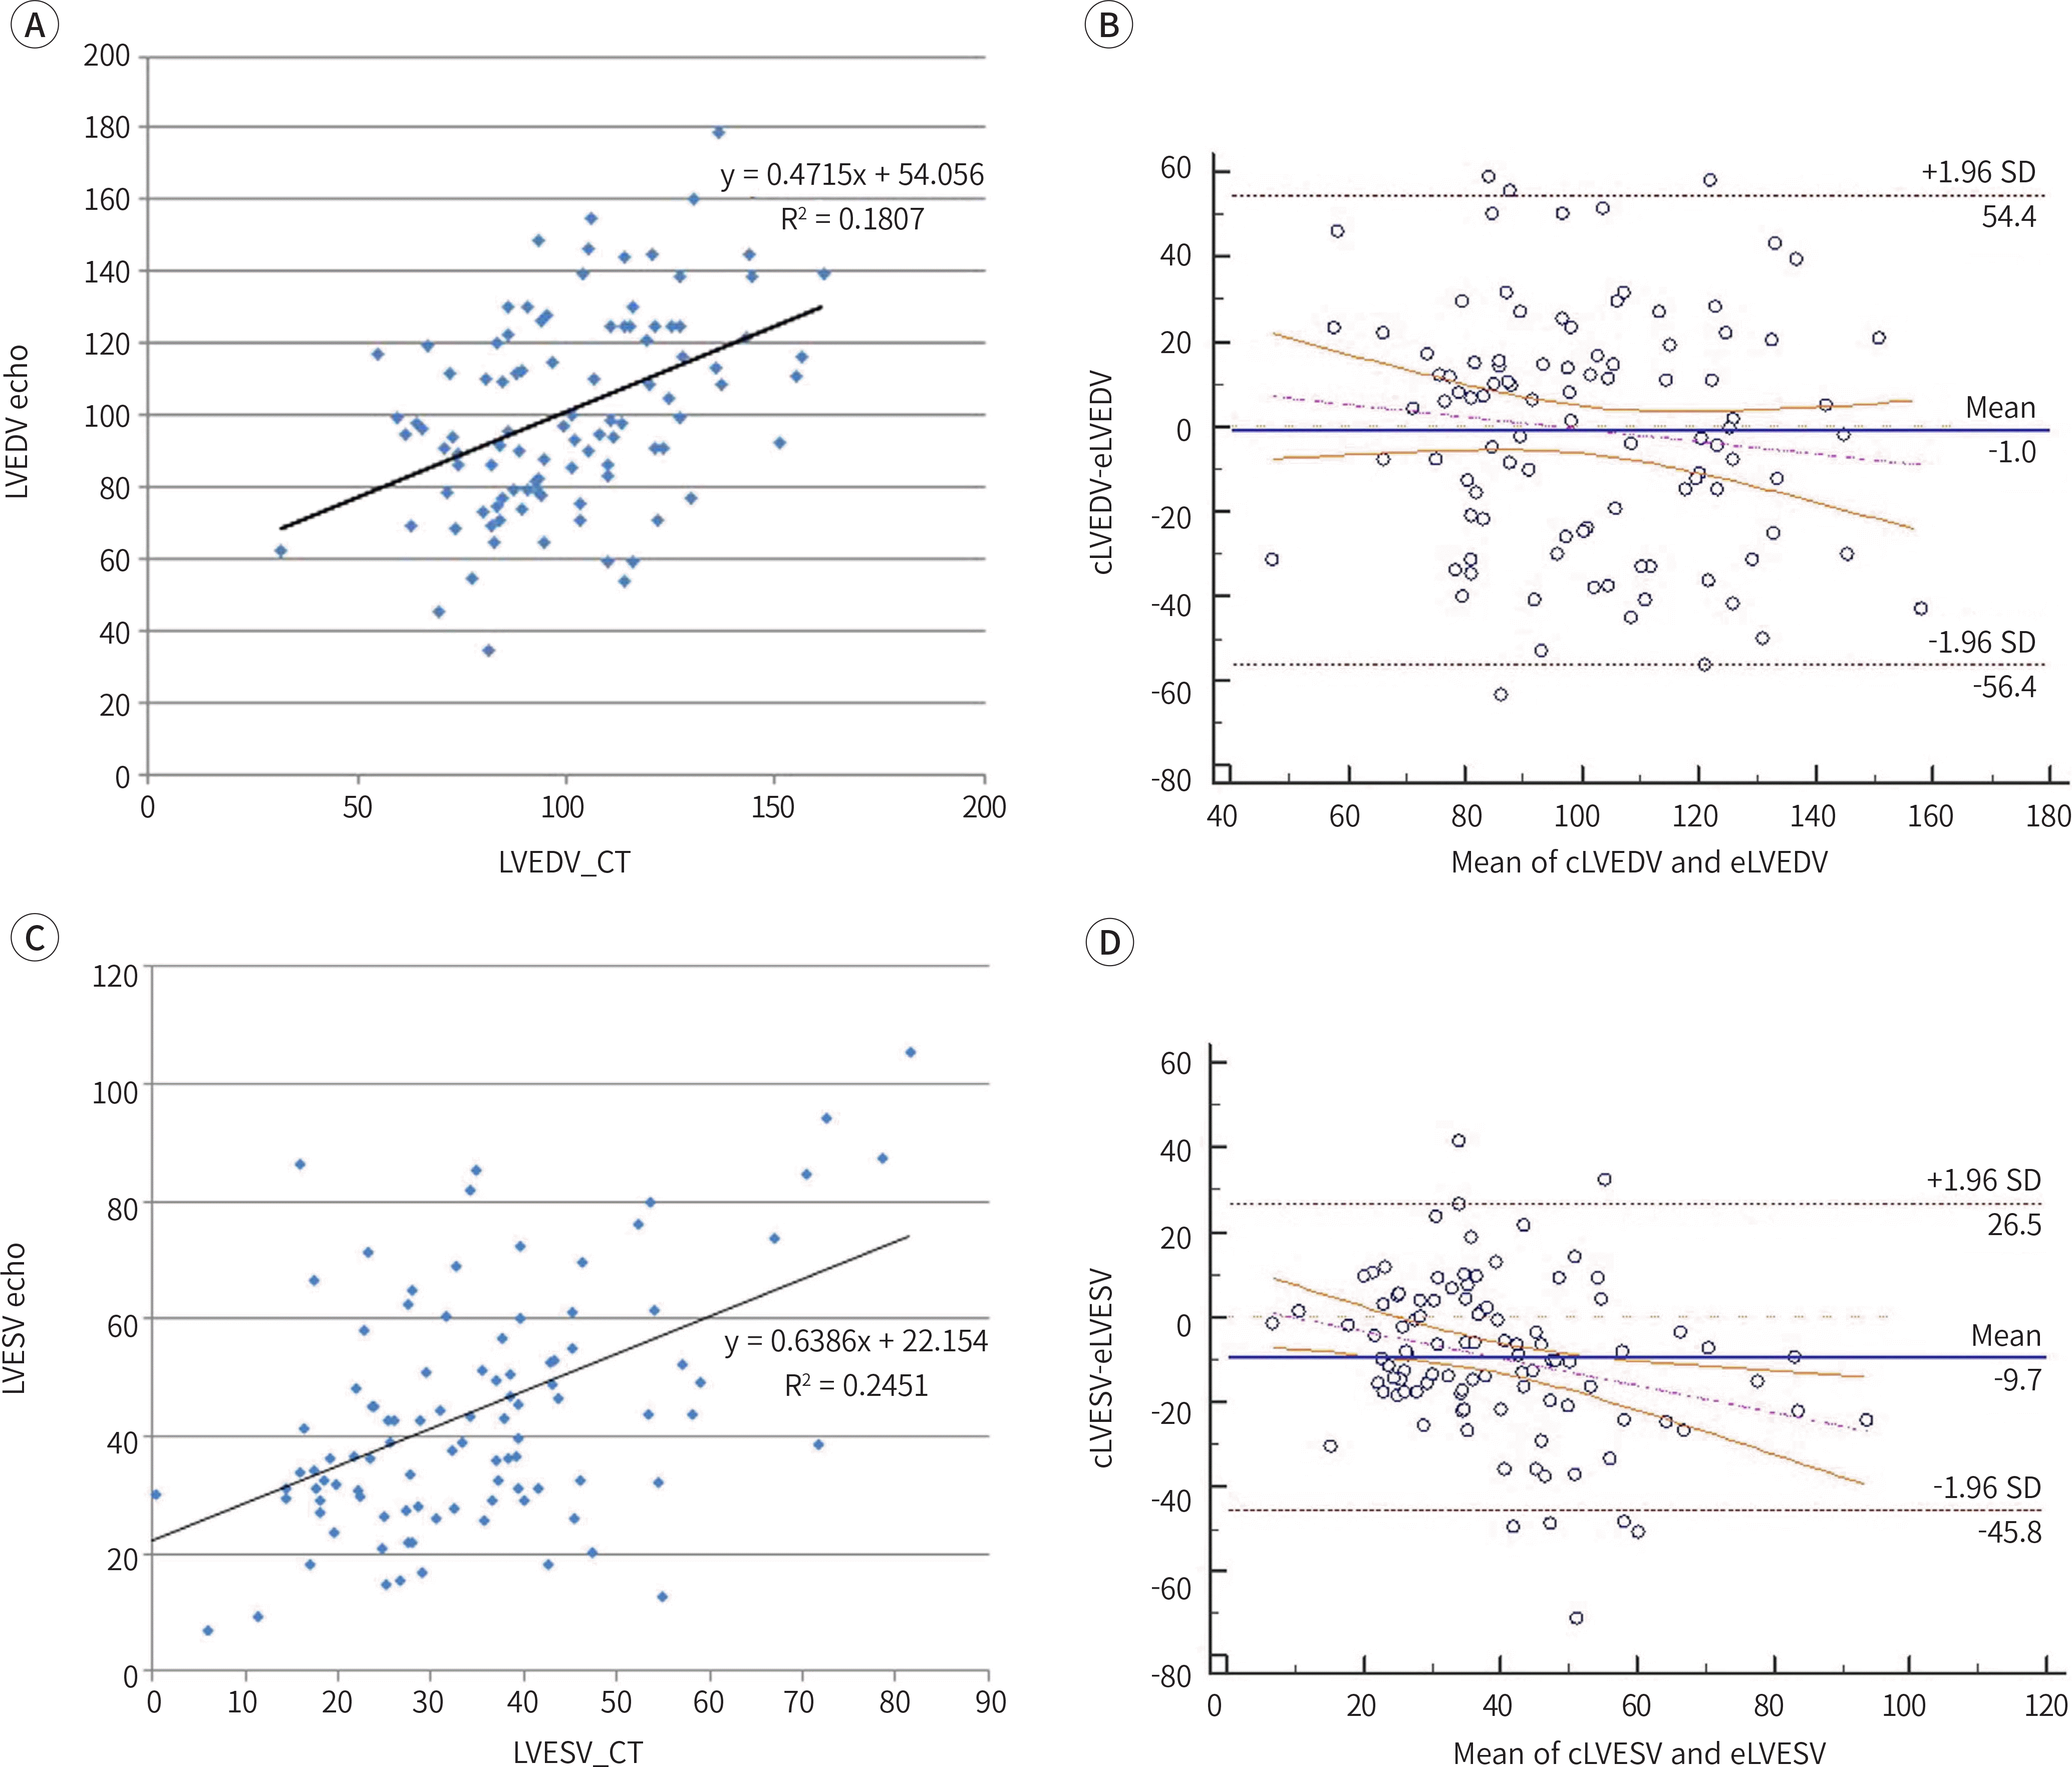
 | Fig. 3.Comparisons of CCTA and 2DE for LV end diastolic volumes (A, B) and end-systolic volumes (C, D). Scatter plots (A, C) show the correlations between the both techniques. Bland-Altman plots (B, D) showing the difference (vertical axis) and average (horizontal axis) of the measurements in two techniques. 2DE = two-dimensional Doppler echocardiography, CCTA = coronary computed tomography angiography, cLVEDV = LV end-diastolic volume on CCTA, cLVESV = LV end-systolic volume on CCTA, CT = computed tomography, eLVEDV = LV end-diastolic volume on 2DE, eLVESV = LV end-systolic volume on 2DE, LV = left ventricle, SD = standard deviation |
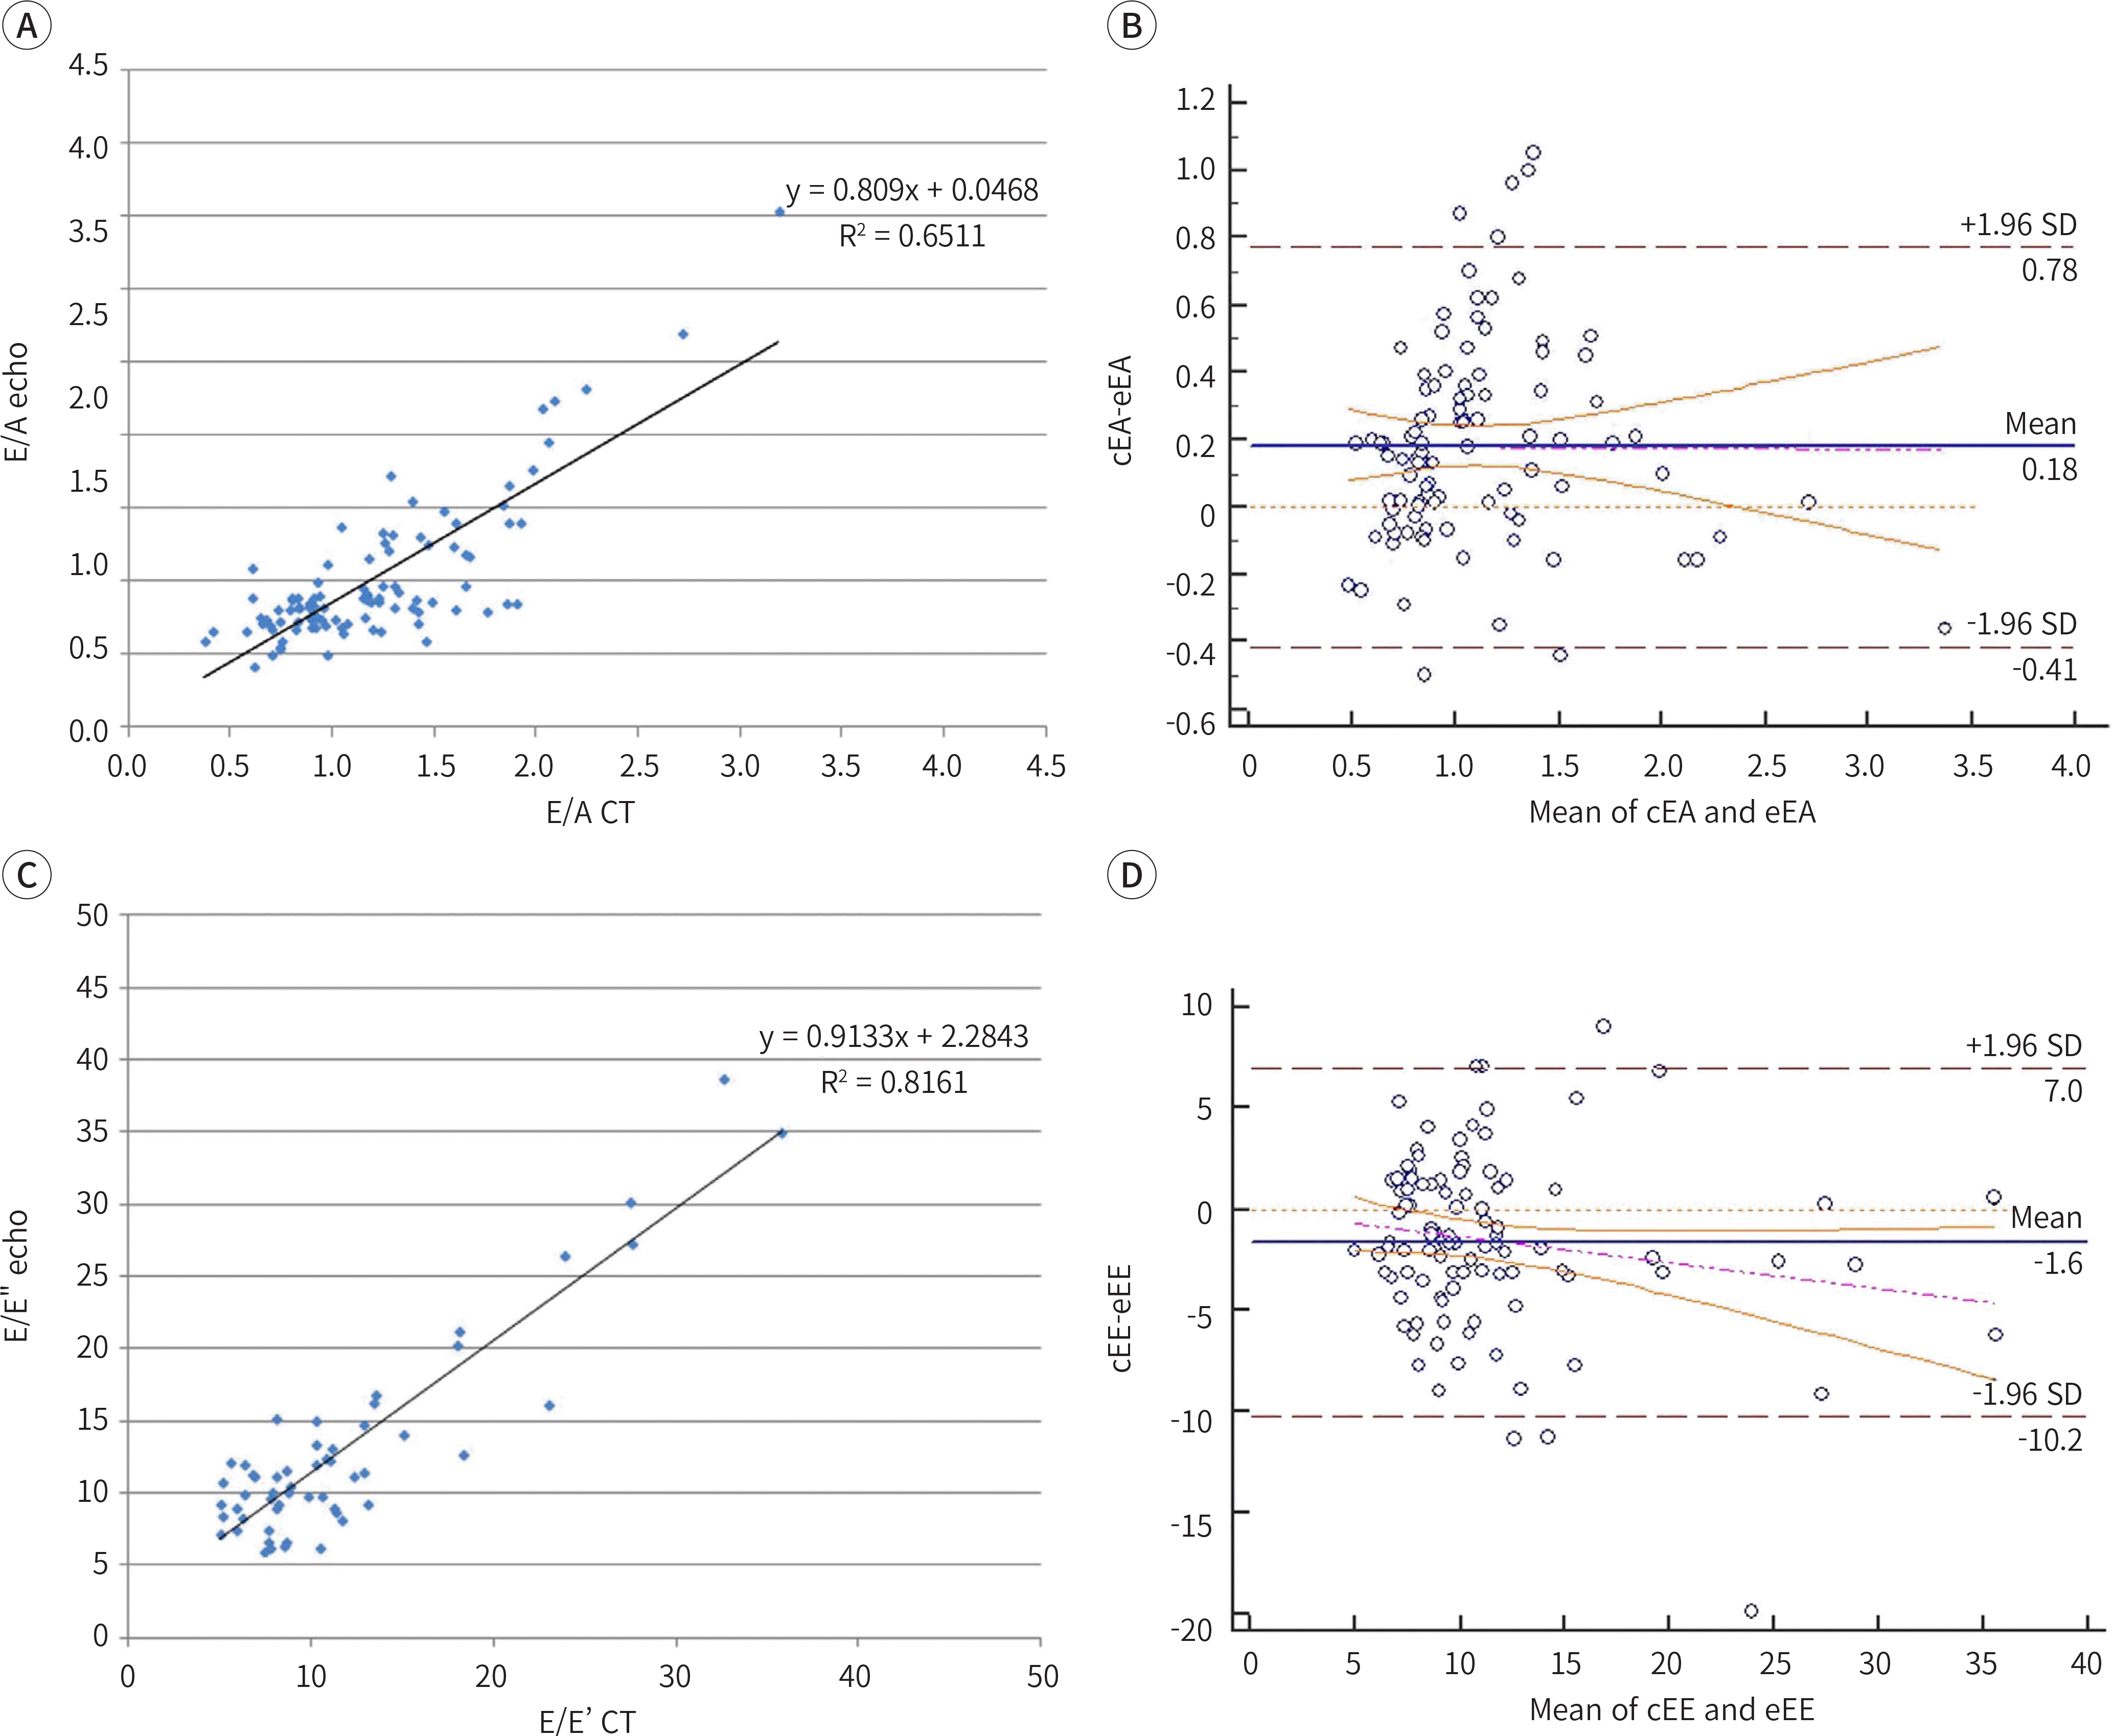
 | Fig. 4.Comparisons of CCTA and 2DE for E/A (A, B) and E/E' (C, D). Scatter plots (A, C) show the correlations between the both techniques. Bland-Altman plots (B, D) showing the difference (vertical axis) and average (horizontal axis) of the measurements in two techniques. 2DE = two-dimensional Doppler echocardiography, CCTA = coronary computed tomography angiography, cEA = E/A on CCTA, cEE = E/E' on CCTA, CT = computed tomography, eEA = E/A on 2DE, eEE = E/E' on 2DE, SD = standard deviation |
Table 1.
Data are expressed as the mean ± standard deviation. 2DE = two-dimensional echocardiography, CCTA = coronary computed tomographic angiography, CO = cardiac output, E/A = early (E) to late (A) mitral inflow peak velocities ratio, E/E' = mitral peak velocity of early filling (E) to early diastolic mitral annular velocity (E') ratio, LV = left ventricle, LVEDV = LV end-diastolic volume, LVEF = LV ejection fraction, LVESV = LV end-systolic volume, LVMM = LV myocardial mass, SV = stroke volume
Table 2.
CI = confidence interval, E/A = early (E) to late (A) mitral inflow peak velocities ratio, E/E' = mitral peak velocity of early filling (E) to early diastolic mitral annular velocity (E') ratio, ICC = intraclass correlation coefficient, LV = left ventricle, LVEDV = LV end-diastolic volume, LVEF = LV ejection fraction, LVESV = LV end-systolic volume, LVMM = LV myocardial mass, SV = stroke volum


 PDF
PDF ePub
ePub Citation
 Print
Print


 XML Download