Abstract
Purpose
Various studies have investigated factors related to the prevalence of allergic rhinitis (AR). We studied the correlation between the outbreaks of AR and airborne pollen in September.
Methods
According to data from the National Health Insurance Service, the number of AR cases was increased from 2012 to 2016. During the same period, the number of patients with upper respiratory tract infection, respiratory virus detection rate, air pollutants, and concentration of airborne pollen were correlated with the occurrence of AR in correlation analysis.
Results
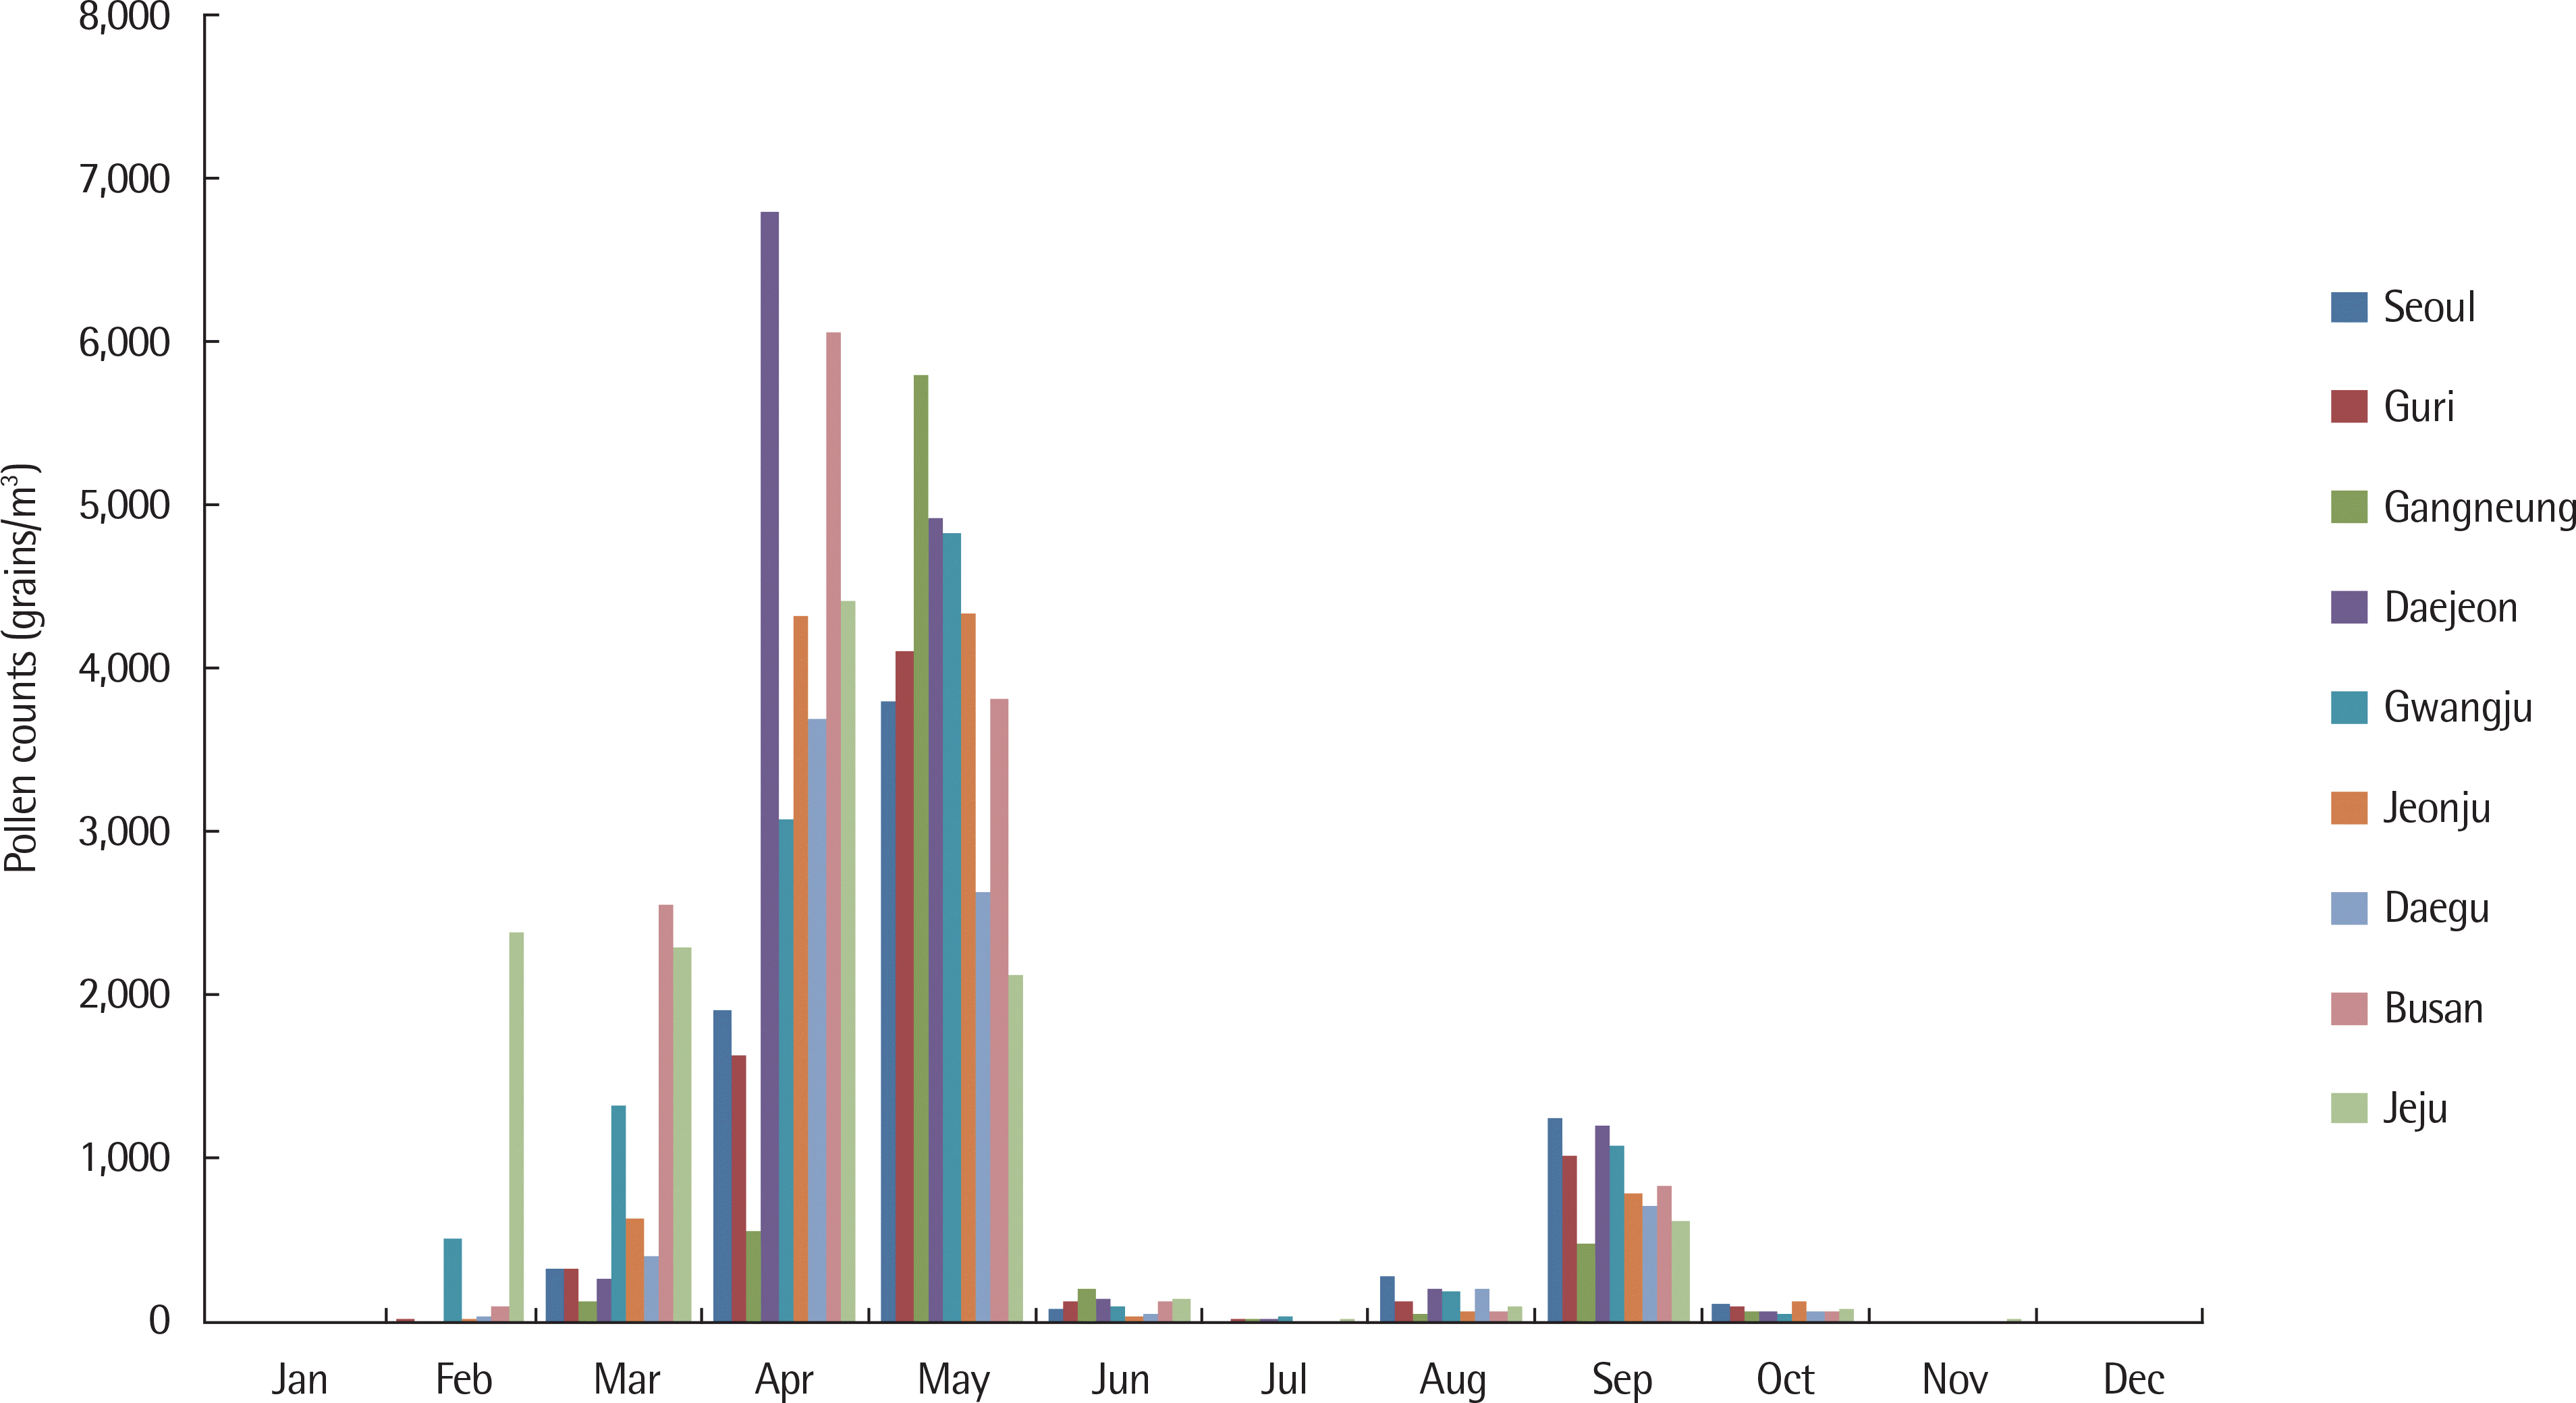
The number of patients with AR showed increasing biphasic patters in the spring and fall with the peak reached in September (278,487±12,894), while April marked the fifth-highest figure with 241,570±132,677. The concentration of airborne pollen was highest at 4,450 grains/m3 in May, followed by 3,597 grains/m3 in April, marking its peak in the spring. September marked the third-highest level at 1,619 grains/m3. According to the monthly correlation between the number of patients with AR and pollen, Seoul and Daejeon showed correlations of ρ=0.929 (P=0.022) and ρ=0.955 (P=0.011), respectively, in September. There were no significant correlations among AR, air pollutants, and respiratory virus detection rate.
Conclusion
Based on this study, the monthly number of patients with AR was the highest in September. In September, we found the correlation between allergic rhinitis and pollen, although there are regional limitations, regarding outbreaks in the number of patients with AR. Further research and attention are needed to prepare measures against airborne weed pollen during the fall.
Go to : 
References
1. Settipane RA, Charnock DR. Epidemiology of rhinitis: allergic and nonallergic. Clin Allergy Immunol. 2007; 19:23–34.
2. Bousquet J, Van Cauwenberge P, Khaltaev N. Aria Workshop Group; World Health Organization. Allergic rhinitis and its impact on asthma. J Allergy Clin Immunol. 2001; 108(5 Suppl):S147–334.

3. Asher MI, Montefort S, Björkstén B, Lai CK, Strachan DP, Weiland SK, et al. Worldwide time trends in the prevalence of symptoms of asthma, allergic rhinoconjunctivitis, and eczema in childhood: ISAAC Phases One and Three repeat multicountry cross-sectional surveys. Lancet. 2006; 368:733–43.

4. Hwang SH, Jung SY, Lim DH, Son BK, Kim JH, Yang JM, et al. Epidemiology of allergic rhinitis in Korean children. Allergy Asthma Respir Dis. 2013; 1:321–32.

5. Beggs PJ. Impacts of climate change on aeroallergens: past and future. Clin Exp Allergy. 2004; 34:1507–13.

6. Kim JH, Oh JW, Lee HB, Kim SW, Chung HL, Kook MH, et al. Evaluation of the association of vegetation of allergenic plants and pollinosis with meteorological changes. Allergy Asthma Respir Dis. 2014; 2:48–58.

9. Hong CS. House dust mite and clinical allergy. Allergy. 1991; 11:297–308.
10. Yong TS, Jeong KY. Review on ecology of house dust mites in Korea and suggestion of a standard survey method. Pediatr Allergy Respir Dis. 2011; 21:4–16.

11. Jeong KY, Park JW, Hong CS. House dust mite allergy in Korea: the most important inhalant allergen in current and future. Allergy Asthma Immunol Res. 2012; 4:313–25.

12. Hong CS. Measurement of group I allergens of house dust mites in dusts of Seoul and monthly variation of Derf I. J Korean Soc Allergol. 1992; 12:482–92.
13. Kim JH, Choi SY, Lee IY, Lee YW, Yong TS, Kim CW, et al. Seasonal variation of house dust mite and its influence on the inhabitant health. J of Asthma Allergy Clin Immunol. 2006; 26:27–34.
14. So HJ, Moon SJ, Hwang SY, Kim JH, Jang HJ, Jo JH, et al. Characteristics of airborne pollen in Incheon and Seoul (2015–2016). Asia Pac Allergy. 2017; 7:138–47.

15. Oh YC, Kim HA, Kang IJ, Cheong JT, Kim SW, Kook MH, et al. Evaluation of the relationship between pollen count and the outbreak of allergic diseases. Pediatr Allergy Respir Dis. 2009; 19:354–64.
16. Park KJ, Kim H, Kim KR, Oh JW, Lee SY, Choi YJ, et al. Characteristics of regional distribution of pollen concentration in Korean Peninsula. Korean J of Agric For Meteorol. 2008; 10:167–76.

17. Yang HJ, Jeon YH, Min TK, Son BS, Park KJ, Moon JY, et al. The impact of climate change on aeroalleregen and pediatric allergic diseases. J Korean Med Assoc. 2011; 54:971–8.

18. Kim KR, Park KJ, Lee HR, Kim M, Choi YJ, Oh JW, et al. Development and evaluation of the forecast models for daily pollen allergy. Korean J of Agric For Meteorol. 2012; 14:265–8.

19. Kim JH, Ghim YS, Han JS, Park SM, Shin HJ, Lee SB, et al. Long-term trend analysis of Korean air quality and its implication to current air quality policy on ozone and PM10. J Korean Soc Atmos Environ. 2018; 34:1–15.

20. Kyung SY, Jeong SH. Adverse health effects of particulate matter. J Korean Med Assoc. 2017; 5:391–8.

22. Cheng Q, Yang CY, Guo BY, Wei X, Liu M. Analysis of mechanism of PM2.5 and house dust mite antigen Der p1 in attack stage of child asthma. Eur Rev Med Pharmacol Sci. 2017; 21:2458–62.
23. Worldwide variation in prevalence of symptoms of asthma, allergic rhinoconjunctivitis, and atopic eczema: ISAAC ISAAC. The International Study of Asthma and Allergies in Childhood (ISAAC) Steering Committee. Lancet. 1998; 351:1225–32.
24. Miller RL, Ho SM. Environmental epigenetics and asthma: current concepts and call for studies. Am J Respir Crit Care Med. 2008; 177:567–73.
Go to : 
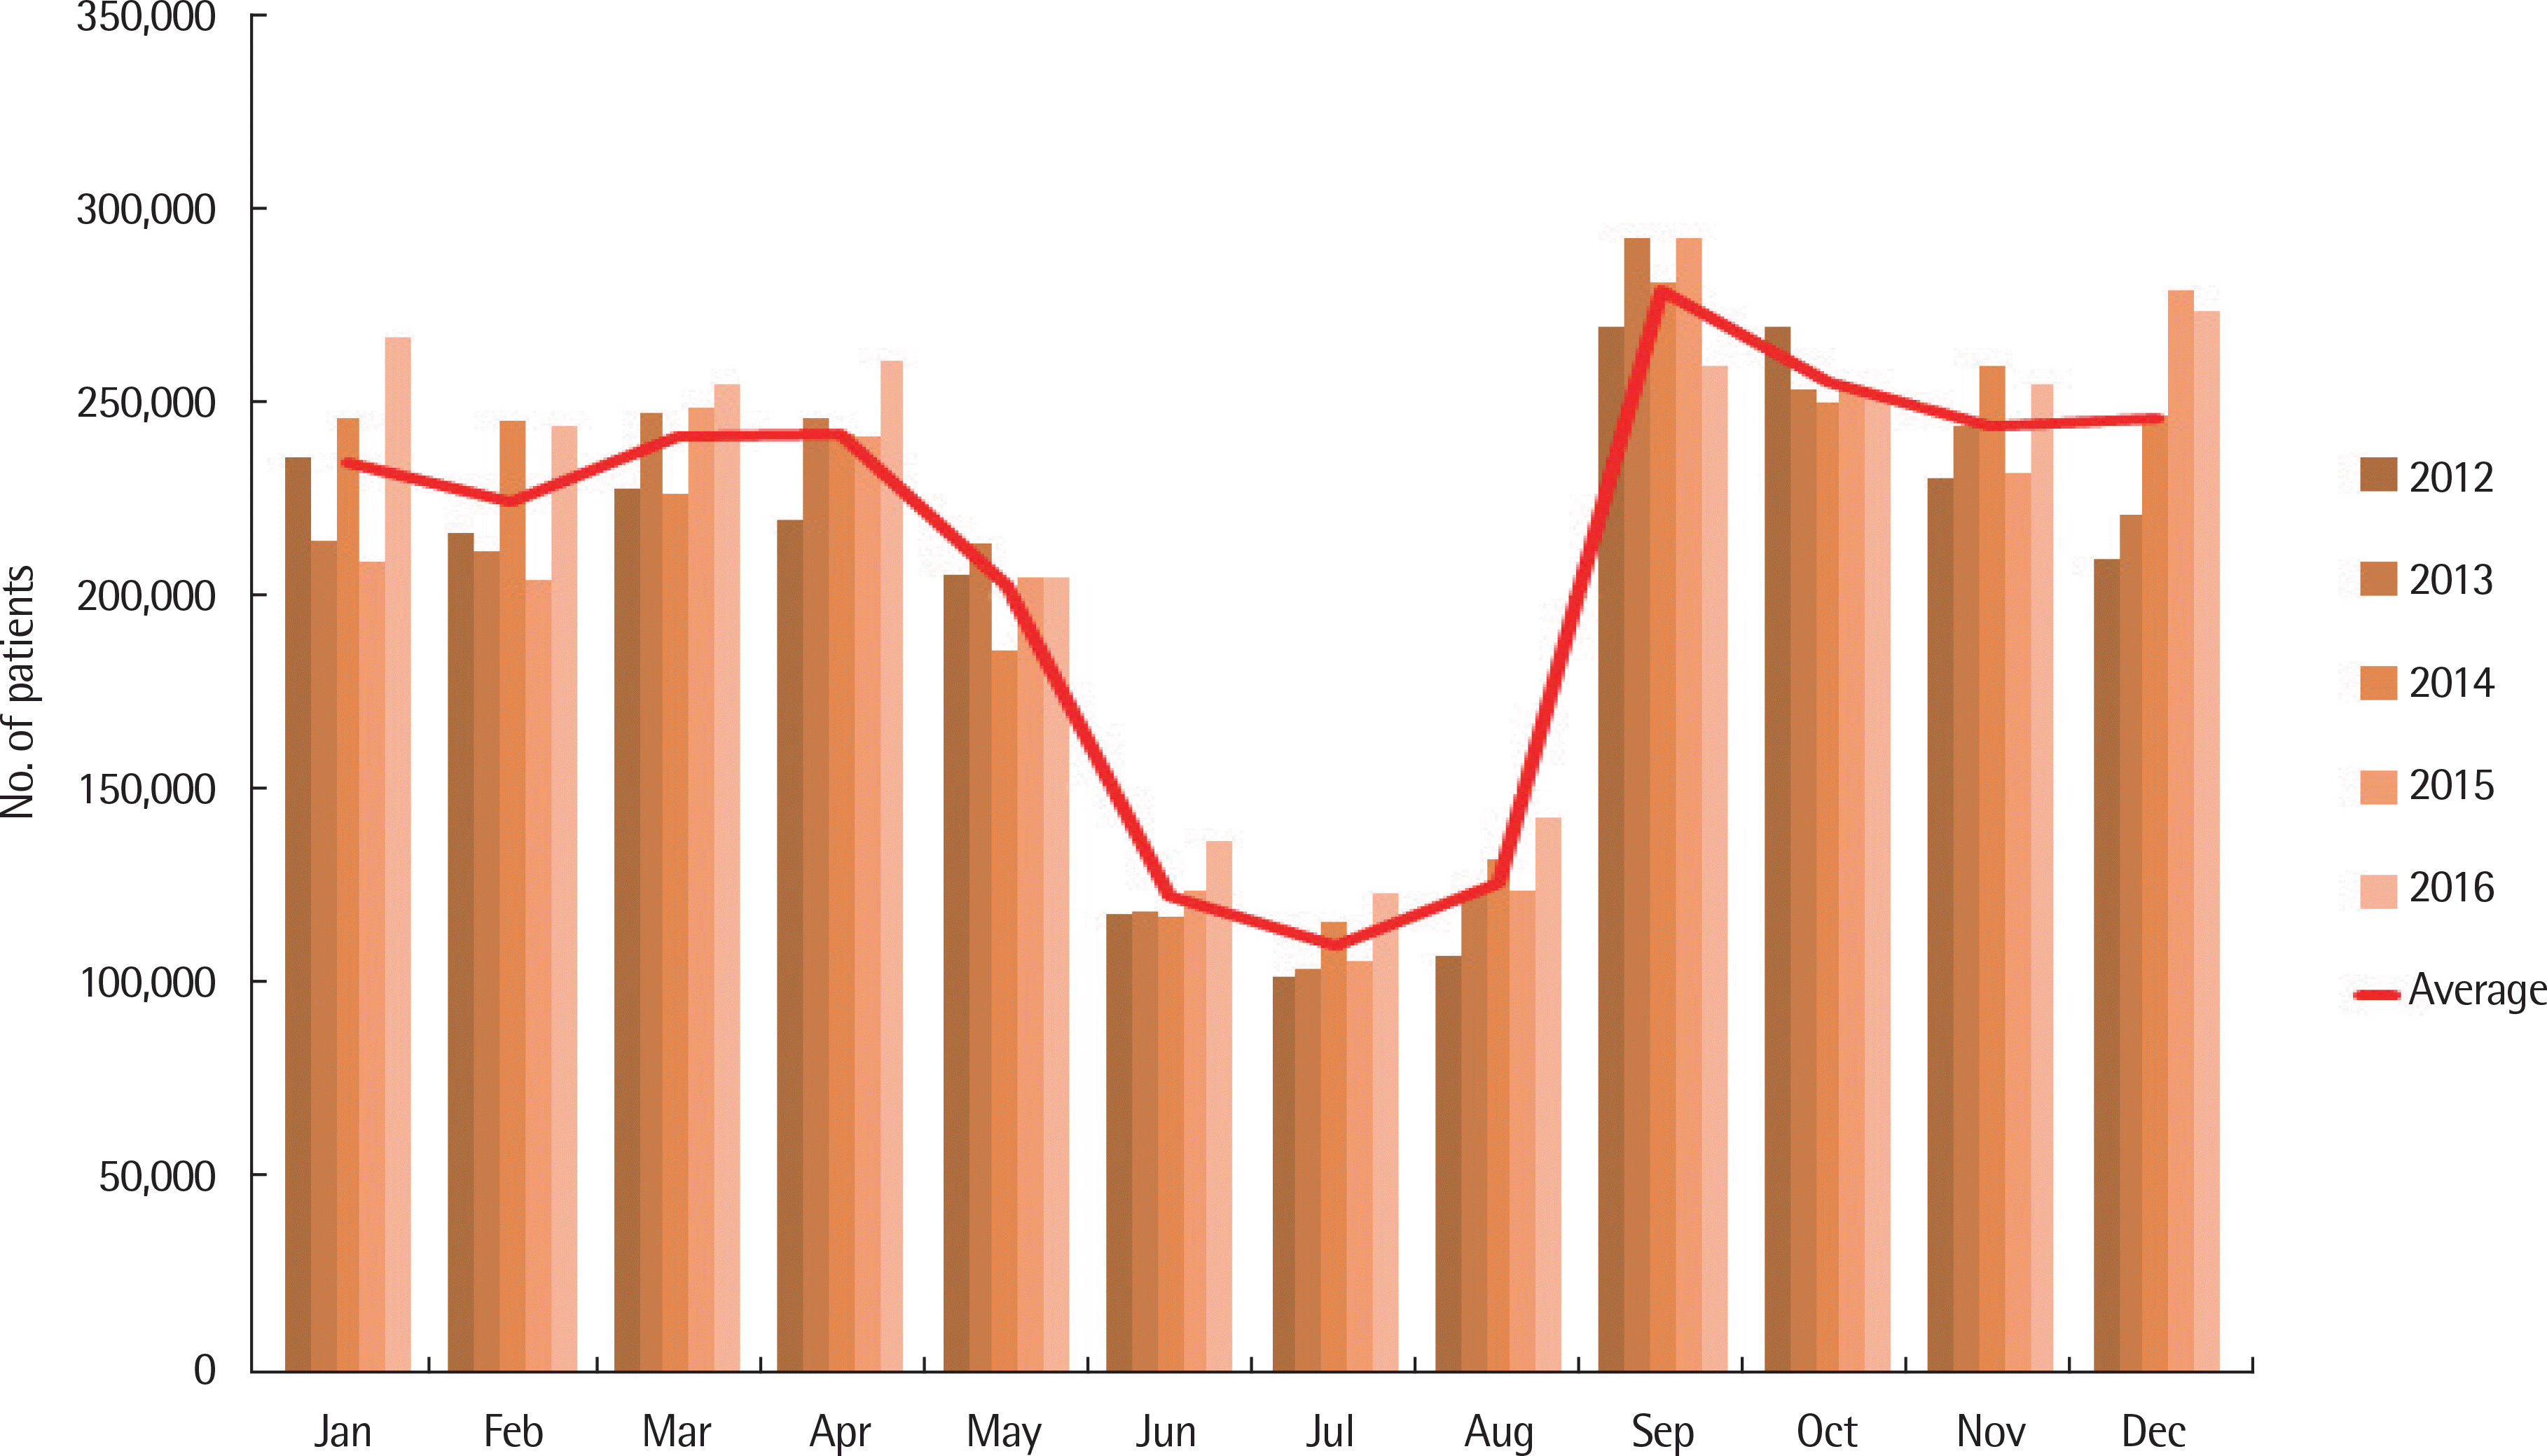 | Fig. 1.The number of patients of allergic rhinitis from National Health Insurance Service during 2012–2016. The group of allergic rhinitis patients where the actual treatment was performed show a marked increase in spring and fall, with the highest average prevalence in September. |
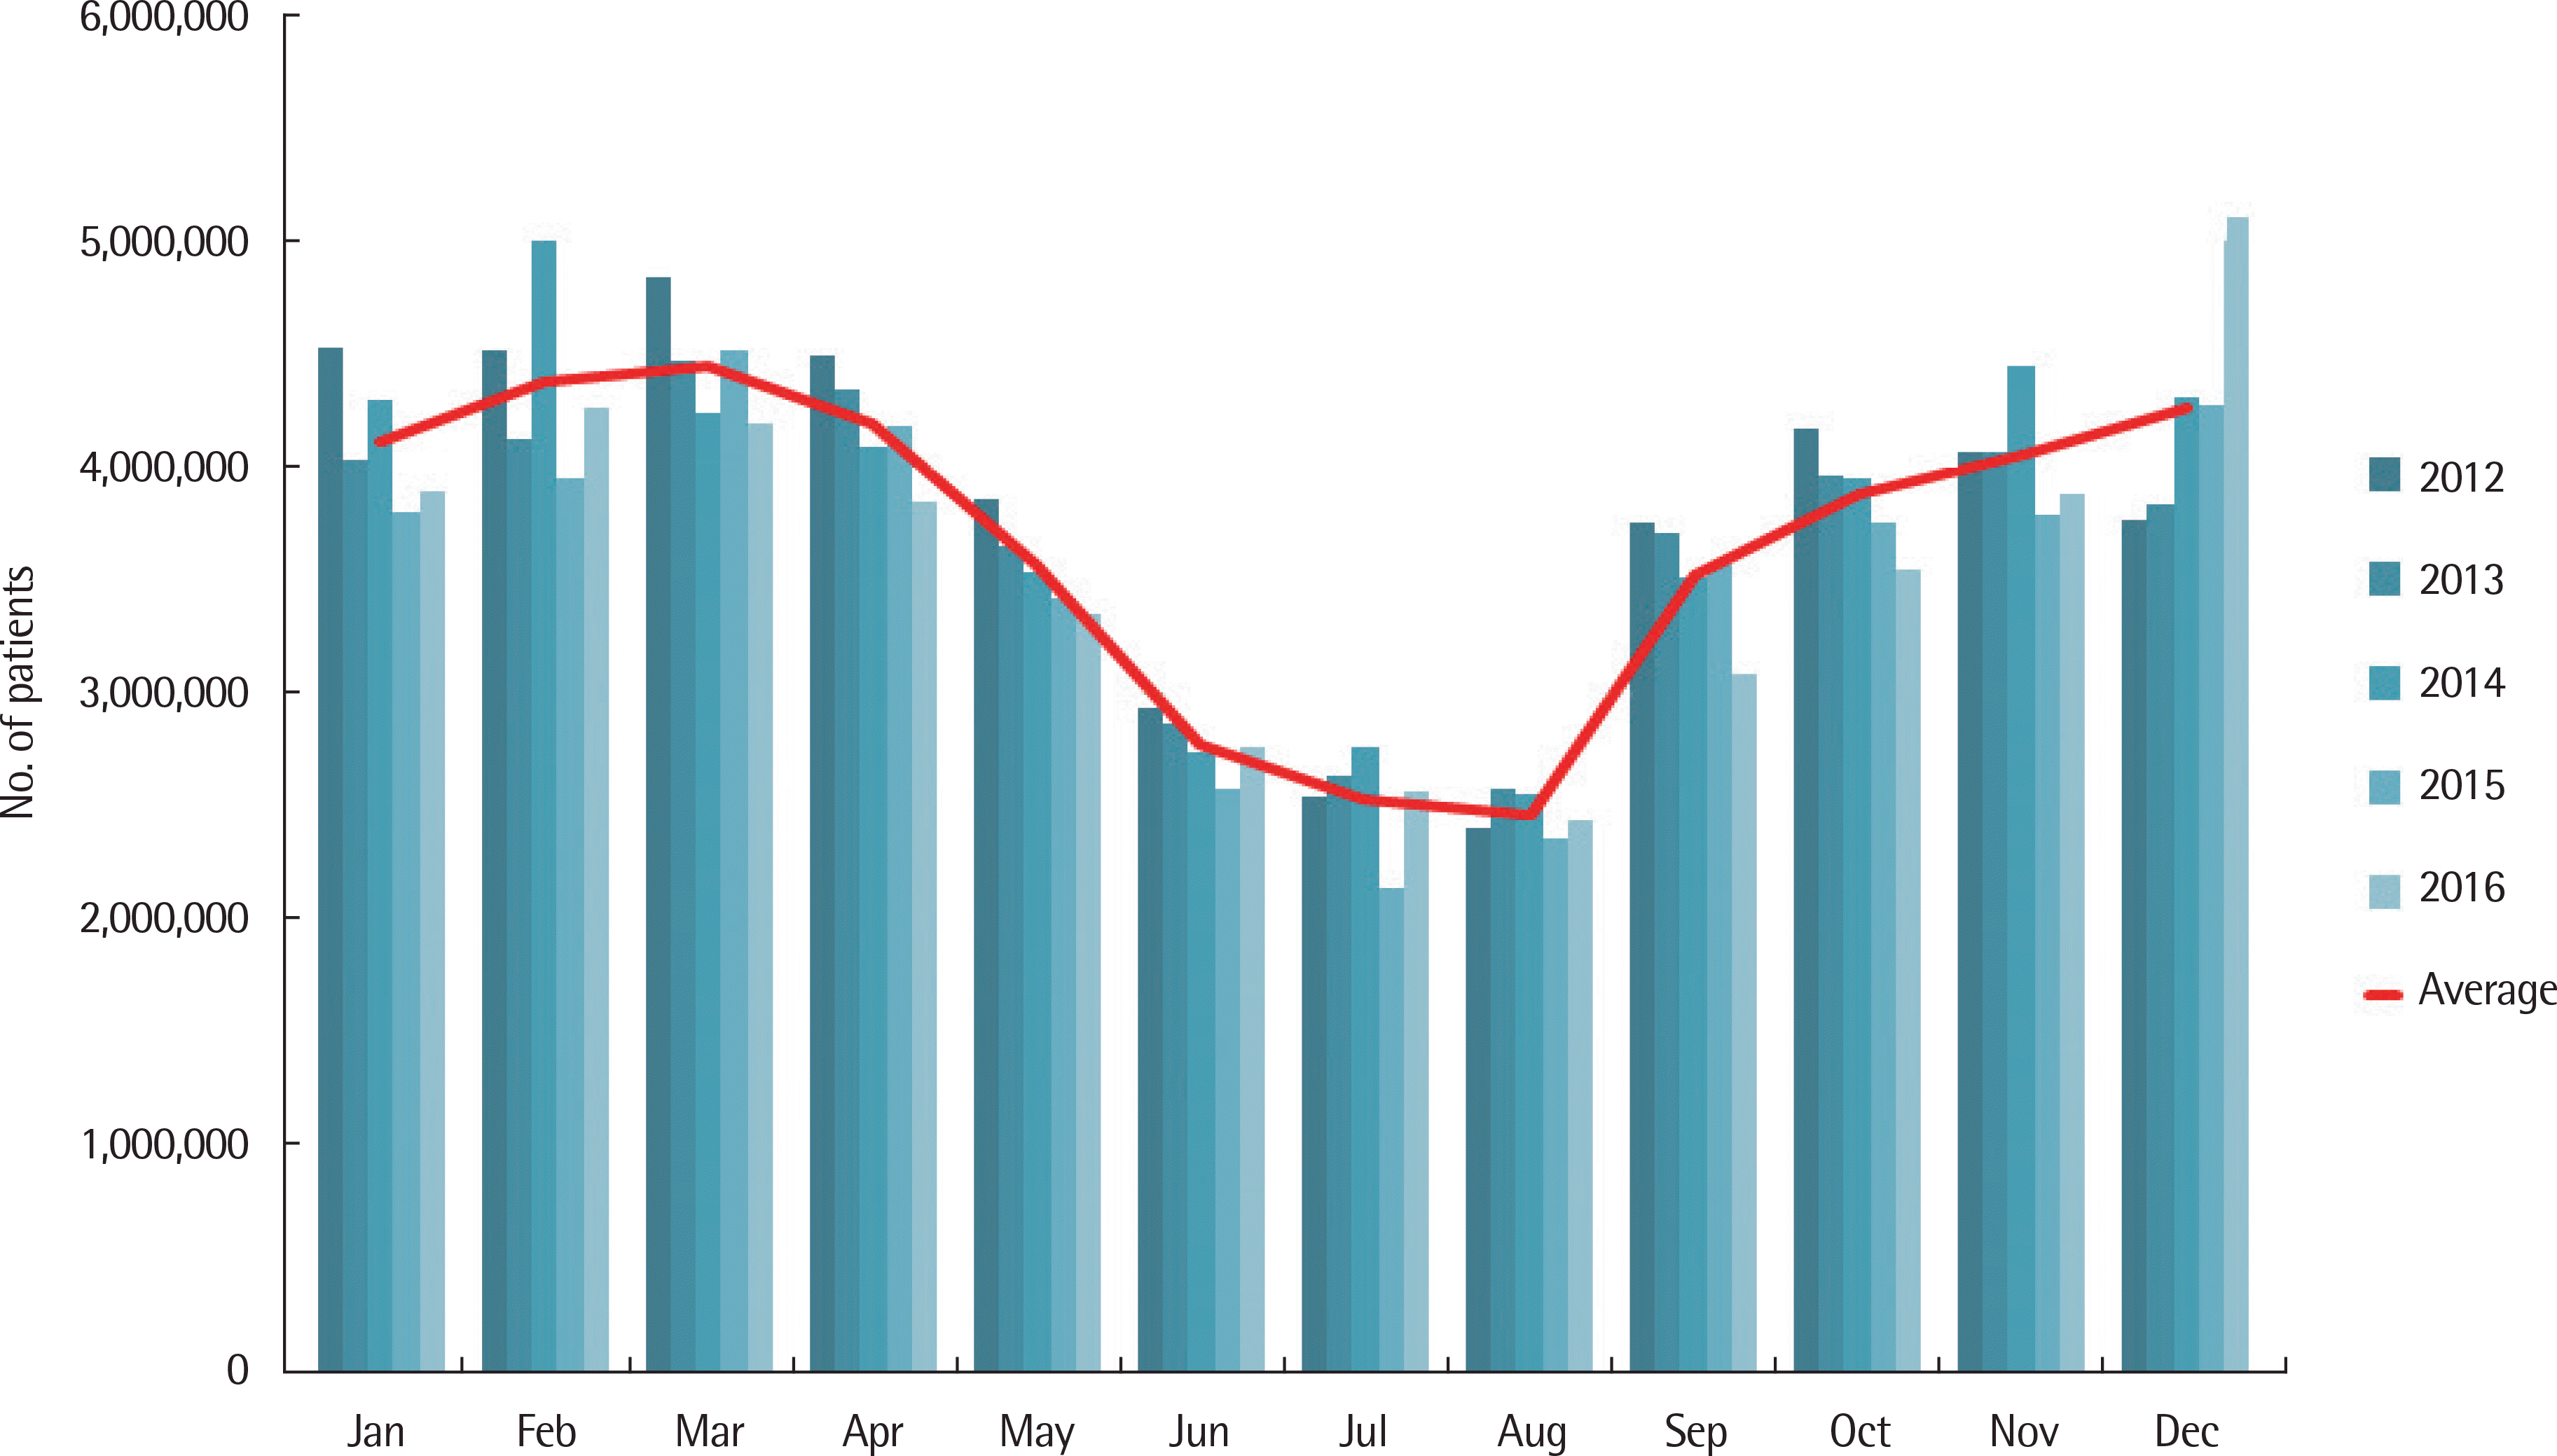 | Fig. 2.The number of patients of upper respiratory tract infection (URI) from National Health Insurance Service during 2012–2016. The number of URI patients also shows a biphasic pattern, which increases the rate in spring and winter and the lowest in summer. Compared to allergic rhinitis, the largest number of patients is in March. |
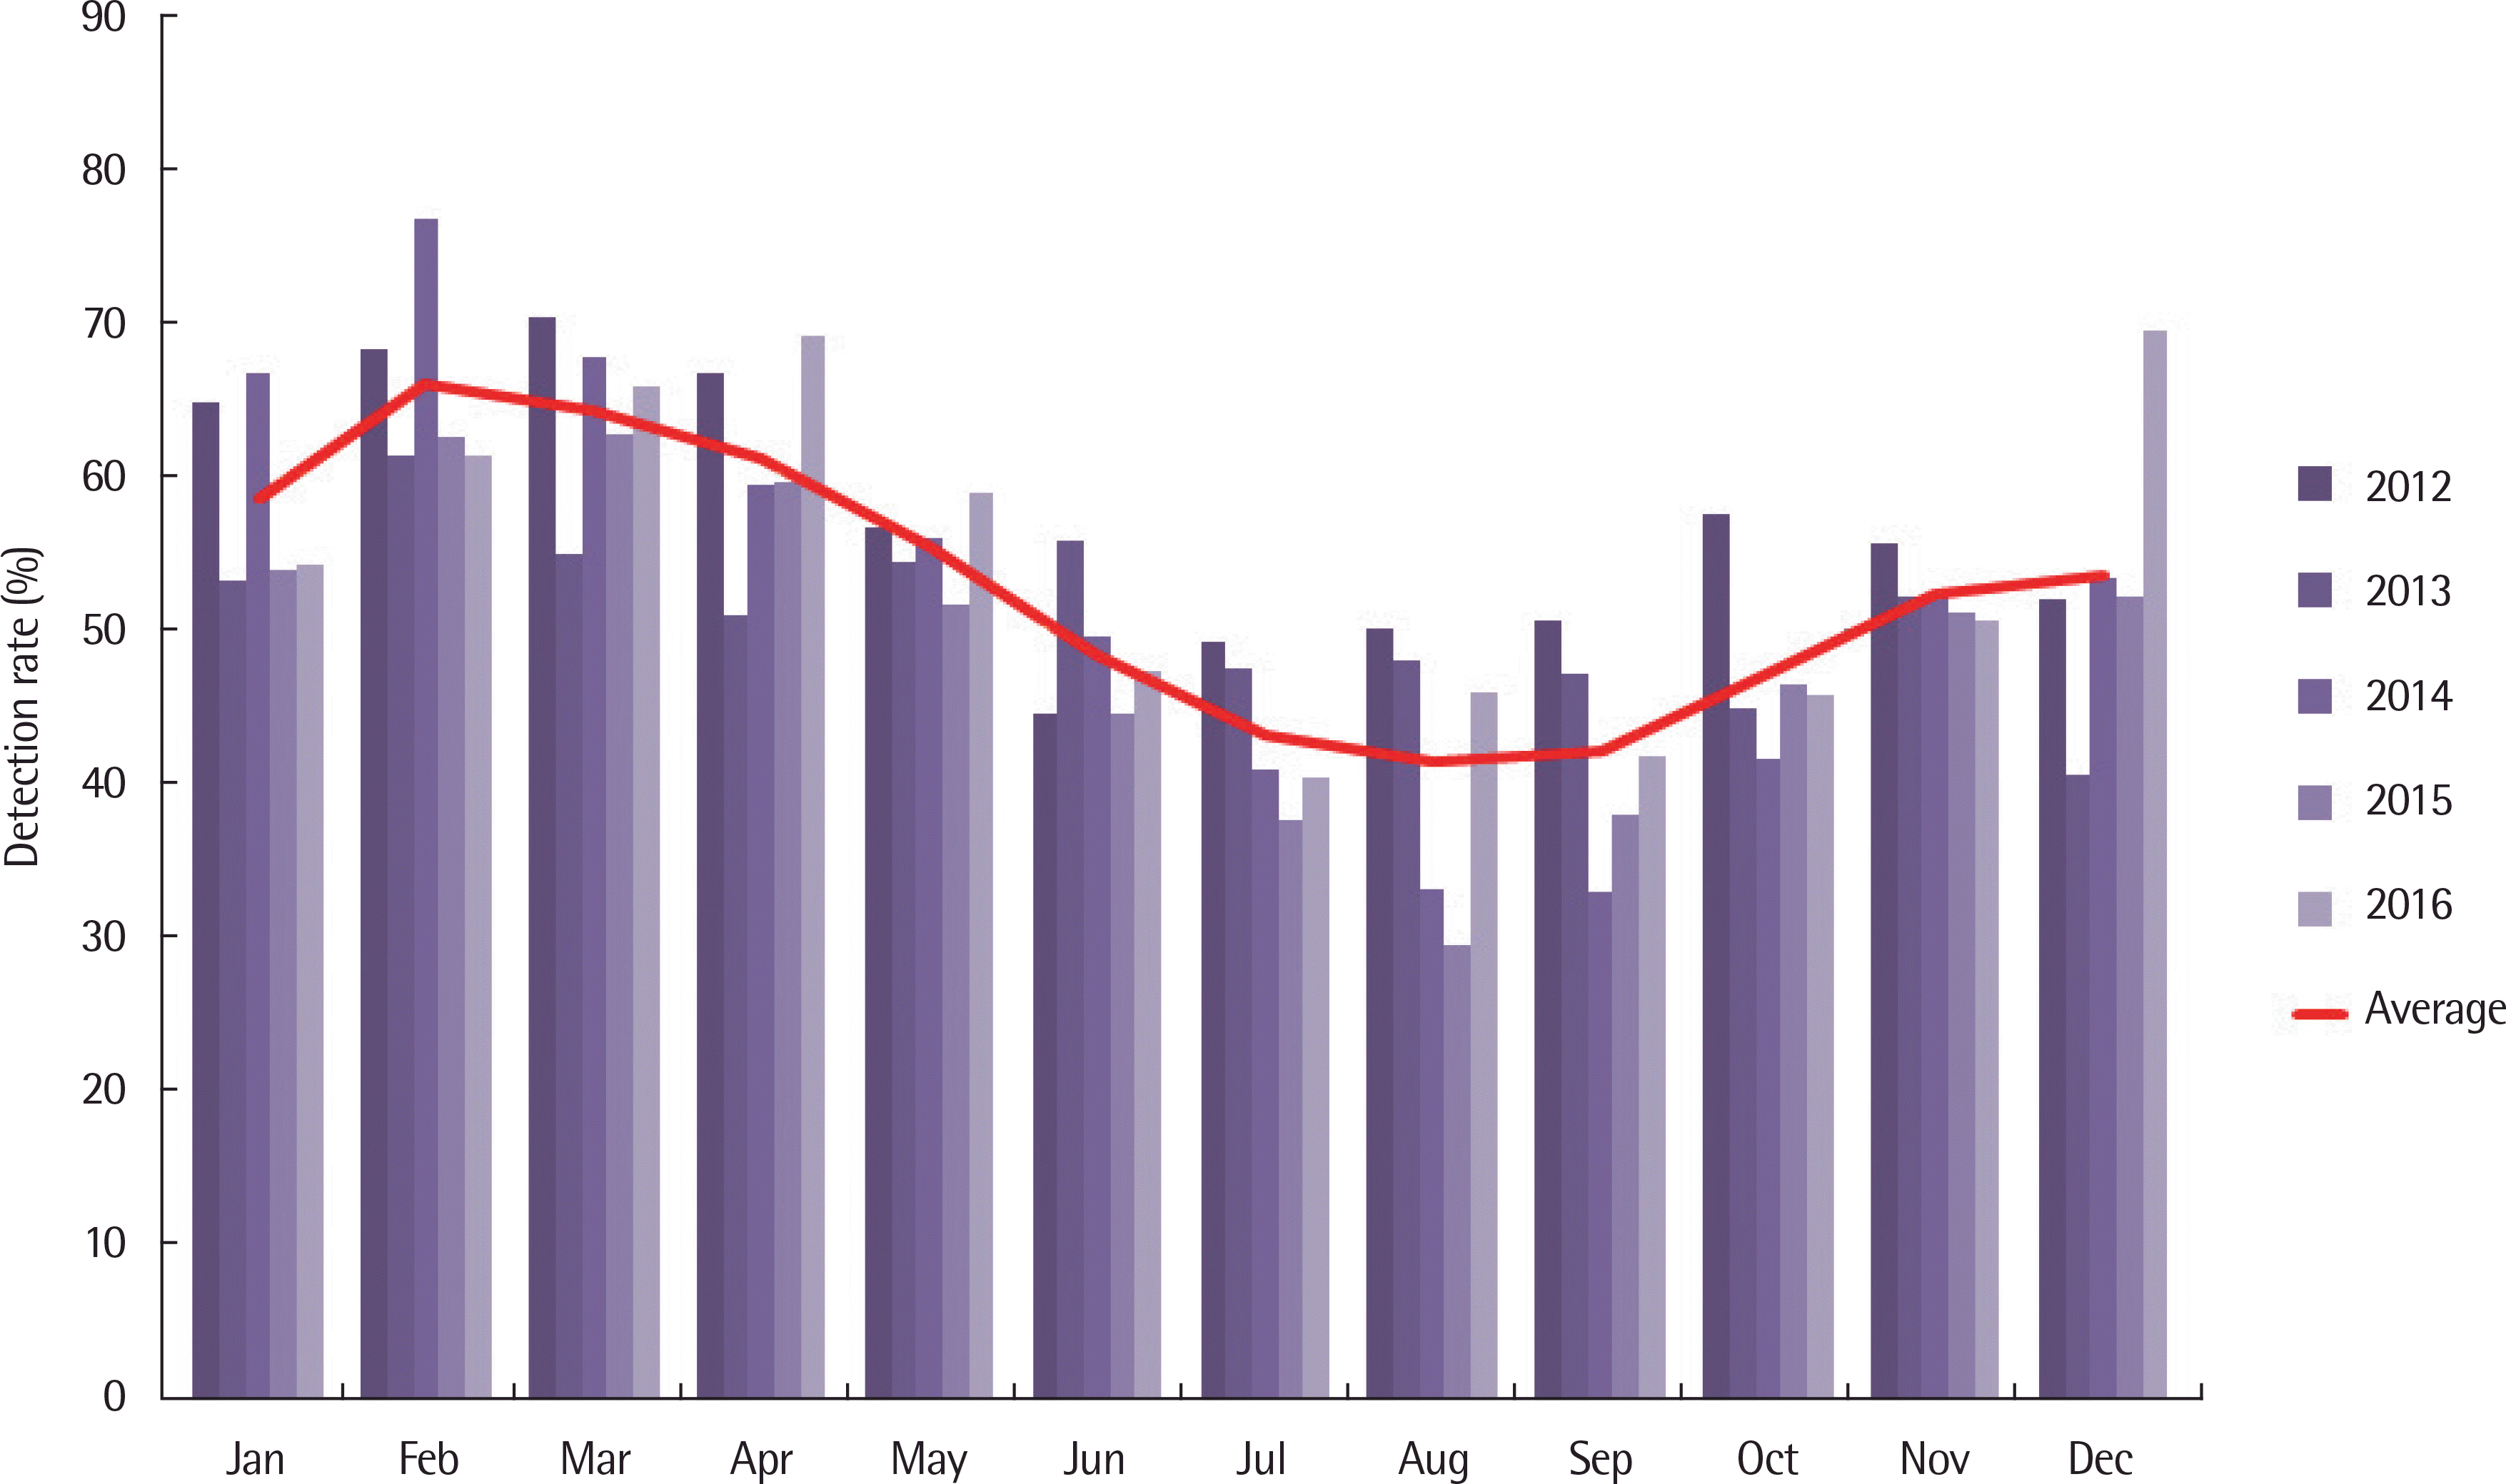
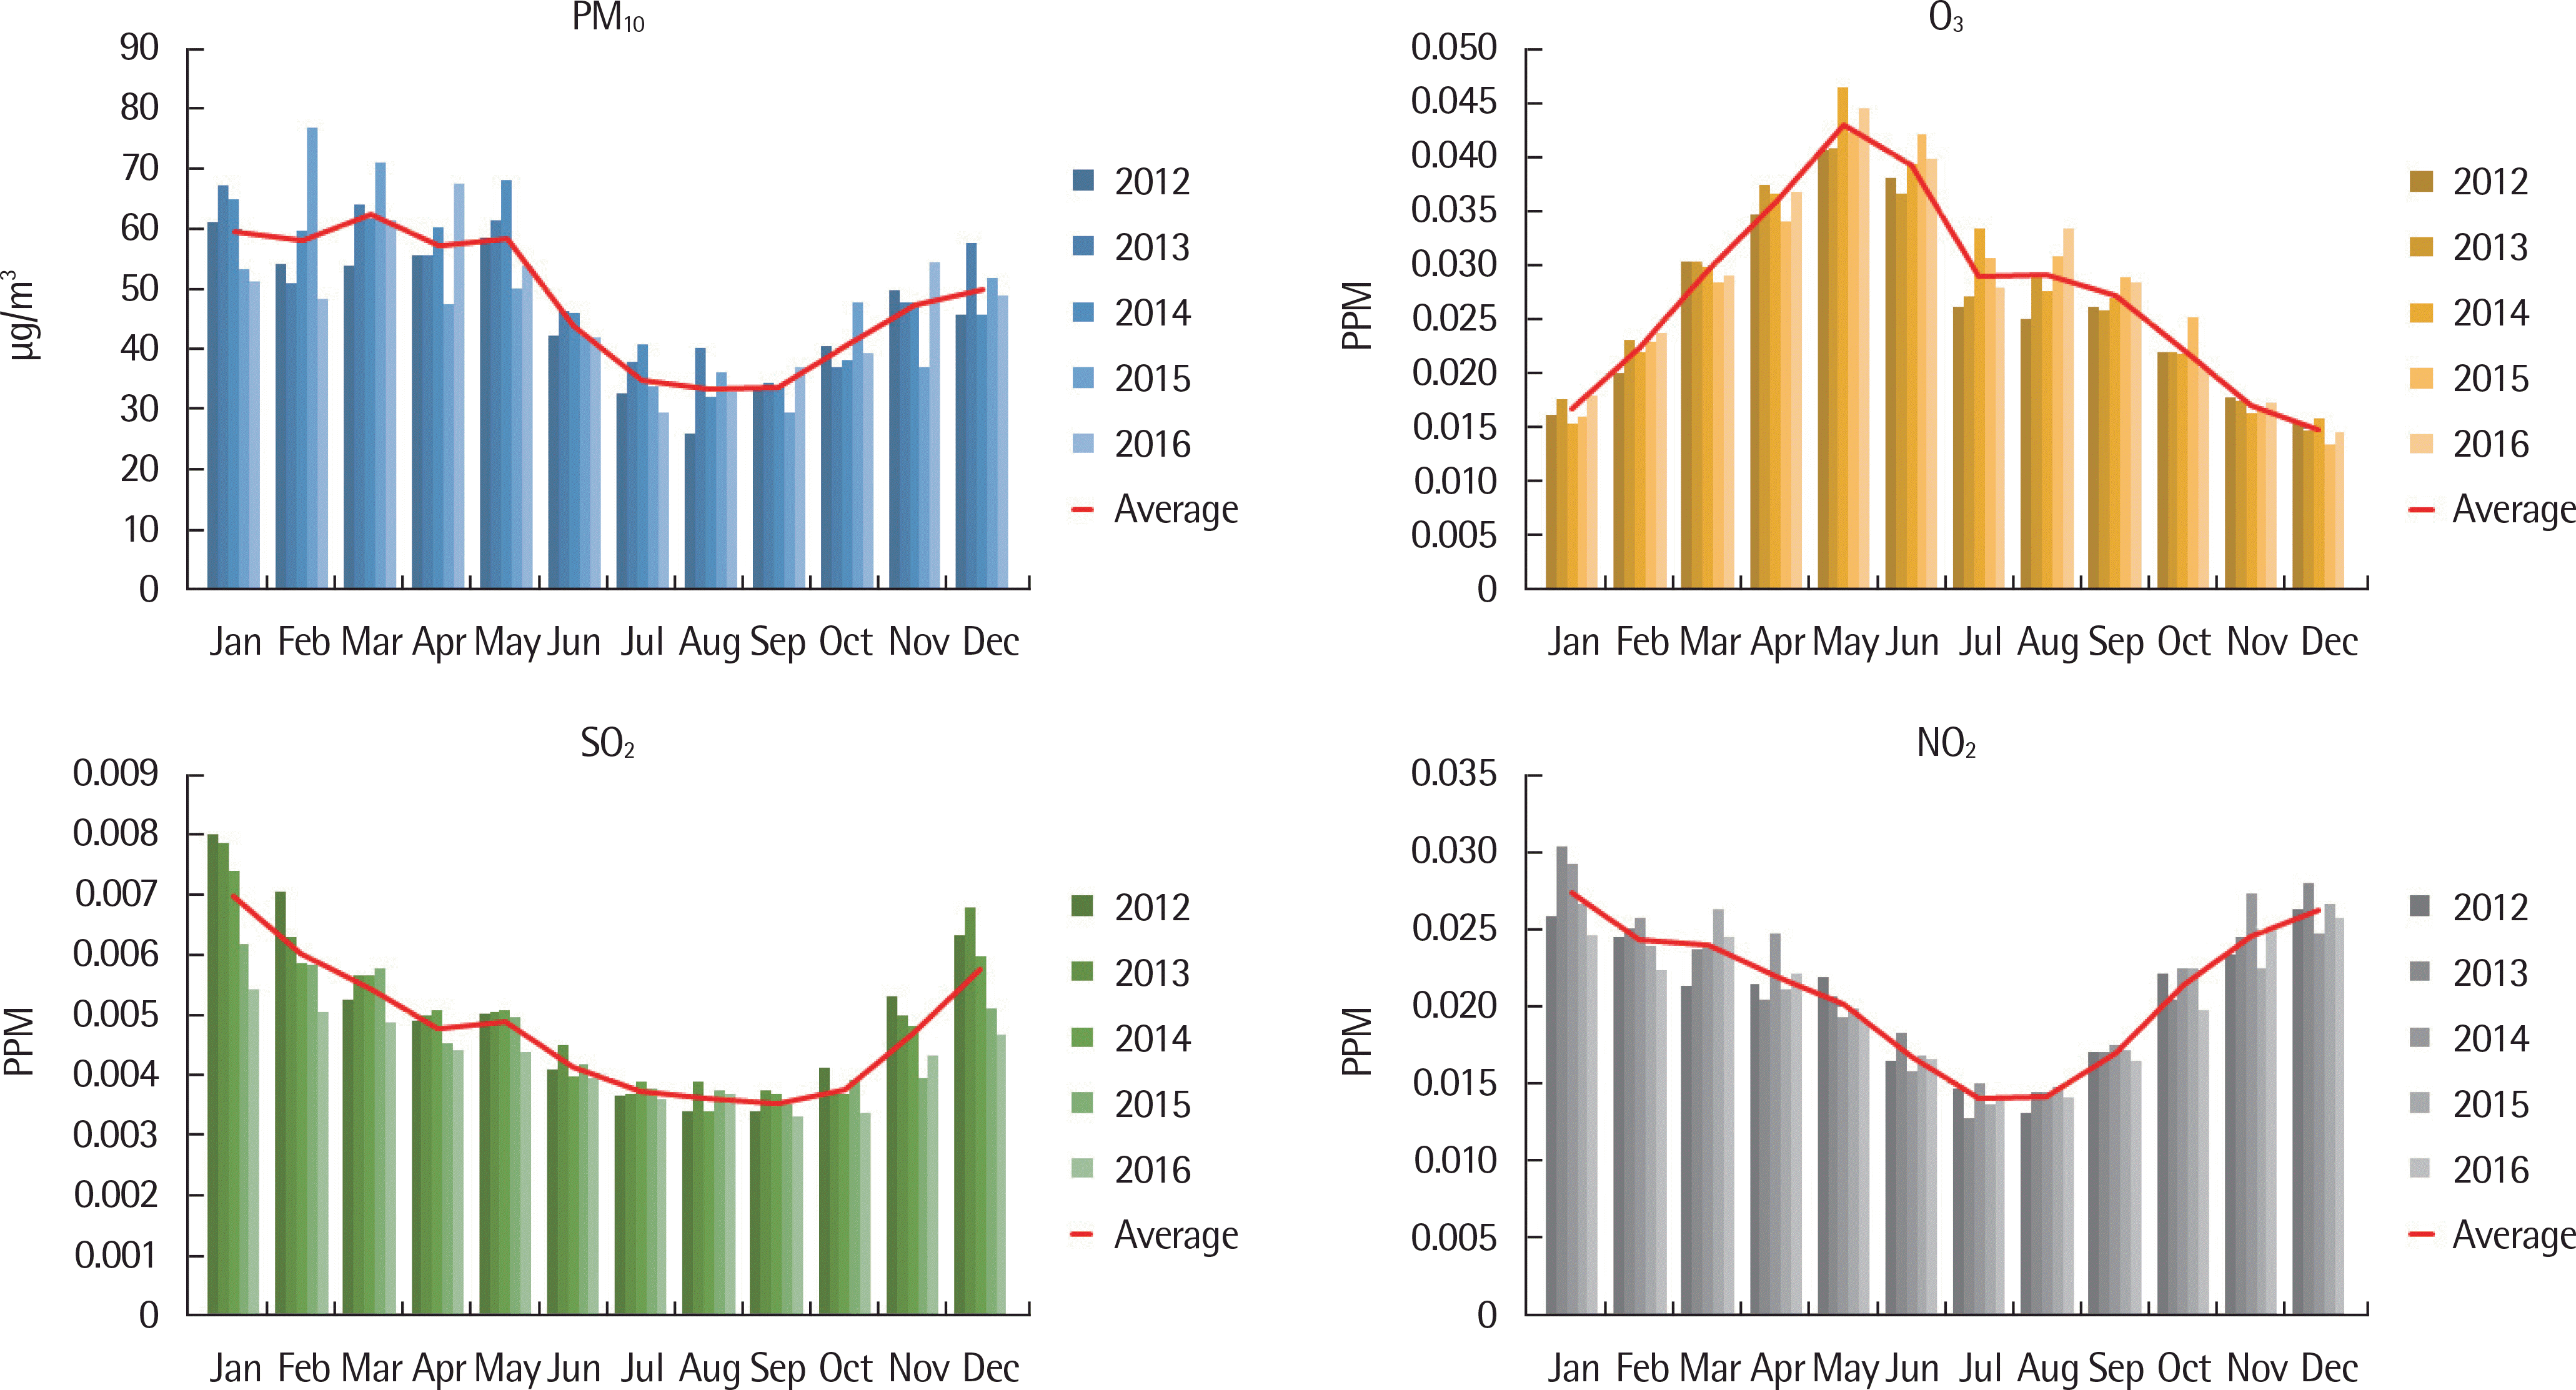 | Fig. 3.The monthly air pollutants concentration during 2012–2016. The peak monthly concentration of air pollutants was different from allergic rhinitis (AR) and was not correlated with AR. |


 PDF
PDF ePub
ePub Citation
 Print
Print


 XML Download