Journal List > Yonsei Med J > v.60(12) > 1137948

Noh, Jeong, Kim, Ko, Nah, and Shin: The Multi-Institutional Health Screening Records Database of South Korea: Description and Evaluation of Its Characteristics

Abstract

This study sought to describe and to evaluate the characteristics of the Health Screening Records Database (HSRD) of the Korea Association of Health Promotion as a data source for epidemiologic studies. The HSRD was compared to a National Health Insurance Service-Health Screening Cohort (NHIS-HEALS) database for 2015. Common variables between the databases were selected, and sex-based analyses were conducted. The HSRD showed statistical concordance when NHIS-HEALS estimates fell within the HSRD estimate's 95% confidence interval. The HSRD and NHIS-HEALS included 946461 and 111690 participants in health screening programs, respectively. Compared to the NHIS-HEALS, the HSRD had more female (55.2% vs. 42.6%) but fewer older adult participants (34.4% vs. 51.2%). Virtually all variables had clinical concordance, with some having statistical concordance as well, among both general and life-transition program participants. The HSRD comprised more clinical information over a wider age range in contrast to the NHIS-HEALS, while showing clinical concordance. Providing more comprehensive clinical data, the HSRD may serve as an alternative resource for epidemiologic studies.

The Health Screening Records Database (HSRD) of the Korea Association of Health Promotion (KAHP) is South Korea's largest multi-institutional health screening records database. The KAHP, established in 1964, comprises 16 medical institutions in South Korea that professionally offer health screening programs. The KAHP accommodates both national health screening programs (general and life-transition) and other patient-oriented and personalized screening programs. The screening results from these 16 medical centers are gathered in the HSRD.1
As health screening records contain information often deemed to be valuable and not available in claims databases, such as laboratory test data, disease history, lifestyle factors, or more clinically detailed information, they possess great value for extensive use in real-world epidemiological studies.2 For example, in a previous study using HSRD data to investigate the prevalence, awareness, treatment, and control rates of dyslipidemia among adults, low-density lipoprotein cholesterol levels and questionnaires were used to determine the diagnosis and awareness of dyslipidemia, respectively.3 However, despite the numerous studies that have used data from the HSRD, its characteristics have yet to be described and examined.45 Therefore, we conducted a descriptive study of the HSRD comparing it to Korea's nationwide National Health Insurance Service-Health Screening Cohort (NHIS-HEALS) database in order to describe and to evaluate its characteristics for use as a reliable real-world data source for future epidemiological studies.
This descriptive study used health screening records from the HSRD and the NHIS-HEALS database for 2015 (Supplementary Table 1, only online). The Health Promotion Research Institute and IT Development & Support Office of the KAHP integrated and standardized all health screening records and established the HSRD for research purposes. The HSRD contains records for participants in either general or life-transition health screening programs. This database comprises anonymized patient codes with data on sex, age, laboratory test results, personal and family disease history, lifestyle risk factors, and cognitive and mood function.1
The NHIS-HEALS is a 10% sample cohort randomly extracted from 5150000 nationwide health screening program participants. It is large in scale, stable, and based on qualified health screening participants 40–79 years of age as of 2002 and 2003.6 As we used data only from 2015, the minimum follow-up period was 13 years; thus, the age distribution was 53–79 years. As the NHIS is the universal single-payer national healthcare system of South Korea, coverage is provided to the entire population. The NHIS-HEALS contains similar variables as those in the HSRD, such as anonymized patient codes with data on sex, age, laboratory results, disease history, lifestyle risk factors, and cognitive and mood function.
In South Korea, two national health screening programs are available: general and life-transition programs. The NHIS-HEALS covers only individuals who have participated in either of these two programs, whereas the HSRD encompasses all individuals who participated in other programs in addition to the two national programs.
For concordance evaluation, the NHIS-HEALS was considered the gold standard, as it is a 10% sample cohort randomly extracted from 5150000 nationwide health screening program participants, thus providing national representativeness. Common variables present in both databases were selected, including sex, age, laboratory results, disease history, lifestyle risk factors, and cognitive and mood function (Supplementary Table 2, only online). Frequencies and proportions or means and standard deviations (SDs) were calculated for categorical or continuous variables, wherever appropriate. For the HSRD, 95% confidence intervals (CIs) for each variable's proportion or mean was calculated as follows, depending on whether the variable was categorical or continuous, respectively (X=sample mean, s=sample SD, n=number of samples):
Proportion±1.96×Proportion×1Proportionnymj-60-1216-e001.jpg
X±1.96×snymj-60-1216-e002.jpg
Concordance was classified as clinical or statistical; the latter was defined when a certain variable's estimate from the NHIS-HEALS fell within the HSRD estimate's 95% CI. Variables without statistical concordance were thoroughly reviewed by a group of physicians from various specialties based on clinical reference values to determine their clinical concordance. All statistical analyses were performed using Microsoft Excel (Microsoft, Washington DC, WA, USA) and SAS version 9.4 (SAS Institute Inc., Cary, NC, USA). The study protocol was approved by the Institutional Review Board of Sungkyunkwan University (SKKU 2018-04-006), and the need for obtaining informed consent from the study population was waived by the board.
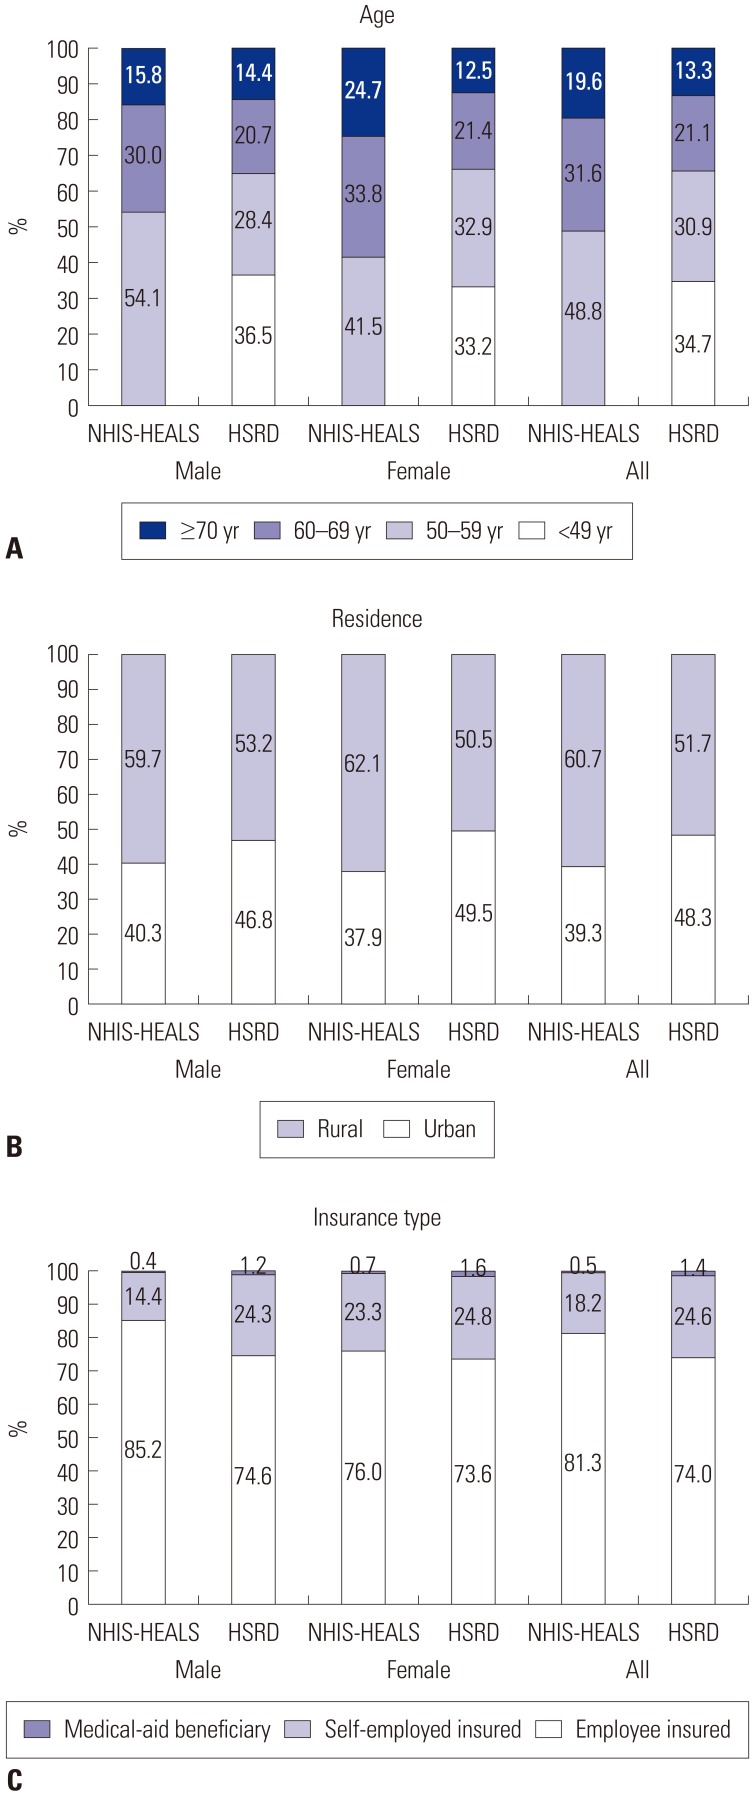
In total, the HSRD and NHIS-HEALS included 946461 and 111690 individuals who participated in health screening programs in 2015, respectively. Compared to the NHIS-HEALS, the HSRD had more female (55.2% vs. 42.6%), but fewer older adults (34.4% vs. 51.2%). Unlike the NHIS-HEALS, which included only participants ≥53 years of age, the HSRD included participants ≤49 years of age. As for region of residence, the HSRD included more male (46.8% vs. 40.3%) and female (49.5% vs. 37.9%) participants residing in urban areas. For insurance type, the HSRD had fewer employee-insured participants in both sexes (male: 74.6% vs. 85.2%; female: 73.6% vs. 76.0%) (Fig. 1).
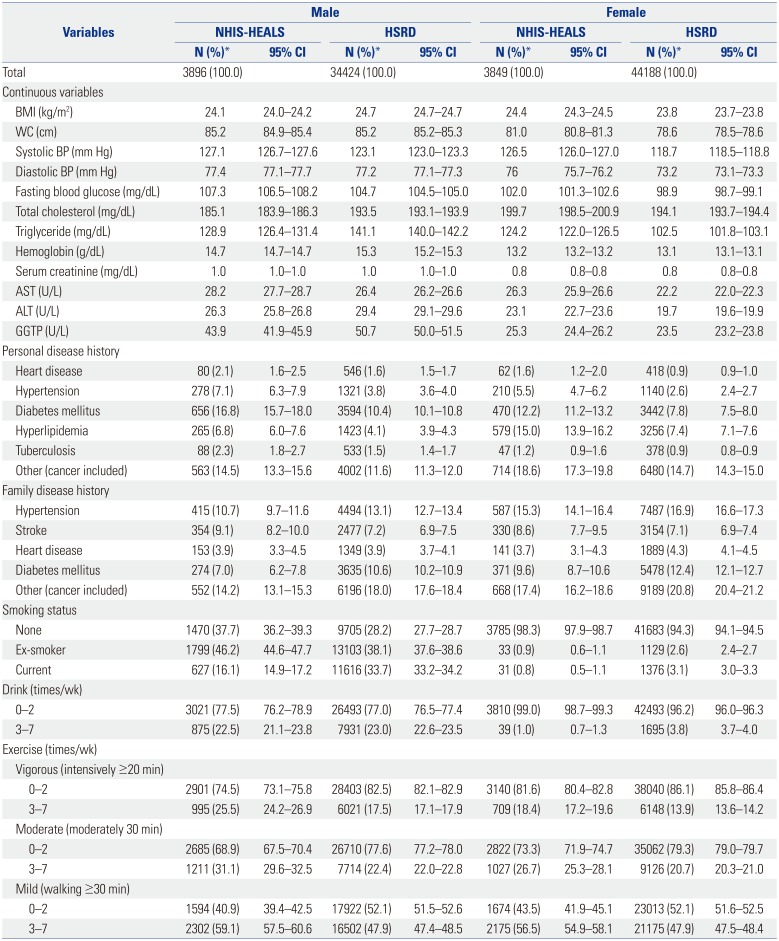
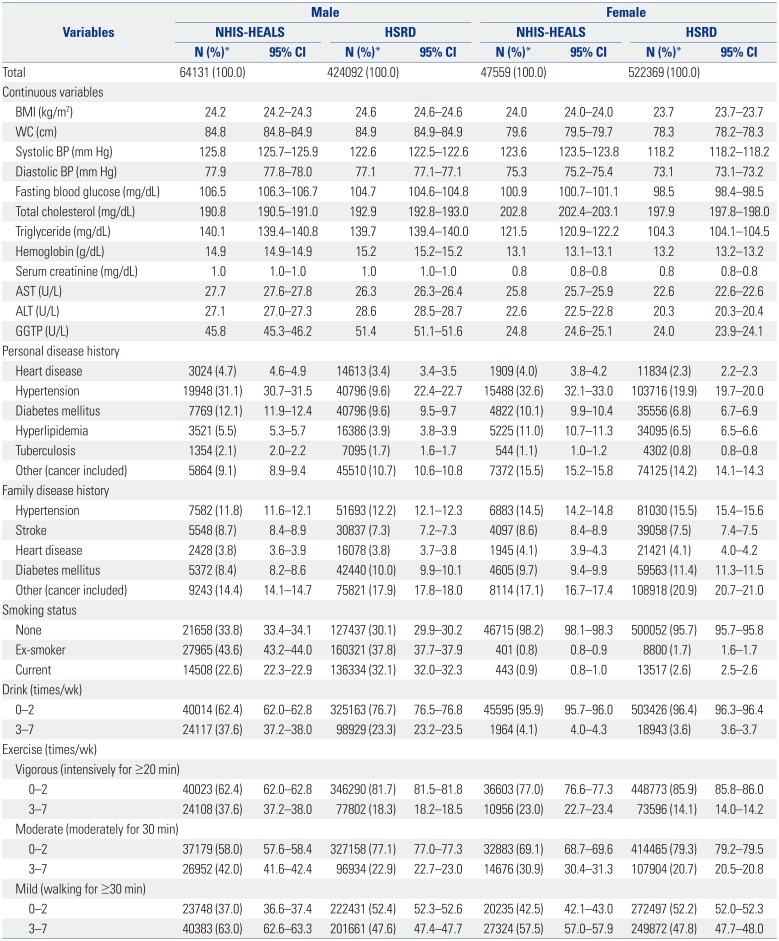
Comparison of general health screening program participants showed clinical concordance for all continuous variables, except for γ-glutamyl transferase in males and systolic blood pressure (BP) and total cholesterol in females. In both databases, personal disease history of hypertension showed the highest proportion, whereas for family disease history, it was others (including cancer). Moreover, the HSRD had a higher proportion of current smokers, but a lower proportion of participants who drank or exercised at all intensities, than the NHIS-HEALS (Table 1). Similar results were found for the life-transition health screening program participants, where diastolic BP and fasting blood glucose in females did not show clinical concordance, in addition to systolic BP and total cholesterol as mentioned above. Compared to the NHIS-HEALS, the HSRD showed lower proportions of participants for all categories of personal disease history and those who exercised often (3–7 times/week) (Table 2).
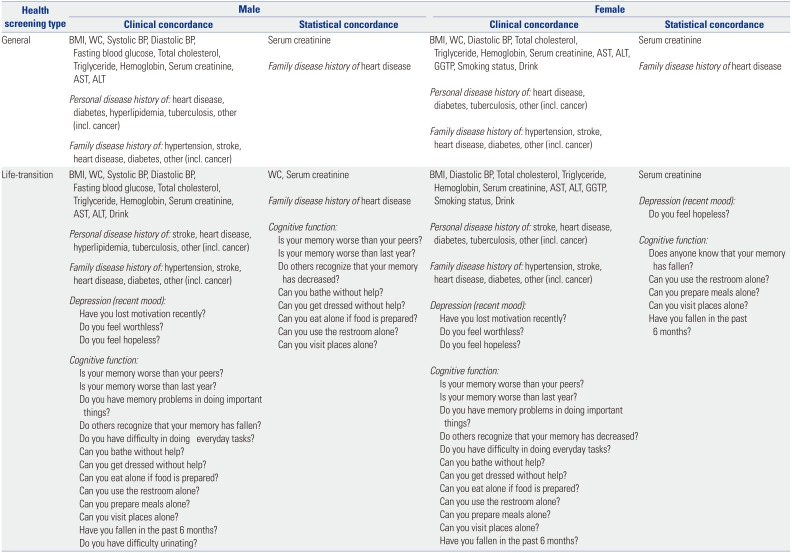
Nearly all variables had clinical concordance: serum creatinine and family disease history of heart disease also had statistical concordance among participants in the general program. Analogous results were observed among participants in the life-transition program, with more variables, such as cognitive function, showing statistical concordance (Table 3).
Compared to the NHIS-HEALS, the HSRD showed high clinical concordance for both general and life-transition program participants, with some even having statistical concordance, suggesting that the HSRD may serve as an appropriate data source for use in epidemiologic studies. The sociodemographic characteristics of the health screening program participants differed between the HSRD and NHIS-HEALS, in which the HSRD had more females (55.2% vs. 42.6%), but fewer older adult participants (≥60 years; 34.4% vs. 51.2%). The HSRD contains participants of all ages, including those aged <53 years, whereas the NHIS-HEALS contains only those aged ≥53 years. Moreover, the HSRD had more participants residing in urban areas (48.3% vs. 39.3%), but fewer employee-insured participants (74.0% vs. 81.3%). As for disease history, the HSRD had fewer participants with personal disease history, but had more participants for most categories of family disease history.
With the HSRD and NHIS-HEALS having different characteristics, the suitability of each database may depend on the type of epidemiologic study to be conducted. In studying diseases with a high prevalence, such as diabetes mellitus or hypertension, both databases may be appropriate as it would be relatively easy to acquire enough number of study subjects for ample power. However, when studying more specific diseases or conditions that are less prevalent in the general population, the preferred database may differ. For example, the HSRD would be the better choice for studies of rare disease in pediatric patients or in an age group under 40 years, as the HSRD contains a wider age range than the NHIS-HEALS. On the other hand, the NHIS-HEALS would be preferred when studying rare diseases in an older age group, because it represents the entire national population. Moreover, with the HSRD containing more clinical information than the NHIS-HEALS, which, in turn, may assist in determining the severity of disease, the HSRD would be preferred when studying severe diseases. However, there may be limitations when conducting longitudinal studies using the HSRD. Follow-up loss may occur in the HSRD should a patient transfer to another medical center that does not belong to one of the 16 medical centers of the KAHP. In the HSRD, as follow-up loss is most likely to occur when patients either change or quit their jobs, change their region of residence, or emigrate to another country, the frequency of follow-up loss is expected to be smaller when compared with general prospective cohorts or registries, but more prevalent than that with the NHIS-HEALS.
The wide range of clinical and lifestyle data from health screening records provide tremendous added value. Some studies have utilized these to more specifically define disease conditions; for example, hemoglobin A1c and fasting blood glucose levels were used to define diabetes mellitus, in addition to diagnosis codes.7 Other studies have used this information to identify associations between outcomes. One study reported that albuminuria may be a biomarker for hypertension and diabetes mellitus;8 another study reported serum uric acid to be positively associated with pulmonary function.9 Moreover, lifestyle factors have been shown to be associated with gastroesophageal reflux disease, and one study linked health screening and claims data to predict hospitalization due to pneumonia.1011 Thus, the use of health screening records either alone or linked with claims data may increase the value of epidemiological studies.
The strengths of our study are that this is the first study to describe and evaluate characteristics of the HSRD. Our exploration of its sociodemographic and clinical characteristics revealed high clinical concordance for the HSRD with the nationwide NHIS-HEALS. Second, the HSRD is unrestricted with regards to participant age and health screening programs; therefore, it contains all program participants and, thus, a broader spectrum of participants. Third, the well-validated NHIS-HEALS was used for comparison, ensuring the validity of the HSRD.6 Notwithstanding, the present study has some limitations. First, the medical centers of the KAHP are located in metropolitan cities, whereas the NHIS-HEALS receive health screening records from 22785 medical institutions across the Korean nation. Thus, individuals residing in rural areas may not be well represented in the HSRD (Supplementary Fig. 1, only online). Second, not all variables were found to have concordance; however, for these variables, various approaches to obtain concordance exist. For instance, post-stratification or benchmark weighting may be applied. Alternatively, iterative proportional fitting or inverse probability of treatment weighting with propensity scores may enhance concordance.121314 Third, the non-random inclusion of subjects within the HSRD may have caused selection bias arising from the differences in health care utilization and health status when compared to that of the national average. This discrepancy may be due to the characteristics of the KAHP, as it is a multi-institutional organization of hospitals specializing in health screening programs. Finally, as we compared only data for the year 2015, not all potential health screening participants were included as not all health screening programs are performed annually.
The HSRD had more clinical information for a wider age range than the NHIS-HEALS, while simultaneously showing an exceptional level of clinical concordance. The HSRD alone or by linkage with other data may serve as an alternative data source for future epidemiologic studies by providing more comprehensive information and, in turn, evidence for health promotion or disease prevention policies.
ACKNOWLEDGEMENTS

Access to the National Health Insurance Service-Health Screening Cohort (NHIS-HEALS) database was provided by the National Health Insurance Service of South Korea. We thank Yeon-Hee Baek and Ha-Lim Jeon at the School of Pharmacy, Sungkyunkwan University for their contribution in drafting the initial research protocol.
This study was supported by the Korea Association of Health Promotion.

Notes

The authors have no potential conflicts of interest to disclose.

AUTHOR CONTRIBUTIONS:

  • Conceptualization: Yunha Noh, Han Eol Jeong, Eun-Hee Nah, and Ju-Young Shin.

  • Data curation: Hanju Ko.

  • Formal analysis: Hye-Jun Kim.

  • Funding acquisition: Yunha Noh, Han Eol Jeong, and Ju-Young Shin.

  • Investigation: Yunha Noh and Han Eol Jeong.

  • Methodology: Yunha Noh and Han Eol Jeong.

  • Project administration: Eun-Hee Nah and Ju-Young Shin.

  • Resources: Hanju Ko and Eun-Hee Nah.

  • Software: Hanju Ko and Hye-Jun Kim.

  • Supervision: Ju-Young Shin and Eun-Hee Nah.

  • Validation: Yunha Noh, Han Eol Jeong, Eun-Hee Nah, and Ju-Young Shin.

  • Visualization: Yunha Noh, Han Eol Jeong, and Hye-Jun Kim.

  • Writing—original draft: Yunha Noh and Han Eol Jeong.

  • Writing—review & editing: Yunha Noh, Han Eol Jeong, Eun-Hee Nah, and Ju-Young Shin.

References

1. Korea Association of Health Promotion. Introduction of the Korea Association of Health Promotion [Internet]. Seoul: Korea Association of Health Promotion;c2011. accessed on 2019 July 5. Available at: http://english.kahp.or.kr/cms/doc.php?tkind=90&lkind=66.
2. March S. Individual data linkage of survey data with claims data in Germany-an overview based on a cohort study. Int J Environ Res Public Health. 2017; 14:E1543. PMID: 29232834.
crossref
3. Jang S, Lee J. Prevalence and management of dyslipidemia, hypertension, diabetes among adults in Gangwon-do, Korea: the 2013-2014 KNHSP. Journal of the Korea Academia-Industrial Cooperation Society. 2017; 18:625–636.
crossref
4. Lee YJ, Kang JW, Kim JY, Na EH, Kim YR, Ko KS, et al. Clustering of health risk behaviors for chronic diseases in Korean adults. Korean J Health Educ Promot. 2017; 34:21–31.
crossref
5. Nah EH, Cho S, Kim S, Cho HI, Chai JY. Comparison of traditional and reverse syphilis screening algorithms in medical health checkups. Ann Lab Med. 2017; 37:511–515. PMID: 28840989.
crossref
6. Seong SC, Kim YY, Park SK, Khang YH, Kim HC, Park JH, et al. Cohort profile: the National Health Insurance Service-National Health Screening Cohort (NHIS-HEALS) in Korea. BMJ Open. 2017; 7:e016640.
crossref
7. Ooba N, Setoguchi S, Sato T, Kubota K. Lipid-lowering drugs and risk of new-onset diabetes: a cohort study using Japanese healthcare data linked to clinical data for health screening. BMJ Open. 2017; 7:e015935.
crossref
8. Gu D, Xu P, Yuan Y, Fu H. Albuminuria is suggested as a potential health screening biomarker for senior citizens and general population with hypertension or diabetes in China. Clin Lab. 2016; 62:2267–2269. PMID: 28164667.
crossref
9. Song JU, Hwang J, Ahn JK. Serum uric acid is positively associated with pulmonary function in Korean health screening examinees. Mod Rheumatol. 2017; 27:1057–1065. PMID: 28693364.
crossref
10. Matsuki N, Fujita T, Watanabe N, Sugahara A, Watanabe A, Ishida T, et al. Lifestyle factors associated with gastroesophageal reflux disease in the Japanese population. J Gastroenterol. 2013; 48:340–349. PMID: 22911169.
crossref
11. Uematsu H, Yamashita K, Kunisawa S, Otsubo T, Imanaka Y. Prediction of pneumonia hospitalization in adults using health check-up data. PLoS One. 2017; 12:e0180159. PMID: 28662167.
crossref
12. Austin PC, Stuart EA. Moving towards best practice when using inverse probability of treatment weighting (IPTW) using the propensity score to estimate causal treatment effects in observational studies. Stat Med. 2015; 34:3661–3679. PMID: 26238958.
crossref
13. El-Khorazaty JA, Koch G, Preisser J. The iterative proportional fitting algorithm for adjusted agreement in a non-inferiority diagnostic clinical trial. Pharm Stat. 2014; 13:173–178. PMID: 24715653.
crossref
14. Neumann A, Billionnet C. Covariate adjustment of cumulative incidence functions for competing risks data using inverse probability of treatment weighting. Comput Methods Programs Biomed. 2016; 129:63–70. PMID: 27084321.
crossref

SUPPLEMENTARY MATERIALS

Supplementary Table 1

Comparisons between the HSRD and NHIS-HEALS Databases
ymj-60-1216-s001.pdf

Supplementary Table 2

Variables Included for Analysis if Present in both the HSRD and NHIS-HEALS Databases and Excluded Otherwise
ymj-60-1216-s002.pdf

Supplementary Fig. 1

Distribution and location of the 16 medical institutions of the Korea Association of Health Promotion. Location of the 16 medical institutions: Seoul (3), Busan (1), Incheon (1), Daegu (1), Ulsan (1), Gyeonggi-do (1), Gangwon-do (1), Chungcheongbuk-do+Sejong (1), Daejeon+Chungcheongnam-do (1), Jeollabuk-do (1), Gwangju+Jeollanam-do (1), Gyeongsangbuk-do (1), Gyeongsangnam-do (1) and Jeju (1).
ymj-60-1216-s003.pdf
Fig. 1

(A–C) Comparisons of the socio-demographic and regional characteristics of health screening participants in the Health Screening Records Database (HSRD) and National Health Insurance Service-Health Screening Cohort (NHIS-HEALS) databases for 2015.

ymj-60-1216-g001
Table 1

Comparisons of the Clinical Characteristics of Individuals Who Participated in General Health Screening Programs and Are Included in the HSRD and NHIS-HEALS

ymj-60-1216-i001
Variables Male Female
NHIS-HEALS HSRD NHIS-HEALS HSRD
N (%)* 95% CI N (%)* 95% CI N (%)* 95% CI N (%)* 95% CI
Total 64131 (100.0) 424092 (100.0) 47559 (100.0) 522369 (100.0)
Continuous variables
 BMI (kg/m2) 24.2 24.2–24.3 24.6 24.6–24.6 24.0 24.0–24.0 23.7 23.7–23.7
 WC (cm) 84.8 84.8–84.9 84.9 84.9–84.9 79.6 79.5–79.7 78.3 78.2–78.3
 Systolic BP (mm Hg) 125.8 125.7–125.9 122.6 122.5–122.6 123.6 123.5–123.8 118.2 118.2–118.2
 Diastolic BP (mm Hg) 77.9 77.8–78.0 77.1 77.1–77.1 75.3 75.2–75.4 73.1 73.1–73.2
 Fasting blood glucose (mg/dL) 106.5 106.3–106.7 104.7 104.6–104.8 100.9 100.7–101.1 98.5 98.4–98.5
 Total cholesterol (mg/dL) 190.8 190.5–191.0 192.9 192.8–193.0 202.8 202.4–203.1 197.9 197.8–198.0
 Triglyceride (mg/dL) 140.1 139.4–140.8 139.7 139.4–140.0 121.5 120.9–122.2 104.3 104.1–104.5
 Hemoglobin (g/dL) 14.9 14.9–14.9 15.2 15.2–15.2 13.1 13.1–13.1 13.2 13.2–13.2
 Serum creatinine (mg/dL) 1.0 1.0–1.0 1.0 1.0–1.0 0.8 0.8–0.8 0.8 0.8–0.8
 AST (U/L) 27.7 27.6–27.8 26.3 26.3–26.4 25.8 25.7–25.9 22.6 22.6–22.6
 ALT (U/L) 27.1 27.0–27.3 28.6 28.5–28.7 22.6 22.5–22.8 20.3 20.3–20.4
 GGTP (U/L) 45.8 45.3–46.2 51.4 51.1–51.6 24.8 24.6–25.1 24 23.9–24.1
Personal disease history
 Heart disease 3024 (4.7) 4.6–4.9 14613 (3.4) 3.4–3.5 1909 (4.0) 3.8–4.2 11834 (2.3) 2.2–2.3
 Hypertension 19948 (31.1) 30.7–31.5 40796 (9.6) 22.4–22.7 15488 (32.6) 32.1–33.0 103716 (19.9) 19.7–20.0
 Diabetes mellitus 7769 (12.1) 11.9–12.4 40796 (9.6) 9.5–9.7 4822 (10.1) 9.9–10.4 35556 (6.8) 6.7–6.9
 Hyperlipidemia 3521 (5.5) 5.3–5.7 16386 (3.9) 3.8–3.9 5225 (11.0) 10.7–11.3 34095 (6.5) 6.5–6.6
 Tuberculosis 1354 (2.1) 2.0–2.2 7095 (1.7) 1.6–1.7 544 (1.1) 1.0–1.2 4302 (0.8) 0.8–0.8
 Other (cancer included) 5864 (9.1) 8.9–9.4 45510 (10.7) 10.6–10.8 7372 (15.5) 15.2–15.8 74125 (14.2) 14.1–14.3
Family disease history
 Hypertension 7582 (11.8) 11.6–12.1 51693 (12.2) 12.1–12.3 6883 (14.5) 14.2–14.8 81030 (15.5) 15.4–15.6
 Stroke 5548 (8.7) 8.4–8.9 30837 (7.3) 7.2–7.3 4097 (8.6) 8.4–8.9 39058 (7.5) 7.4–7.5
 Heart disease 2428 (3.8) 3.6–3.9 16078 (3.8) 3.7–3.8 1945 (4.1) 3.9–4.3 21421 (4.1) 4.0–4.2
 Diabetes mellitus 5372 (8.4) 8.2–8.6 42440 (10.0) 9.9–10.1 4605 (9.7) 9.4–9.9 59563 (11.4) 11.3–11.5
 Other (cancer included) 9243 (14.4) 14.1–14.7 75821 (17.9) 17.8–18.0 8114 (17.1) 16.7–17.4 108918 (20.9) 20.7–21.0
Smoking status
 None 21658 (33.8) 33.4–34.1 127437 (30.1) 29.9–30.2 46715 (98.2) 98.1–98.3 500052 (95.7) 95.7–95.8
 Ex-smoker 27965 (43.6) 43.2–44.0 160321 (37.8) 37.7–37.9 401 (0.8) 0.8–0.9 8800 (1.7) 1.6–1.7
 Current 14508 (22.6) 22.3–22.9 136334 (32.1) 32.0–32.3 443 (0.9) 0.8–1.0 13517 (2.6) 2.5–2.6
Drink (times/wk)
 0–2 40014 (62.4) 62.0–62.8 325163 (76.7) 76.5–76.8 45595 (95.9) 95.7–96.0 503426 (96.4) 96.3–96.4
 3–7 24117 (37.6) 37.2–38.0 98929 (23.3) 23.2–23.5 1964 (4.1) 4.0–4.3 18943 (3.6) 3.6–3.7
Exercise (times/wk)
 Vigorous (intensively for ≥20 min) 40023 (62.4) 62.0–62.8 346290 (81.7) 81.5–81.8 36603 (77.0) 76.6–77.3 448773 (85.9) 85.8–86.0
  0–2 24108 (37.6) 37.2–38.0 77802 (18.3) 18.2–18.5 10956 (23.0) 22.7–23.4 73596 (14.1) 14.0–14.2
  3–7
 Moderate (moderately for 30 min)
  0–2 37179 (58.0) 57.6–58.4 327158 (77.1) 77.0–77.3 32883 (69.1) 68.7–69.6 414465 (79.3) 79.2–79.5
  3–7 26952 (42.0) 41.6–42.4 96934 (22.9) 22.7–23.0 14676 (30.9) 30.4–31.3 107904 (20.7) 20.5–20.8
 Mild (walking for ≥30 min)
  0–2 23748 (37.0) 36.6–37.4 222431 (52.4) 52.3–52.6 20235 (42.5) 42.1–43.0 272497 (52.2) 52.0–52.3
  3–7 40383 (63.0) 62.6–63.3 201661 (47.6) 47.4–47.7 27324 (57.5) 57.0–57.9 249872 (47.8) 47.7–48.0

HSRD, Health Screening Records Database; NHIS-HEALS, National Health Insurance Service-Health Screening Cohort; CI, confidence interval; BMI, body mass index; WC, waist circumference; BP, blood pressure; AST, aspartate aminotransferase; ALT, alanine aminotransaminase; GGTP, γ-glutamyl transferase; min, minutes.

*In the case of continuous variables, it is represented by a mean value.

Table 2

Comparisons of the Clinical Characteristics of Individuals Who Participated in Life-Transition Health Screening Programs and Are Included in the HSRD and NHIS-HEALS

ymj-60-1216-i002
Variables Male Female
NHIS-HEALS HSRD NHIS-HEALS HSRD
N (%)* 95% CI N (%)* 95% CI N (%)* 95% CI N (%)* 95% CI
Total 3896 (100.0) 34424 (100.0) 3849 (100.0) 44188 (100.0)
Continuous variables
 BMI (kg/m2) 24.1 24.0–24.2 24.7 24.7–24.7 24.4 24.3–24.5 23.8 23.7–23.8
 WC (cm) 85.2 84.9–85.4 85.2 85.2–85.3 81 80.8–81.3 78.6 78.5–78.6
 Systolic BP (mm Hg) 127.1 126.7–127.6 123.1 123.0–123.3 126.5 126.0–127.0 118.7 118.5–118.8
 Diastolic BP (mm Hg) 77.4 77.1–77.7 77.2 77.1–77.3 76 75.7–76.2 73.2 73.1–73.3
 Fasting blood glucose (mg/dL) 107.3 106.5–108.2 104.7 104.5–105.0 102.0 101.3–102.6 98.9 98.7–99.1
 Total cholesterol (mg/dL) 185.1 183.9–186.3 193.5 193.1–193.9 199.7 198.5–200.9 194.1 193.7–194.4
 Triglyceride (mg/dL) 128.9 126.4–131.4 141.1 140.0–142.2 124.2 122.0–126.5 102.5 101.8–103.1
 Hemoglobin (g/dL) 14.7 14.7–14.7 15.3 15.2–15.3 13.2 13.2–13.2 13.1 13.1–13.1
 Serum creatinine (mg/dL) 1.0 1.0–1.0 1.0 1.0–1.0 0.8 0.8–0.8 0.8 0.8–0.8
 AST (U/L) 28.2 27.7–28.7 26.4 26.2–26.6 26.3 25.9–26.6 22.2 22.0–22.3
 ALT (U/L) 26.3 25.8–26.8 29.4 29.1–29.6 23.1 22.7–23.6 19.7 19.6–19.9
 GGTP (U/L) 43.9 41.9–45.9 50.7 50.0–51.5 25.3 24.4–26.2 23.5 23.2–23.8
Personal disease history
 Heart disease 80 (2.1) 1.6–2.5 546 (1.6) 1.5–1.7 62 (1.6) 1.2–2.0 418 (0.9) 0.9–1.0
 Hypertension 278 (7.1) 6.3–7.9 1321 (3.8) 3.6–4.0 210 (5.5) 4.7–6.2 1140 (2.6) 2.4–2.7
 Diabetes mellitus 656 (16.8) 15.7–18.0 3594 (10.4) 10.1–10.8 470 (12.2) 11.2–13.2 3442 (7.8) 7.5–8.0
 Hyperlipidemia 265 (6.8) 6.0–7.6 1423 (4.1) 3.9–4.3 579 (15.0) 13.9–16.2 3256 (7.4) 7.1–7.6
 Tuberculosis 88 (2.3) 1.8–2.7 533 (1.5) 1.4–1.7 47 (1.2) 0.9–1.6 378 (0.9) 0.8–0.9
 Other (cancer included) 563 (14.5) 13.3–15.6 4002 (11.6) 11.3–12.0 714 (18.6) 17.3–19.8 6480 (14.7) 14.3–15.0
Family disease history
 Hypertension 415 (10.7) 9.7–11.6 4494 (13.1) 12.7–13.4 587 (15.3) 14.1–16.4 7487 (16.9) 16.6–17.3
 Stroke 354 (9.1) 8.2–10.0 2477 (7.2) 6.9–7.5 330 (8.6) 7.7–9.5 3154 (7.1) 6.9–7.4
 Heart disease 153 (3.9) 3.3–4.5 1349 (3.9) 3.7–4.1 141 (3.7) 3.1–4.3 1889 (4.3) 4.1–4.5
 Diabetes mellitus 274 (7.0) 6.2–7.8 3635 (10.6) 10.2–10.9 371 (9.6) 8.7–10.6 5478 (12.4) 12.1–12.7
 Other (cancer included) 552 (14.2) 13.1–15.3 6196 (18.0) 17.6–18.4 668 (17.4) 16.2–18.6 9189 (20.8) 20.4–21.2
Smoking status
 None 1470 (37.7) 36.2–39.3 9705 (28.2) 27.7–28.7 3785 (98.3) 97.9–98.7 41683 (94.3) 94.1–94.5
 Ex-smoker 1799 (46.2) 44.6–47.7 13103 (38.1) 37.6–38.6 33 (0.9) 0.6–1.1 1129 (2.6) 2.4–2.7
 Current 627 (16.1) 14.9–17.2 11616 (33.7) 33.2–34.2 31 (0.8) 0.5–1.1 1376 (3.1) 3.0–3.3
Drink (times/wk)
 0–2 3021 (77.5) 76.2–78.9 26493 (77.0) 76.5–77.4 3810 (99.0) 98.7–99.3 42493 (96.2) 96.0–96.3
 3–7 875 (22.5) 21.1–23.8 7931 (23.0) 22.6–23.5 39 (1.0) 0.7–1.3 1695 (3.8) 3.7–4.0
Exercise (times/wk)
 Vigorous (intensively ≥20 min)
  0–2 2901 (74.5) 73.1–75.8 28403 (82.5) 82.1–82.9 3140 (81.6) 80.4–82.8 38040 (86.1) 85.8–86.4
  3–7 995 (25.5) 24.2–26.9 6021 (17.5) 17.1–17.9 709 (18.4) 17.2–19.6 6148 (13.9) 13.6–14.2
 Moderate (moderately 30 min)
  0–2 2685 (68.9) 67.5–70.4 26710 (77.6) 77.2–78.0 2822 (73.3) 71.9–74.7 35062 (79.3) 79.0–79.7
  3–7 1211 (31.1) 29.6–32.5 7714 (22.4) 22.0–22.8 1027 (26.7) 25.3–28.1 9126 (20.7) 20.3–21.0
 Mild (walking ≥30 min)
  0–2 1594 (40.9) 39.4–42.5 17922 (52.1) 51.5–52.6 1674 (43.5) 41.9–45.1 23013 (52.1) 51.6–52.5
  3–7 2302 (59.1) 57.5–60.6 16502 (47.9) 47.4–48.5 2175 (56.5) 54.9–58.1 21175 (47.9) 47.5–48.4

HSRD, Health Screening Records Database; NHIS-HEALS, National Health Insurance Service-Health Screening Cohort; CI, confidence interval; BMI, body mass index; WC, waist circumference; BP, blood pressure; AST, aspartate aminotransferase; ALT, alanine aminotransaminase; GGTP, γ-glutamyl transferase; min, minutes.

*In the case of continuous variables, it is represented by a mean value.

Table 3

Variables with Clinical or Statistical Concordance between the HSRD and NHIS-HEALS

ymj-60-1216-i003
Health screening type Male Female
Clinical concordance Statistical concordance Clinical concordance Statistical concordance
General BMI, WC, Systolic BP, Diastolic BP, Fasting blood glucose, Total cholesterol, Triglyceride, Hemoglobin, Serum creatinine, AST, ALT Serum creatinine BMI, WC, Diastolic BP, Total cholesterol, Triglyceride, Hemoglobin, Serum creatinine, AST, ALT, GGTP, Smoking status, Drink Serum creatinine
Family disease history of heart disease Family disease history of heart disease
Personal disease history of: heart disease, diabetes, hyperlipidemia, tuberculosis, other (incl. cancer) Personal disease history of: heart disease, diabetes, tuberculosis, other (incl. cancer)
Family disease history of: hypertension, stroke, heart disease, diabetes, other (incl. cancer) Family disease history of: hypertension, stroke, heart disease, diabetes, other (incl. cancer)
Life-transition BMI, WC, Systolic BP, Diastolic BP, Fasting blood glucose, Total cholesterol, Triglyceride, Hemoglobin, Serum creatinine, AST, ALT, Drink WC, Serum creatinine BMI, Diastolic BP, Total cholesterol, Triglyceride, Hemoglobin, Serum creatinine, AST, ALT, GGTP, Smoking status, Drink Serum creatinine
Family disease history of heart disease Depression (recent mood): Do you feel hopeless?
Personal disease history of: stroke, heart disease, hyperlipidemia, tuberculosis, other (incl. cancer) Cognitive function: Personal disease history of: stroke, heart disease, diabetes, tuberculosis, other (incl. cancer) Cognitive function:
Family disease history of: hypertension, stroke, heart disease, diabetes, other (incl. cancer)  Is your memory worse than your peers? Family disease history of: hypertension, stroke, heart disease, diabetes, other (incl. cancer)  Does anyone know that your memory has fallen?
Depression (recent mood):  Is your memory worse than last year? Depression (recent mood):  Can you use the restroom alone?
 Have you lost motivation recently?  Do others recognize that your memory has decreased?  Have you lost motivation recently?  Can you prepare meals alone?
 Do you feel worthless?  Can you bathe without help?  Do you feel worthless?  Can you visit places alone?
 Do you feel hopeless?  Can you get dressed without help?  Do you feel hopeless?  Have you fallen in the past 6 months?
 Can you eat alone if food is prepared?
 Can you use the restroom alone?
 Can you visit places alone?
Cognitive function: Cognitive function:
 Is your memory worse than your peers?  Is your memory worse than your peers?
 Is your memory worse than last year?  Is your memory worse than last year?
 Do you have memory problems in doing important things?  Do you have memory problems in doing important things?
 Do others recognize that your memory has fallen?  Do others recognize that your memory has decreased?
 Do you have difficulty in doing everyday tasks?  Do you have difficulty in doing everyday tasks?
 Can you bathe without help?  Can you bathe without help?
 Can you get dressed without help?  Can you get dressed without help?
 Can you eat alone if food is prepared?  Can you eat alone if food is prepared?
 Can you use the restroom alone?  Can you use the restroom alone?
 Can you prepare meals alone?  Can you prepare meals alone?
 Can you visit places alone?  Can you visit places alone?
 Have you fallen in the past 6 months?  Have you fallen in the past 6 months?
 Do you have difficulty urinating?

HSRD, Health Screening Records Database; NHIS-HEALS, National Health Insurance Service-Health Screening Cohort; BMI, body mass index; WC, waist circumference; BP, blood pressure; AST, aspartate aminotransferase; ALT, alanine aminotransaminase; incl., including; GGTP, γ-glutamyl transferase.

TOOLS
Similar articles