Journal List > Yonsei Med J > v.60(12) > 1137903

Ahn, Jung, Song, Park, and Lee: Controlling Nutritional Status Score is Associated with All-Cause Mortality in Patients with Antineutrophil Cytoplasmic Antibody-Associated Vasculitis

Abstract

Purpose

The controlling nutritional status (CONUT) score was developed to detect undernutrition in patients. Here, we investigated whether the CONUT score estimated at diagnosis could help predict poor outcomes [all-cause mortality, relapse, and end-stage renal disease (ESRD)] of antineutrophil cytoplasmic antibody (ANCA)-associated vasculitis (AAV).

Materials and Methods

We retrospectively reviewed and collated data, including baseline characteristics, clinical manifestations (to calculate AAV-specific indices), and laboratory results, from 196 newly diagnosed AAV patients. Serum albumin, peripheral lymphocyte, and total cholesterol levels (at diagnosis) were used to calculate CONUT scores.

Results

In total, 111 patients had high CONUT scores (≥3), which showed higher frequency of myeloperoxidase-ANCA and ANCA positivity, and demonstrated higher AAV-specific indices. The optimal cut-offs of CONUT score (at diagnosis) for predicting all-cause mortality and ESRD were ≥3.5 and ≥2.5, respectively. Patients with CONUT scores higher than the cut-off at diagnosis exhibited lower cumulative and ESRD-free survival rates compared to those with lower scores than the cut-off. In multivariable analyses, diabetes mellitus [hazard ratio (HR): 4.394], five-factor score (HR: 3.051), and CONUT score ≥3.5 (HR: 4.307) at diagnosis were independent predictors of all-cause mortality, while only serum creatinine (HR: 1.714) was an independent predictor of ESRD occurrence.

Conclusion

CONUT score at diagnosis is associated with all-cause mortality in AAV patients.

INTRODUCTION

Antineutrophil cytoplasmic antibody (ANCA)-associated vasculitis (AAV) is defined as a group of vasculitides predominantly affecting small vessels including capillaries, venules, arterioles, and small arteries, according to the guidelines set by the 2012 Chapel Hill Consensus Conferences on Nomenclature of Vasculitis (2012 CHCC definitions).1 Unlike the 1994 CHCC definitions, the 2012 guidelines divided small vessel vasculitis (SVV) into two groups of AAV and immune complex SVV.2 Therefore, the 2012 CHCC definition was the first to officially categorise SVV based on the detection of ANCA.1 AAV consists of three subtypes: microscopic polyangiitis (MPA), granulomatosis with polyangiitis (GPA), and eosinophilic granulomatosis with polyangiitis (EGPA). The frequencies and clinical manifestations differ subtly across these three subtypes. Glomerulonephritis occurs very commonly in MPA, often in GPA, and occasionally in EGPA. Pulmonary capillaritis is commonly found in patients with MPA, but less so in those with GPA and EGPA. Moreover, GPA often induces development of granulomas in the upper and lower respiratory tracts, while EGPA is characterised by the occurrence of three allergic, clinical manifestations: asthma, peripheral eosinophilia, and development of eosinophil-rich granulomas of the respiratory tract.1
Generally, occurrence of all-cause mortality, relapse (or refractory illness in case of GPA), and end-stage renal disease (ESRD) are considered poor outcomes of AAV, with all-cause mortality reported to occur 2.7 times more frequently in affected patients, as compared to the general population.3 So far, several baseline predictors or those encountered at the time of diagnosis have been suggested, which can be used to prognosticate poor outcomes in AAV patients. Myeloperoxidase (MPO)-ANCA positivity at diagnosis was found to be associated with high all-cause mortality and low relapse frequency.4 Meanwhile, MPO-ANCA positivity, old age, and an estimated low glomerular filtration rate were proven to predict diminished renal function after 3 years with AAV.5 Furthermore, the clinical features and course of AAV may exhibit differences based on the ethnicity of the affected patients. A previous study reported that Japanese patients with GPA were older at disease onset and showed lower proteinase 3 (PR3)-ANCA positivity, milder renal dysfunction, and more frequent respiratory involvement than those diagnosed with AAV in the United Kingdom.6 Another study also reported that MPA phenotypes were different in Europe compared to those presenting in Japan. However, both cumulative survival and renal-sparing rates were not different between European and Japanese patients.7 We previously aimed to identify the clinical significance of certain independent baseline factors in predicting the poor outcomes of AAV, while considering these ethnic differences in disease presentation. All-cause mortality has been shown to be positively and inversely associated with the C-reactive protein (CRP)-to-serum albumin and the albumin-to-globulin ratios at diagnosis, respectively,89 while AAV-relapse has been found to be associated with the neutrophil-to-lymphocyte ratio, delta neutrophil index, and systemic immune-inflammation index at diagnosis.101112 Similarly, development of ESRD is known to be associated with systemic immune-inflammation and low levels of complement 3 at diagnosis.1213 While various baseline predictors of outcomes of AAV have been suggested, there is no absolute predictor or method of evaluation at the time of diagnosis to help prognosticate outcomes, which has significant clinical implications.
The controlling nutritional status (CONUT) score was developed for the assessment of nutritional status, in order to enable an early detection of undernutrition in hospitalized patients.14 A preoperative low CONUT score is known to indicate poor prognosis in patients with solid cancers.15 CONUT score was also reported to indicate inflammation and was shown to predict poor outcomes in patients with inflammatory systemic diseases, including heart failure and acute myocardial infarction.1617 It was demonstrated that several nutritional indices assessed at baseline could help predict the poor outcomes of AAV. Therefore, we theorized that the CONUT score (also a nutritional index) estimated at the time of diagnosis, could be utilized to prognosticate poor outcomes of AAV during follow-up. There have been no prior studies of CONUT score in this context. Thus, in this study, we investigated whether the CONUT score assessed during AAV diagnosis could help the treating clinician predict poor disease outcomes, such as all-cause mortality, relapse, and ESRD development, during subsequent follow-ups of affected patients.

MATERIALS AND METHODS

Patients

We retrospectively reviewed the medical records of 196 patients with AAV who had not received immunosuppressive therapy before disease diagnosis (immunosuppressive therapy-naïve). All included patients had been diagnosed with AAV for the first time at the Department of Internal Medicine, Yonsei University College of Medicine, Severance Hospital, from October 2000 to December 2018. Their well-documented medical records were utilized to collate and assess clinical data including disease manifestations, laboratory results, and AAV-specific indices, such as the Birmingham vasculitis activity score (BVAS) and the five-factor score (FFS), recorded at the time of diagnosis. As revised BVAS for GPA has a different system of weightage compared to the original BVAS scoring method, we evenly applied the latter system (even in patients with GPA) to unify the scoring system applied in this study.181920 The patients were all reclassified into AAV subtypes according to the 2007 European Medicines Agency algorithm for AAV, and on the basis of descriptions provided by the 2012 CHCC definitions. Furthermore, the included patients had no serious comorbidities that could mimic AAV at diagnosis, as identified in the 10th revised International Classification Diseases (ICD-10). This study was approved by the Institutional Review Board (IRB) of Severance Hospital (4-2017-0673), which also waived the requirement of obtaining written informed consent from the patients, as this was a retrospective study.

Clinical data and routine laboratory results at diagnosis

We collated demographic data, including age and sex of the patients, and reviewed the test results for the detection of ANCA that were recorded at the time of diagnosis. Comorbidities, including diabetes mellitus (DM) and hypertension (HTN), were also assessed at baseline. Clinical data at diagnosis were collected based on the items in BVAS and FFS. Laboratory results at diagnosis, including blood (white blood cell, lymphocyte, and platelet) counts, as well as levels of haemoglobin, prothrombin time, fasting glucose, blood urea nitrogen (BUN), creatinine, total serum protein, serum albumin, aspartate aminotransferase (AST), alanine aminotransferase (ALT), total cholesterol, erythrocyte sedimentation rate (ESR), and CRP, were also obtained.

Calculation of CONUT score at diagnosis

The CONUT score is calculated based on serum albumin, lymphocyte count (in peripheral blood), and total cholesterol levels. Values for each variable are divided into four ranges, and sequential points are assigned to each range: 1) for albumin (mg/L): ≥3.5=0, 3.0–3.4=2; 2.5–2.9=4, and <2.5=6; 2) for lymphocyte count (/mm3): ≥1600=0, 1200–1599=1, 800–1199=2, and <800=3; 3) for serum total cholesterol (mmol/L): ≥180=0, 140–179=1, 100–139=2, and <100=3. The sum of these component points constituted the total CONUT score, which was used to define the level of undernutrition as per the following scale: 0–1: normal, 2–4: mild, 5–8: moderate, and 9–12: severe. In general, a CONUT score ≥3 is defined as a high score.14

Clinical outcomes and immunosuppressive therapies

All-cause mortality, relapse, and ESRD were evaluated as poor outcome measures of AAV. All-cause mortality was defined as death due to any reason during follow-up, and ESRD was defined as an impairment of renal function requiring dialysis. Relapse was defined as recurrence or new-onset of disease with active vasculitis.21 The total follow-up duration was recorded as the time-interval from the point of diagnosis of AAV to the last visit, to death, to the time of relapse, and to the time of initiation of dialysis for the surviving, deceased, relapsed, and ESRD patients, respectively. We also reviewed the immunosuppressive therapies administered in all patients during follow-up, including glucocorticoids, cyclophosphamide, rituximab, azathioprine, mycophenolate mofetil, tacrolimus, methotrexate, and plasma exchange.

Statistical analyses

All statistical analyses were conducted using SPSS software (version 23 for Windows; IBM Corp., Armonk, NY, USA). Continuous variables were expressed as a mean±standard deviation, and categorical variables were expressed as a number (percentages). Significant differences between the two groups were analysed using the chi-square with Fisher's exact tests and Mann-Whitney test. The optimal cut-off for the score was extrapolated by plotting the receiver operator characteristic (ROC) curve and estimating the maximised sum of sensitivity and specificity. The correlation coefficient was obtained using Pearson correlation analysis. The comparison of cumulative survival between the two groups was performed using Kaplan-Meier survival analysis. Multivariate Cox hazard model was estimated using variables showing statistical significance in the preceding univariate Cox hazard analysis, in order to obtain hazard ratios (HRs). p values<0.05 were considered statistically significant.

RESULTS

Comparison of baseline variables between AAV patients with low and high CONUT score at diagnosis

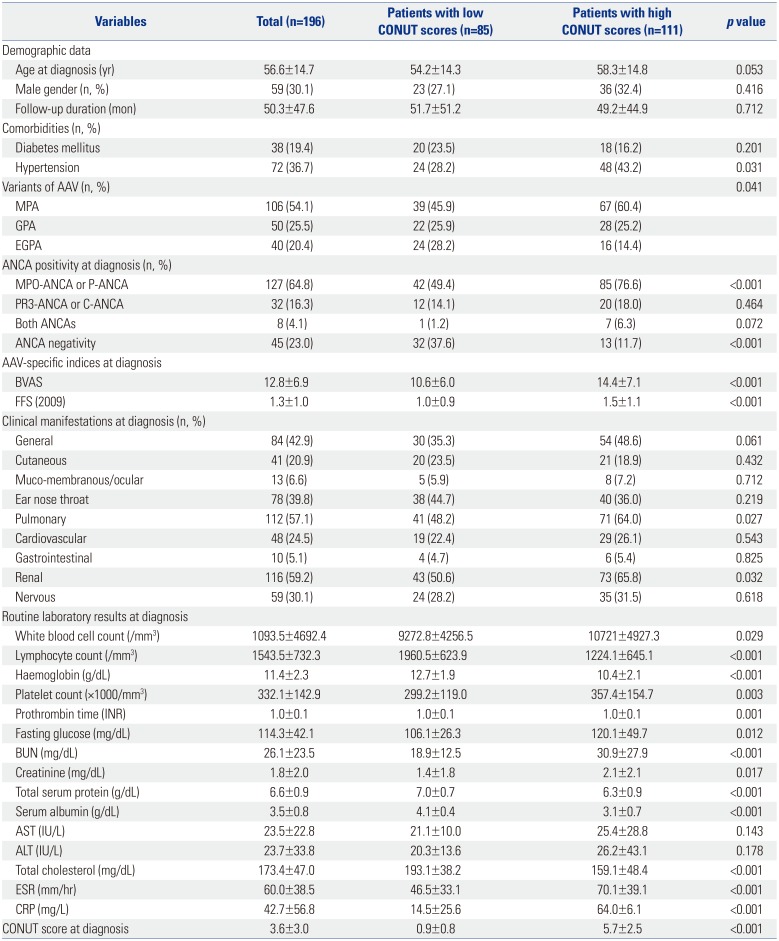
The mean age of 196 AAV patients (106, 50, and 40 patients diagnosed with MPA, GPA, and EGPA, respectively) was 56.6 years; 59 patients were male. The mean follow-up duration was 50.3 months. The mean CONUT score at diagnosis was 3.6. Patients with AAV were divided into two groups: high (defined as ≥3) or low CONUT score; 111 patients were included in high-score group. The mean score of AAV patients included in the high and low CONUT score groups were 5.7 and 0.9. Patients with low CONUT scores exhibited higher frequency of HTN compared to those with high CONUT scores. Between patients with low CONUT scores and those with high CONUT scores, the proportion of EGPA was higher in low CONUT score group (28.2% vs. 14.4%, p=0.041), and 60% of EGPA patients had low CONUT score. MPO-ANCA (or P-ANCA) was more frequently detected in patients with high CONUT scores, whereas ANCA negativity was more prevalent in patients with low scores. Patients with high CONUT scores showed higher mean values of BVAS and FFS at diagnosis compared to the rest. Pulmonary and renal manifestations were also more frequently observed in patients with high CONUT scores than in those with lower scores. Furthermore, at diagnosis, patients with high CONUT scores exhibited higher white blood cell and platelet counts, along with higher values of prothrombin time, fasting glucose, BUN, creatinine, ESR, and CRP, while conversely showing lower levels of haemoglobin, total serum protein, serum albumin, and total cholesterol, compared to those with low CONUT scores (Table 1).

Correlation between CONUT score and continuous variables at diagnosis

An assessment of AAV-specific indices at diagnosis showed that CONUT score correlated significantly with BVAS (r=0.361, p<0.001) and FFS (r=0.377, p<0.001) values. CONUT score was also found to correlate positively with the levels of white blood cells (r=0.301, p<0.001), platelets (r=0.339, p<0.001), prothrombin time (r=0.491, p<0.001), fasting glucose (r=0.154, p=0.031), BUN (r=0.204, p=0.004), AST (r=0.216, p=0.002), ALT (r=0.172, p=0.016), ESR (r=0.465, p<0.001), and CRP (r=0.636, p<0.001). Conversely, the score correlated negatively with the haemoglobin level (r=−0.553, p<0.001) and total serum protein (r=−0.552, p<0.001) at diagnosis. Since lymphocyte count, levels of serum albumin, and total cholesterol were used in the calculation of CONUT score, they were not included in the correlation analysis (Supplementary Table 1, only online).

Comparison of follow-up variables between AAV patients with low and high CONUT scores

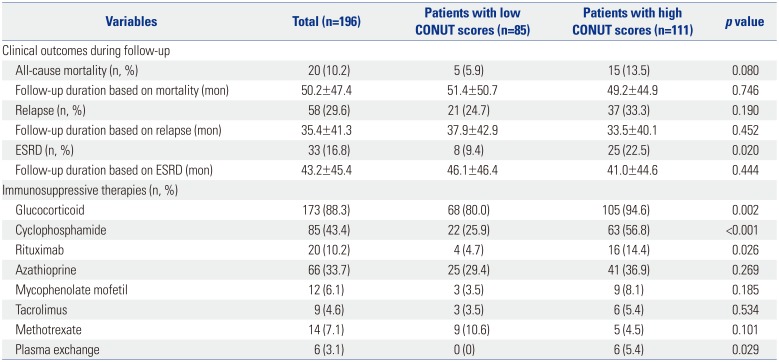
In Table 2, we have summarized a comparison of follow-up variables, including clinical outcomes of AAV, and the immunosuppressive therapy administered between patients with high and low CONUT scores. During follow-up, patients with high CONUT scores showed higher frequency of development of ESRD than the rest. Glucocorticoids, cyclophosphamide, and rituximab had been administered more frequently to patients with high CONUT scores compared to those with low scores. Moreover, plasma exchange had been performed only in patients with high CONUT scores. These results suggest that a high CONUT score was indicative of increased AAV activity, which required more aggressive immunosuppression.

Cut-offs of CONUT score and cumulative survival rates

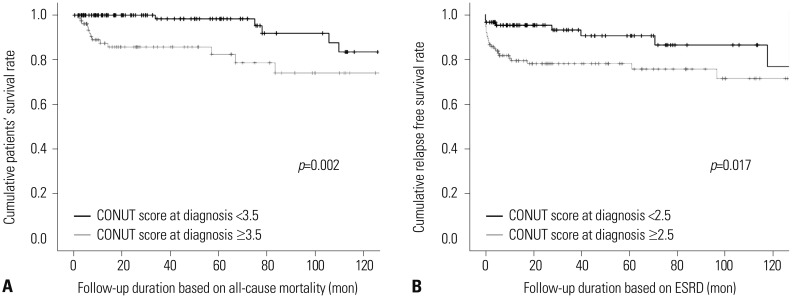
The optimal cut-offs of CONUT score estimated at diagnosis for predicting all-cause mortality and ESRD occurrence were ≥3.5 [area under the curve (AUC): 0.680; 95% confidence interval (CI): 0.541, 0.819; sensitivity: 0.700; specificity: 0.631] and ≥2.5 (AUC: 0.628; 95% CI: 0.535, 0722; sensitivity: 0.758; specificity: 0.528), respectively. However, an optimal cut-off of CONUT score at diagnosis for predicting relapse could not be determined in this study (Fig. 1). Using these CONUT-score cutoffs, we investigated the cumulative and ESRD-free survival rates during subsequent follow-ups, between AAV patients with scores below and above the respective cut-off point at diagnosis. First, newly diagnosed AAV patients with baseline CONUT scores ≥3.5 exhibited lower cumulative survival rates than those who scored <3.5 (p=0.002). Similarly, AAV patients with CONUT scores ≥2.5 at diagnosis showed lower cumulative ESRD-free survival rate than those who scored <2.5 (p=0.017) (Fig. 2).

Univariate and multivariate Cox hazard model analyses for all cause-mortality

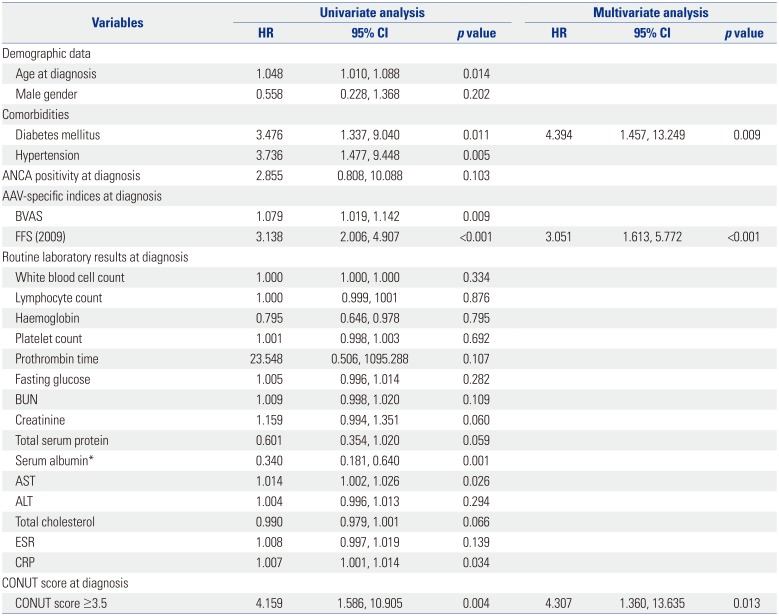
In univariate analysis of various variables assessed at diagnosis, factors such as age, comorbidity of DM, HTN, BVAS, FFS, and levels of serum albumin, AST, CRP, and a CONUT score ≥3.5 were found to be significantly associated with all-cause mortality during subsequent follow-up. Due to multicollinearity between serum albumin and CONUT score, the former parameter was excluded from multivariate Cox hazards model analysis, despite its statistical significance in univariate analysis. In multivariate analysis of variables showing statistical significance in univariate analysis, DM (HR: 4.394, 95% CI: 1.457, 13.249), FFS (HR: 3.051, 95% CI: 1.613, 5.772) values, and CONUT scores ≥3.5 (HR: 4.307, 95% CI: 1.360, 13.635) at diagnosis were found to be independent predictors of all-cause mortality during follow-up (Table 3).

Univariate and multivariate Cox hazard model analyses for ESRD occurrence

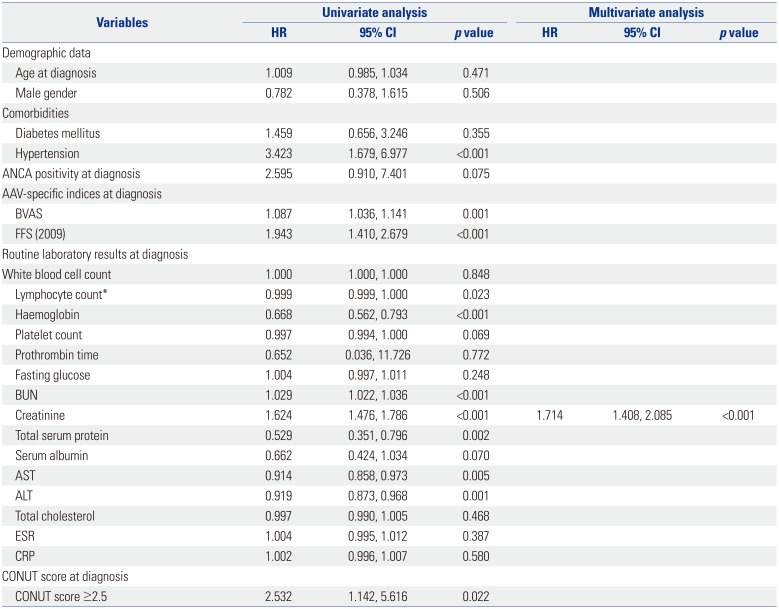
In univariate analysis of variables recorded at diagnosis, factors such as comorbidity of HTN, BVAS, FFS, lymphocyte count, haemoglobin, BUN, serum creatinine, total serum protein, AST, ALT, and a CONUT score ≥2.5 were found to be significantly associated with ESRD occurrence during follow-up. Although lymphocyte count is one of the items used to calculate CONUT score, since there was no multicollinearity between the former parameter and the score, it was included in the multivariate analysis. In multivariate analysis of variables showing statistical significance in univariate analysis, only serum creatinine (HR: 1.714, 95% CI: 1.408, 2.085) was determined to be an independent predictor of development of ESRD during follow-up (Table 4).

DISCUSSION

In this study, we first demonstrated that the CONUT score estimated at diagnosis could predict all-cause mortality in AAV patients during follow-up, but it could not be used to prognosticate either relapse or ESRD occurrence. To date, an increased rate of all-cause mortality in AAV patients has been reported to depend on several baseline factors determined at diagnosis, including MPO-ANCA positivity, late-onset AAV, and the CRP-to-serum albumin and the albumin-to-globulin ratios.892223 We re-evaluated their clinical correlation to the all-cause mortality rate in our study population. In univariate Cox hazards model analysis, a newly diagnosed patient's age (HR: 1.048, p=0.014), CRP level (HR: 1.007, p=0.034), and serum albumin level (HR: 0.340, p=0.001) were found to be individually and significantly associated with all-cause mortality during subsequent follow-up, while MPO-ANCA positivity at diagnosis was not (HR: 1.627, p=0.320). However, these factors did not achieve significance in multivariate Cox hazards model analysis. The advantage of CONUT score is that it consists of three variables, and can thus respond flexibly to external influences without undergoing major variations. In this study, although the lymphocyte count estimated at diagnosis was not found to be associated with all-cause mortality, the serum albumin level at diagnosis exhibited a significant inverse association, while total cholesterol level showed a tendency to be negatively associated with all-cause mortality. Another advantage of using CONUT score is that we could estimate and propose the optimal cut-off points of the score for predicting all-cause mortality. In this study, newly diagnosed AAV patients with CONUT scores ≥3.5 at diagnosis showed a 4.3 times higher rate of mortality compared to those with scores <3.5. Moreover, the statistical potential of a CONUT score (calculated at diagnosis) ≥3.5 in predicting all-cause mortality was comparable to that of FFS determined at diagnosis.
Hypercholesterolaemia is well-known to be one of the conventional risk factors for all-cause mortality in the general population.24 However, according to the CONUT scoring system, higher scores are assigned to patients with lower total cholesterol levels. Thus, there might be discordance in predicting all-cause mortality, as the score disregards the conventional risk factor of hypercholesterolemia in favour of including only hypocholesterolaemia as a CONUT score-elevating parameter. However, it is notable that several reports have revealed a U-shaped (or a non-linear) association between serum total cholesterol levels and all-cause mortality.2526 Another previous study proved that decreased cholesterol or persistently low cholesterol levels were associated with a higher risk of mortality in Korean adults, by explaining how malnutrition associated with low levels of high-density lipoprotein-cholesterol is a risk factor for non-ischaemic heart disease, and how it might play a harmful role by increasing the mortality rate in the general population.27 In our univariate Cox hazards model analysis, total cholesterol did not show a statistically significant association (p=0.066) with all-cause mortality. However, it did exhibit a tendency to be associated with fatality, and we believe this might augment the potential of CONUT score estimated at diagnosis for prediction of all-cause mortality.
Various comorbidities, such as DM, HTN, dyslipidaemia, and chronic renal disease, could also influence all-cause mortality.24 Of these, dyslipidaemia was substituted by either the total cholesterol level or CONUT score, while development of chronic renal disease was assessed using serum creatinine levels estimated at the time of diagnosis. However, the aim of this study was to discover the significance of baseline clinical manifestations and routine laboratory results (particularly those included in CONUT scoring system) in newly diagnosed patients, for predicting poor outcomes of AAV during follow-up; therefore, the contribution of DM and HTN to all-cause mortality was not a part of frontline-assessment in this study. In addition, when we conducted multivariate Cox hazards model analysis, we found that co-existing DM (HR: 4.394, 95% CI: 1.457, 13.249), FFS (HR: 3.051, 95% CI: 1.613, 5.772), and a CONUT score ≥3.5 (HR: 4.307, 95% CI: 1.360, 13.635) could be used to meaningfully prognosticate all-cause mortality in AAV patients. Therefore, we concluded that the CONUT score calculated at diagnosis could help predict all-cause mortality in AAV patients during follow-up, in a manner comparable to that of conventional risk factors for mortality in the general population.
In our study, AAV patients with high CONUT scores exhibited higher mean BVAS and FFS compared tos those with low CONUT score. We wondered whether CONUT score could be used to estimate AAV severity in our patients. We defined severe AAV as that meeting the lower limit of the highest tertile of BVAS estimated at diagnosis (which was ≥16), and calculated the cut-off point of CONUT score at diagnosis for defining severe AAV, using an ROC curve. The optimal cut-off CONUT score was estimated at 2.5 (AUC: 0.694, 95% CI: 0.616, 0.771, sensitivity: 0.746, specificity: 0.528). When we divided the AAV patients based on this cut-off point, those with CONUT scores ≥2.5 exhibited significantly higher risk of having severe AAV than those who scored <2.5 (relative risk: 3.279, 95% CI: 1.712, 6.279). These findings support our theory that CONUT score is associated with AAV disease activity. However, this result was not included in the main results, as the objective of our study was to determine independent prognostic predictors at the time of AAV diagnosis.
In addition, more EGPA patients than MPA or GPA patients belonged to low CONUT score group. Due to the concern that EGPA patients may negatively affect the main results of this study, we conducted the univariate and multivariate COX hazards model analyses for all cause-mortality in only patients with MPA and GPA again. In multivariate analysis using only variables with statistical significance in univariate analysis, only CONUT score ≥3.5 (HR 4.345, 95% CI: 1.211, 15.585) was an independent predictor of all-cause mortality during follow-up in MPA and GPA patients (Supplementary Table 2, only on line). Therefore, in real clinical practice, it may be more convenient to apply the cut-off of CONUT score ≥ 3.5 to all variants of AAV, including MPA, GPA, and EGPA.
Our study is noteworthy in that we are the first to assess the clinical implications of using CONUT score at diagnosis for predicting all-cause mortality in AAV patients. Furthermore, we have suggested the optimal cut-off points of CONUT score calculated in newly diagnosed patients for the prediction of all-cause mortality. We calculated the effectiveness of CONUT score estimated at the time of diagnosis in patients who had yet to receive immunosuppressive therapy, which minimised the effect of any therapeutic interventions on the predictive ability of this scoring system. However, our study also had several limitations. Firstly, we could not assess variables such as genetic factors and daily-food habits, which are known to affect all-cause mortality. Secondly, we could not perform adjustment for confounding factors, e.g. treatment modalities, due to the retrospective nature of this study. Thirdly, the mean follow-up duration in this study was 50.3 months, which was not long enough to be representative of a real clinical setting for this disorder. Future prospective studies may be able to provide more reliable and validated evidence regarding the potential of CONUT score determined at diagnosis in predicting the outcomes of AAV.
In conclusion, CONUT score calculated at the time of diagnosis of AAV is associated with all-cause mortality in affected patients. Therefore, we suggest that CONUT score may be utilized as a complementary index to predict eventual AAV outcomes in clinical practice.

ACKNOWLEDGEMENTS

This research was supported by the Basic Science Research Program through the National Research Foundation of Korea (NRF) funded by the Ministry of Education (2017R1D1A1B03029050), and a grant from the Korea Health Technology R&D Project through the Korea Health Industry Development Institute funded by the Ministry of Health and Welfare, Republic of Korea (HI14C1324).

Notes

The authors have no potential conflicts of interest to disclose.

AUTHOR CONTRIBUTIONS:

  • Conceptualization: Sung Soo Ahn and Sang-Won Lee.

  • Data curation: Sung Soo Ahn, Seung Min Jung, and Sang-Won Lee.

  • Formal analysis: Sung Soo Ahn and Sang-Won Lee.

  • Funding acquisition: Sang-Won Lee.

  • Investigation: Sung Soo Ahn and Sang-Won Lee.

  • Methodology: Sung Soo Ahn, Seung Min Jung, and Sang-Won Lee.

  • Project administration: Sung Soo Ahn and Sang-Won Lee.

  • Resources: All authors.

  • Software: Sung Soo Ahn and Sang-Won Lee.

  • Supervision: Jason Jungsik Song and Yong-Beom Park.

  • Validation: Jason Jungsik Song, Yong-Beom Park, and Sang-Won Lee.

  • Visualization: Sung Soo Ahn and Sang-Won Lee.

  • Writing—original draft: Sung Soo Ahn and Sang-Won Lee.

  • Writing—review & editing: All authors.

References

1. Jennette JC, Falk RJ, Bacon PA, Basu N, Cid MC, Ferrario F, et al. 2012 revised International Chapel Hill Consensus Conference Nomenclature of Vasculitides. Arthritis Rheum. 2013; 65:1–11. PMID: 23045170.
crossref
2. Jennette JC, Falk RJ, Andrassy K, Bacon PA, Churg J, Gross WL, et al. Nomenclature of systemic vasculitides. Proposal of an international consensus conference. Arthritis Rheum. 1994; 37:187–192. PMID: 8129773.
3. Tan JA, Dehghan N, Chen W, Xie H, Esdaile JM, Avina-Zubieta JA. Mortality in ANCA-associated vasculitis: ameta-analysis of observational studies. Ann Rheum Dis. 2017; 76:1566–1574. PMID: 28468793.
crossref
4. Elefante E, Monti S, Bond M, Lepri G, Quartuccio L, Talarico R, et al. One year in review 2017: systemic vasculitis. Clin Exp Rheumatol. 2017; 35 Suppl 103:5–26.
5. Kristensen T, Gregersen JW, Krag SR, Ivarsen P. The relation between histopathological classification and renal outcome, ANCA subtype and treatment regimens in ANCA-associated vasculitis. Clin Exp Rheumatol. 2016; 34(3 Suppl 97):S105–S110. PMID: 27241586.
6. Furuta S, Chaudhry AN, Arimura Y, Dobashi H, Fujimoto S, Homma S, et al. Comparison of the phenotype and outcome of granulomatosis with polyangiitis between UK and Japanese cohorts. J Rheumatol. 2017; 44:216–222. PMID: 27803133.
crossref
7. Furuta S, Chaudhry AN, Hamano Y, Fujimoto S, Nagafuchi H, Makino H, et al. Comparison of phenotype and outcome in microscopic polyangiitis between Europe and Japan. J Rheumatol. 2014; 41:325–333. PMID: 24429174.
crossref
8. Moon JS, Ahn SS, Park YB, Lee SK, Lee SW. C-reactive protein to serum albumin ratio is an independent predictor of all-cause mortality in patients with ANCA-associated vasculitis. Yonsei Med J. 2018; 59:865–871. PMID: 30091320.
crossref
9. Ahn SS, Yoo J, Jung SM, Song JJ, Park YB, Lee SW. Clinical role of albumin to globulin ratio in microscopic polyangiitis: a retrospective monocentric study. Clin Rheumatol. 2019; 38:487–494. PMID: 30218289.
crossref
10. Ahn SS, Jung SM, Song JJ, Park YB, Lee SW. Neutrophil to lymphocyte ratio at diagnosis can estimate vasculitis activity and poor prognosis in patients with ANCA-associated vasculitis: a retrospective study. BMC Nephrol. 2018; 19:187. PMID: 30064369.
crossref
11. Yoo J, Ahn SS, Jung SM, Song JJ, Park YB, Lee SW. Delta neutrophil index is associated with vasculitis activity and risk of relapse in ANCA-associated vasculitis. Yonsei Med J. 2018; 59:397–405. PMID: 29611402.
crossref
12. Kim Y, Choi H, Jung SM, Song JJ, Park YB, Lee SW. Systemic immune-inflammation index could estimate the cross-sectional high activity and the poor outcomes in immunosuppressive drugnaïve patients with antineutrophil cytoplasmic antibody-associated vasculitis. Nephrology. 2019; 24:711–717. PMID: 30203901.
crossref
13. Choi H, Kim Y, Jung SM, Song JJ, Park YB, Lee SW. Low serum complement 3 level is associated with severe ANCA-associated vasculitis at diagnosis. Clin Exp Nephrol. 2019; 23:223–230. PMID: 30168048.
crossref
14. Ignacio de Ulíbarri J, González-Madroño A, de Villar NG, González P, González B, Mancha A, et al. CONUT: a tool for controlling nutritional status. First validation in a hospital population. Nutr Hosp. 2005; 20:38–45.
15. Liang RF, Li JH, Li M, Yang Y, Liu YH. The prognostic role of controlling nutritional status scores in patients with solid tumors. Clin Chim Acta. 2017; 474:155–158. PMID: 28964833.
crossref
16. Nakagomi A, Kohashi K, Morisawa T, Kosugi M, Endoh I, Kusama Y, et al. Nutritional status is associated with inflammation and predicts a poor outcome in patients with chronic heart failure. J Atheroscler Thromb. 2016; 23:713–727. PMID: 26782970.
crossref
17. Rus VA, Chitu M, Cernea S, Benedek I, Hodas R, Zavate R, et al. Altered nutritional status, inflammation and systemic vulnerability in patients with acute myocardial infarction undergoing percutaneous coronary revascularisation: a prospective study in a level 3 cardiac critical care unit. Nutr Diet. 2019; 5. 07. DOI: 10.1111/1747-0080.12536. [Epub].
crossref
18. Mukhtyar C, Lee R, Brown D, Carruthers D, Dasgupta B, Dubey S, et al. Modification and validation of the Birmingham Vasculitis Activity Score (version 3). Ann Rheum Dis. 2009; 68:1827–1832. PMID: 19054820.
crossref
19. Stone JH, Hoffman GS, Merkel PA, Min YI, Uhlfelder ML, Hellmann DB, et al. A disease-specific activity index for Wegener's granulomatosis: modification of the Birmingham Vasculitis Activity Score. International Network for the Study of the Systemic Vasculitides (INSSYS). Arthritis Rheum. 2001; 44:912–920. PMID: 11318006.
20. Guillevin L, Pagnoux C, Seror R, Mahr A, Mouthon L, Le Toumelin P, et al. The Five-Factor Score revisited: assessment of prognoses of systemic necrotizing vasculitides based on the French Vasculitis Study Group (FVSG) cohort. Medicine (Baltimore). 2011; 90:19–27. PMID: 21200183.
21. Mukhtyar C, Hellmich B, Jayne D, Flossmann O, Luqmani R. Remission in antineutrophil cytoplasmic antibody-associated systemic vasculitis. Clin Exp Rheumatol. 2006; 24(6 Suppl 43):S-93–S-98.
22. Hasegawa M, Hattori K, Sugiyama S, Asada H, Yamashita H, Takahashi K, et al. A retrospective study on the outcomes of MPO-ANCAassociated vasculitis in dialysis-dependent patients. Mod Rheumatol. 2016; 26:110–114. PMID: 25967129.
crossref
23. Titeca-Beauport D, Francois A, Lobbedez T, Guerrot D, Launay D, Vrigneaud L, et al. Early predictors of one-year mortality in patients over 65 presenting with ANCA-associated renal vasculitis: a retrospective, multicentre study. BMC Nephrol. 2018; 19:317. PMID: 30413153.
crossref
24. Murray CJ, Atkinson C, Bhalla K, Birbeck G, Burstein R, Chou D, et al. The state of US health, 1990-2010: burden of diseases, injuries, and risk factors. JAMA. 2013; 310:591–608. PMID: 23842577.
25. Nago N, Ishikawa S, Goto T, Kayaba K. Low cholesterol is associated with mortality from stroke, heart disease, and cancer: the Jichi Medical School Cohort Study. J Epidemiol. 2011; 21:67–74. PMID: 21160131.
crossref
26. Kronmal RA, Kosinski AS, Mock MB. The relationship between cholesterol level and myocardial infarction or mortality risk in patients with coronary artery disease. A report from the Coronary Artery Surgery Study (CASS) registry. Ann Epidemiol. 1992; 2:129–136. PMID: 1342254.
crossref
27. Bae JM, Yang YJ, Li ZM, Ahn YO. Low cholesterol is associated with mortality from cardiovascular diseases: a dynamic cohort study in Korean adults. J Korean Med Sci. 2012; 27:58–63. PMID: 22219615.
crossref

SUPPLEMENTARY MATERIALS

Supplementary Table 1

Correlation between CONUT Score and Continuous Variables Assessed at Diagnosis
ymj-60-1164-s001.pdf

Supplementary Table 2

Predictors at Diagnosis for All-Cause Mortality during Follow-Up in MPA and GPA Patients (n=156)
ymj-60-1164-s002.pdf
Fig. 1

Receiver operator characteristics curve analysis of controlling nutritional status score at diagnosis for predicting occurrence of (A) all-cause mortality, (B) relapse, and (C) end-stage renal disease (ESRD). CI, confidence interval.

ymj-60-1164-g001
Fig. 2

Kaplan-Meier analysis of controlling nutritional status (CONUT) score at diagnosis for predicting occurrence of all-cause mortality and end-stage renal disease (ESRD) during follow-up. (A) All-cause mortality and (B) ESRD.

ymj-60-1164-g002
Table 1

Comparison of Variables between AAV Patients with Low and High CONUT Scores at Diagnosis

ymj-60-1164-i001
Variables Total (n=196) Patients with low CONUT scores (n=85) Patients with high CONUT scores (n=111) p value
Demographic data
 Age at diagnosis (yr) 56.6±14.7 54.2±14.3 58.3±14.8 0.053
 Male gender (n, %) 59 (30.1) 23 (27.1) 36 (32.4) 0.416
 Follow-up duration (mon) 50.3±47.6 51.7±51.2 49.2±44.9 0.712
Comorbidities (n, %)
 Diabetes mellitus 38 (19.4) 20 (23.5) 18 (16.2) 0.201
 Hypertension 72 (36.7) 24 (28.2) 48 (43.2) 0.031
Variants of AAV (n, %) 0.041
 MPA 106 (54.1) 39 (45.9) 67 (60.4)
 GPA 50 (25.5) 22 (25.9) 28 (25.2)
 EGPA 40 (20.4) 24 (28.2) 16 (14.4)
ANCA positivity at diagnosis (n, %)
 MPO-ANCA or P-ANCA 127 (64.8) 42 (49.4) 85 (76.6) <0.001
 PR3-ANCA or C-ANCA 32 (16.3) 12 (14.1) 20 (18.0) 0.464
 Both ANCAs 8 (4.1) 1 (1.2) 7 (6.3) 0.072
 ANCA negativity 45 (23.0) 32 (37.6) 13 (11.7) <0.001
AAV-specific indices at diagnosis
 BVAS 12.8±6.9 10.6±6.0 14.4±7.1 <0.001
 FFS (2009) 1.3±1.0 1.0±0.9 1.5±1.1 <0.001
Clinical manifestations at diagnosis (n, %)
 General 84 (42.9) 30 (35.3) 54 (48.6) 0.061
 Cutaneous 41 (20.9) 20 (23.5) 21 (18.9) 0.432
 Muco-membranous/ocular 13 (6.6) 5 (5.9) 8 (7.2) 0.712
 Ear nose throat 78 (39.8) 38 (44.7) 40 (36.0) 0.219
 Pulmonary 112 (57.1) 41 (48.2) 71 (64.0) 0.027
 Cardiovascular 48 (24.5) 19 (22.4) 29 (26.1) 0.543
 Gastrointestinal 10 (5.1) 4 (4.7) 6 (5.4) 0.825
 Renal 116 (59.2) 43 (50.6) 73 (65.8) 0.032
 Nervous 59 (30.1) 24 (28.2) 35 (31.5) 0.618
Routine laboratory results at diagnosis
 White blood cell count (/mm3) 1093.5±4692.4 9272.8±4256.5 10721±4927.3 0.029
 Lymphocyte count (/mm3) 1543.5±732.3 1960.5±623.9 1224.1±645.1 <0.001
 Haemoglobin (g/dL) 11.4±2.3 12.7±1.9 10.4±2.1 <0.001
 Platelet count (×1000/mm3) 332.1±142.9 299.2±119.0 357.4±154.7 0.003
 Prothrombin time (INR) 1.0±0.1 1.0±0.1 1.0±0.1 0.001
 Fasting glucose (mg/dL) 114.3±42.1 106.1±26.3 120.1±49.7 0.012
 BUN (mg/dL) 26.1±23.5 18.9±12.5 30.9±27.9 <0.001
 Creatinine (mg/dL) 1.8±2.0 1.4±1.8 2.1±2.1 0.017
 Total serum protein (g/dL) 6.6±0.9 7.0±0.7 6.3±0.9 <0.001
 Serum albumin (g/dL) 3.5±0.8 4.1±0.4 3.1±0.7 <0.001
 AST (IU/L) 23.5±22.8 21.1±10.0 25.4±28.8 0.143
 ALT (IU/L) 23.7±33.8 20.3±13.6 26.2±43.1 0.178
 Total cholesterol (mg/dL) 173.4±47.0 193.1±38.2 159.1±48.4 <0.001
 ESR (mm/hr) 60.0±38.5 46.5±33.1 70.1±39.1 <0.001
 CRP (mg/L) 42.7±56.8 14.5±25.6 64.0±6.1 <0.001
CONUT score at diagnosis 3.6±3.0 0.9±0.8 5.7±2.5 <0.001

AAV, ANCA-associated vasculitis; CONUT, controlling nutritional status; MPA, microscopic polyangiitis; GPA, granulomatosis with polyangiitis; EGPA, eosinophilic granulomatosis with polyangiitis; ANCA, antineutrophil cytoplasmic antibody; MPO, myeloperoxidase; P, perinuclear; PR3, proteinase 3; C, cytoplasmic; BVAS, Birmingham vasculitis activity score; FFS, five-factor score; INR, international normalized ratio; BUN, blood urea nitrogen; AST, aspartate transaminase; ALT, alanine transaminase; ESR, erythrocyte sedimentation rate; CRP, C-reactive protein.

Values are expressed as mean±standard deviation or number (%) unless otherwise indicated.

Table 2

Comparison of Clinical Outcomes, Comorbidities, and Immunosuppressive Therapies during Follow-Up between AAV Patients with Low and High CONUT Scores at Diagnosis

ymj-60-1164-i002
Variables Total (n=196) Patients with low CONUT scores (n=85) Patients with high CONUT scores (n=111) p value
Clinical outcomes during follow-up
 All-cause mortality (n, %) 20 (10.2) 5 (5.9) 15 (13.5) 0.080
 Follow-up duration based on mortality (mon) 50.2±47.4 51.4±50.7 49.2±44.9 0.746
 Relapse (n, %) 58 (29.6) 21 (24.7) 37 (33.3) 0.190
 Follow-up duration based on relapse (mon) 35.4±41.3 37.9±42.9 33.5±40.1 0.452
 ESRD (n, %) 33 (16.8) 8 (9.4) 25 (22.5) 0.020
 Follow-up duration based on ESRD (mon) 43.2±45.4 46.1±46.4 41.0±44.6 0.444
Immunosuppressive therapies (n, %)
 Glucocorticoid 173 (88.3) 68 (80.0) 105 (94.6) 0.002
 Cyclophosphamide 85 (43.4) 22 (25.9) 63 (56.8) <0.001
 Rituximab 20 (10.2) 4 (4.7) 16 (14.4) 0.026
 Azathioprine 66 (33.7) 25 (29.4) 41 (36.9) 0.269
 Mycophenolate mofetil 12 (6.1) 3 (3.5) 9 (8.1) 0.185
 Tacrolimus 9 (4.6) 3 (3.5) 6 (5.4) 0.534
 Methotrexate 14 (7.1) 9 (10.6) 5 (4.5) 0.101
 Plasma exchange 6 (3.1) 0 (0) 6 (5.4) 0.029

AAV, antineutrophil cytoplasmic antibody-associated vasculitis; CONUT, controlling nutritional status; ESRD, end-stage renal disease.

Values are expressed as mean±standard deviation or number (%) unless otherwise indicated.

Table 3

Predictors of All-Cause Mortality during Follow-Up in AAV Patients

ymj-60-1164-i003
Variables Univariate analysis Multivariate analys
HR 95% CI p value HR 95% CI p value
Demographic data
 Age at diagnosis 1.048 1.010, 1.088 0.014
 Male gender 0.558 0.228, 1.368 0.202
Comorbidities
 Diabetes mellitus 3.476 1.337, 9.040 0.011 4.394 1.457, 13.249 0.009
 Hypertension 3.736 1.477, 9.448 0.005
ANCA positivity at diagnosis 2.855 0.808, 10.088 0.103
AAV-specific indices at diagnosis
 BVAS 1.079 1.019, 1.142 0.009
 FFS (2009) 3.138 2.006, 4.907 <0.001 3.051 1.613, 5.772 <0.001
Routine laboratory results at diagnosis
 White blood cell count 1.000 1.000, 1.000 0.334
 Lymphocyte count 1.000 0.999, 1001 0.876
 Haemoglobin 0.795 0.646, 0.978 0.795
 Platelet count 1.001 0.998, 1.003 0.692
 Prothrombin time 23.548 0.506, 1095.288 0.107
 Fasting glucose 1.005 0.996, 1.014 0.282
 BUN 1.009 0.998, 1.020 0.109
 Creatinine 1.159 0.994, 1.351 0.060
 Total serum protein 0.601 0.354, 1.020 0.059
 Serum albumin* 0.340 0.181, 0.640 0.001
 AST 1.014 1.002, 1.026 0.026
 ALT 1.004 0.996, 1.013 0.294
 Total cholesterol 0.990 0.979, 1.001 0.066
 ESR 1.008 0.997, 1.019 0.139
 CRP 1.007 1.001, 1.014 0.034
CONUT score at diagnosis
 CONUT score ≥3.5 4.159 1.586, 10.905 0.004 4.307 1.360, 13.635 0.013

AAV, ANCA-associated vasculitis; HR, hazard ratio; CI, confidence interval; ANCA, antineutrophil cytoplasmic antibody; BVAS, Birmingham vasculitis activity score; FFS, five-factor score; BUN, blood urea nitrogen; AST, aspartate transaminase; ALT, alanine transaminase; ESR, erythrocyte sedimentation rate; CRP, C-reactive protein; CONUT, controlling nutritional status.

*Due to multicollinearity between serum albumin and CONUT score, serum albumin was excluded from multivariate Cox hazards model analysis despite a statistically significant association found in univariate analysis.

Table 4

Predictors of ESRD during Follow-Up in AAV Patients

ymj-60-1164-i004
Variables Univariate analysis Multivariate analysis
HR 95% CI p value HR 95% CI p value
Demographic data
 Age at diagnosis 1.009 0.985, 1.034 0.471
 Male gender 0.782 0.378, 1.615 0.506
Comorbidities
 Diabetes mellitus 1.459 0.656, 3.246 0.355
 Hypertension 3.423 1.679, 6.977 <0.001
ANCA positivity at diagnosis 2.595 0.910, 7.401 0.075
AAV-specific indices at diagnosis
 BVAS 1.087 1.036, 1.141 0.001
 FFS (2009) 1.943 1.410, 2.679 <0.001
Routine laboratory results at diagnosis
White blood cell count 1.000 1.000, 1.000 0.848
 Lymphocyte count* 0.999 0.999, 1.000 0.023
 Haemoglobin 0.668 0.562, 0.793 <0.001
 Platelet count 0.997 0.994, 1.000 0.069
 Prothrombin time 0.652 0.036, 11.726 0.772
 Fasting glucose 1.004 0.997, 1.011 0.248
 BUN 1.029 1.022, 1.036 <0.001
 Creatinine 1.624 1.476, 1.786 <0.001 1.714 1.408, 2.085 <0.001
 Total serum protein 0.529 0.351, 0.796 0.002
 Serum albumin 0.662 0.424, 1.034 0.070
 AST 0.914 0.858, 0.973 0.005
 ALT 0.919 0.873, 0.968 0.001
 Total cholesterol 0.997 0.990, 1.005 0.468
 ESR 1.004 0.995, 1.012 0.387
 CRP 1.002 0.996, 1.007 0.580
CONUT score at diagnosis
 CONUT score ≥2.5 2.532 1.142, 5.616 0.022

ESRD, end-stage renal disease; AAV, ANCA-associated vasculitis; HR, hazard ratio; CI, confidence interval; ANCA, antineutrophil cytoplasmic antibody; BVAS, Birmingham vasculitis activity score; FFS, five-factor score; BUN, blood urea nitrogen; AST, aspartate transaminase; ALT, alanine transaminase; ESR, erythrocyte sedimentation rate; CRP, C-reactive protein; CONUT, controlling nutritional status.

*Although lymphocyte count is one of the criteria of CONUT scoring system, it was included in multivariate analysis since no multicollinearity was observed between lymphocyte count and the score.

TOOLS
Similar articles