

 PDF
PDF ePub
ePub Citation
 Print
Print


Abstract
Purpose
Methods
Results
Figures and Tables
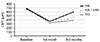 | Figure 1Changes of central macular thickness (CMT) among study groups during 3 months of follow up period. The CMT of all groups was decreased at postoperative 1 month and 3 months compared with baseline. IVB = intravitreal bevacizumab injection; IVB + IVTA = intravitreal low-dose bevacizumab and triamcinolone injection; IVD = intravitreal dexamethasone implant.
|
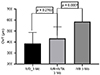 | Figure 2Comparison of central macular thickness (CMT) among study groups at postoperative 3 months. Note that the CMT of IVB group was increased significantly more than IVD and IVB+IVTA groups. IVB = intravitreal bevacizumab injection; IVB + IVTA = intravitreal low-dose bevacizumab and triamcinolone injection; IVD = intravitreal dexamethasone implant; Mo = month(s).
|
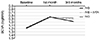 | Figure 3Changes of visual acuity among study groups during 3 months of follow up period. At postoperative 1 month, the best corrected visual acuity (BCVA) of all groups was increased significantly. At postoperative 3 months, the BCVA was significantly improved only in the intravitreal dexamethasone implant group compared with baseline. logMAR = logarithm of the minimal angle of resolution; IVB = intravitreal bevacizumab injection; IVB + IVTA = intravitreal low-dose bevacizumab and triamcinolone injection.
|
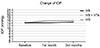 | Figure 4Changes of intraocular pressure (IOP) among study groups during 3 months of follow up period. The IOP showed no significant change at postoperative 3 months after injection in all three groups. IVB = intravitreal bevacizumab injection; IVB + IVTA = intravitreal low-dose bevacizumab and triamcinolone injection; IVD = intravitreal dexamethasone implant.
|
Table 1
Baseline and demographic characteristics
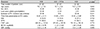
Values are presented as mean ± standard deviation or number (%) unless otherwise indicated.
IVB = intravitreal bevacizumab injection; IVB+IVTA = intravitreal low-dose bevacizumab and triamcinolone injection; IVD = intravitreal dexamethasone implant; M:F = male:female; FA = fluorescein angiography; IVI = intravitreal injection; DM = diabetes mellitus; HTN = hypertension; CMT = central macular thickness; BCVA = best-corrected visual acuity; logMAR= logarithm of the minimal angle of resolution; IOP = intraocular pressure.
*Kruskal-Wallis test.
![]()
Table 2
Comparison of CMT in the three groups
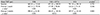
Values are presented as mean ± standard deviation.
IVB = intravitreal bevacizumab injection; IVB + IVTA = intravitreal low-dose bevacizumab and triamcinolone injection; IVD = intravitreal dexamethasone implant; CMT = central macular thickness; Post-op = postoperative.
*Kruskal-Wallis test; †p-value compared with baseline, Wilcoxon signed rank test.
![]()
Table 3
Comparison of visual acuity in the three groups
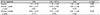
Values are presented as mean ± standard deviation.
IVB = intravitreal bevacizumab injection; IVB + IVTA = intravitreal low-dose bevacizumab and triamcinolone injection; IVD = intravitreal dexamethasone implant; BCVA = best corrected visual acuity; logMAR = logarithm of the minimal angle of resolution; Post-op = postoperative.
*Kruskal-Wallis test; †p-value compared with baseline, Wilcoxon signed rank test.
![]()
Table 4
Comparison of IOP in the three groups
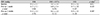
Values are presented as mean ± standard deviation.
IOP = intraocular pressure; IVB = intravitreal bevacizumab injection; IVB + IVTA = intravitreal low-dose bevacizumab and triamcinolone injection; IVD = intravitreal dexamethasone implant; Post-op = postoperative.
*Kruskal-Wallis test; †p-value compared with baseline, Wilcoxon signed rank test.
![]()
 XML Download