

 PDF
PDF ePub
ePub Citation
 Print
Print


Abstract
Purpose
Methods
Results
Figures and Tables
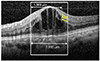 | Figure 1Spectral domain-optical coherence tomography of disorganization of retinal inner layers (DRIL) in a representative case. The yellow lines highlight the inner retinal layer interfaces, which disappear in the areas of DRIL.
|
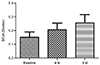 | Figure 2Mean best corrected visual acuity (BCVA) at baseline, 4 months, and 8 months after treatment. BCVA showed increase in 4 months and 8 months after treatment. M = months.
|
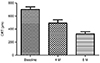 | Figure 3Mean central retinal thickness (CRT) at baseline, 4 months, and 8 months after treatment. CRT was decreased in 4 months and 8 months after treatment. M = months.
|
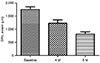 | Figure 4Mean extent of disorganization of inner retinal layers (DRIL) at baseline, 4 months, and 8 months after treatment. DRIL was decreased in 4 months and 8 months after intravitreal dexamethasone implant injection. M = months.
|
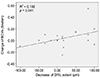 | Figure 5Scatter plot graph between the change of best-corrected visual acuity (BCVA) and the decrease of disorganization of retinal inner layers (DRIL) extent. It shows that more DRIL extent decrease associated with more improvement of BCVA with statistically significant.
|
Table 1
Baseline characteristics and initial SD-OCT parameters of patients
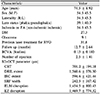
Values are presented as mean ± standard deviation or number unless otherwise indicated.
SD-OCT = spectral domain optical coherence tomography; M:F = male:female; R:L = right:left; FA = fluorescein angiography; DM = diabetes mellitus; RVO = retinal vein occlusion; BCVA = best corrected visual acuity; CRT = central retinal thickness; DRIL = dIsorganization of retinal inner layers; IRC = intra retinal cyst; SRF = sub retinal fluid; ELM = external limiting membrane; EZ = ellipsoid zone.
![]()
Table 2
Association of baseline SD-OCT parameters with baseline BCVA
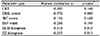
SD-OCT = spectral domain optical coherence tomography; BCVA = best corrected visual acuity; CRT = central retinal thickness; DRIL = disorganization of retinal inner layers; IRC = intra retinal cyst; SRF = sub retinal fluid; ELM = external limiting membrane; EZ = ellipsoid zone.
*Pearson correlation.
![]()
Table 3
Association of baseline SD-OCT parameters with final BCVA
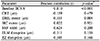
SD-OCT = spectral domain-optical coherence tomography; BCVA = best corrected visual acuity; CRT = central retinal thickness; DRIL = disorganization of retinal inner layers; IRC = intra retinal cyst; SRF = sub retinal fluid; ELM = external limiting membrane; EZ = ellipsoid zone.
*Pearson correlation coefficient.
![]()
 XML Download