

 PDF
PDF ePub
ePub Citation
 Print
Print


Abstract
Purpose
To evaluate the accuracy of predicting refractive outcomes of swept-source optical coherence tomography based biometry (ARGOS; Movu Inc., Santa Clara, CA, USA) in nuclear cataracts.
Methods
A total of 107 eyes (107 nuclear cataract patients) were analyzed. Subjects were divided into three groups according to the maximum nuclear density of Pentacam HR (A, lower tertile; B, medium tertile; C, upper tertile). The keratometry and axial length measured by IOLMaster (Carl Zeiss Meditec, Jena, Germany) and ARGOS systems were compared for each group. The correlation between maximum nuclear density and axial length difference readings from the two instruments was evaluated. The mean absolute error between the predicted refraction and 2-month post-operative refraction was compared.
Results
The maximum nuclear densities were 28.31 ± 7.30, 51.37 ± 7.82, and 88.63 ± 11.23 for groups A, B, and C, respectively. The axial length measured by ARGOS was significantly longer than that obtained using IOLMaster for groups B and C (respectively, p = 0.035, p < 0.001). A significantly positive correlation was found between the maximum nuclear density and axial length difference of the two devices (p < 0.001). Mean absolute errors were not significantly different between IOLMaster and ARGOS in group A. However, in groups B and C, the mean absolute error using ARGOS (0.31 ± 0.22 D and 0.32 ± 0.20 D, respectively) was significantly lower than that of IOLMaster (0.43 ± 0.21 D and 0.50 ± 0.26 D, respectively) (Group B, p = 0.027; Group C, p = 0.001).
Figures and Tables
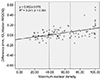 | Figure 1Relationship between maximum nuclear density and the axial length difference. The difference in axial length measurements of the two instruments is positively correlated with the maximum nuclear density.
|
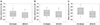 | Figure 2Comparisons of accuracy of predictive postoperative refraction by mean absolute error. Dots represent values outside the first and third quartiles. (A) Maximum lens density in the lower tertile, (B) maximum lens density in the medium tertile, (C) maximum lens density in the upper tertile. D = diopters.
|
Table 1
Patients characteristics
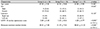
‘Group A’ means maximum lens density in the lower tertile. ‘Group B’ means maximum lens density in the medium tertile, and ‘Group C’ means maximum lens density in the upper tertile. Values are presented as mean ± standard deviation or number (%).
LOCS = Lens Opacities Classification System.
*One-way analysis of variance; †Pearson chi-square test.
![]()
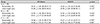
Table 3
Comparison of IOL power with the SRK/T formulas between IOLMaster and ARGOS
‘Group A’ means maximum lens density in the lower tertile, ‘Group B’ means maximum lens density in the medium tertile. ‘Group C’ means maximum lens density in the upper tertile.
IOL = intraocular lens; SRK/T = Sanders-Retzlaff-Kraff/Theoretical; MAE = mean absolute error; SD = standard deviation; D = diopters; MedAE = median absolute error; PE = prediction error.
*Wilcoxon signed rank test.
![]()
References
1. Lee JW, Park SH, Seong MC, et al. Comparison of ocular biometry and postoperative refraction in cataract patients between Galilei-G6(R) and IOL Master(R). J Korean Ophthalmol Soc. 2015; 56:515–520.
2. Yoo TK, Choi MJ, Lee HK, et al. Comparison of ocular biometry and refractive outcomes using IOL Master 700, IOL Master 500, and ultrasound. J Korean Ophthalmol Soc. 2017; 58:523–529.

3. Gimbel HV, Sun R. Accuracy and predictability of intraocular lens power calculation after laser in sity keratomileusis. J Cataract Refract Surg. 2001; 27:571–576.
4. Holzer MP, Mamusa M, Auffarth GU. Accuracy of a new partial coherence interferometry analyser for biometric measurements. Br J Ophthalmol. 2009; 93:807–810.
5. Yu X, Chen H, Savini G, et al. Precision of a new ocular biometry in children and comparison with IOL Master. Sci Rep. 2018; 8:1304.
6. Shammas HJ, Ortiz S, Shammas MC, et al. Biometry measurements using a new large-coherence-length swept-source optical coherence tomographer. J Cataract Refract Surg. 2016; 42:50–61.
7. Shin JW, Seong M, Kang MH, et al. Comparison of ocular biometry and postoperative refraction in cataract patients between Lenstar(R) and IOL Master(R). J Korean Ophthalmol Soc. 2012; 53:833–838.
8. Mylonas G, Sacu S, Buehl W, et al. Performance of three biometry devices in patients with different grades of age-related cataract. Acta Ophthalmol. 2011; 89:e237–e241.
9. Lim DH, Kim TH, Chung ES, Chung TY. Measurement of lens density using Scheimpflug imaging system as a screening test in the field of health examination for age-related cataract. Br J Ophthalmol. 2015; 99:184–191.
10. Gupta M, Ram J, Jain A, et al. Correlation of nuclear density using the Lens Opacity Classification System III versus Scheimpflug imaging with phacoemulsification parameters. J Cataract Refract Surg. 2013; 39:1818–1823.
11. Savini G, Hoffer KJ, Barboni P, et al. Accuracy of optical biometry combined with Placido disc corneal topography for intraocular lens power calculation. PLoS One. 2017; 12:e0172634.
12. Olsen T. Calculation of intraocular lens power: a review. Acta Ophthalmol Scand. 2007; 85:472–485.
13. Ueda T, Ikeda H, Ota T, et al. Relationship between postoperative refractive outcomes and cataract density: multiple regression analysis. J Cataract Refract Surg. 2010; 36:806–809.
14. Ueda T, Taketani F, Ota T, Hara Y. Impact of nuclear cataract density on postoperative refractive outcome: IOL Master versus ultrasound. Ophthalmologica. 2007; 221:384–387.
15. McAlinden C, Wang Q, Gao R, et al. Axial length measurement failure rates with biometers using swept-source optical coherence tomography compared to partial-coherence interferometry and optical low-coherence interferometry. Am J Ophthalmol. 2017; 173:64–69.
16. Drexler W, Findl O, Menapace R, et al. Partial coherence interferometry: a novel approach to biometry in cataract surgery. Am J Ophthalmol. 1998; 126:524–534.
17. Unterhuber A, Povazay B, Hermann B, et al. In vivo retinal optical coherence tomography at 1040 nm - enhanced penetration into the choroid. Opt Express. 2005; 13:3252–3258.
18. Norrby S. Sources of error in intraocular lens power calculation. J Cataract Refract Surg. 2008; 34:368–376.
19. Olsen T, Thorwest M. Calibration of axial length measurements with the Zeiss IOL Master. J Cataract Refract Surg. 2005; 31:1345–1350.
 XML Download