

 PDF
PDF ePub
ePub Citation
 Print
Print


INTRODUCTION
Sodium-glucose co-transporter 2 (SGLT2) inhibitors are a new class of anti-diabetic agents that improve glycemic control, and reduce body weight and blood pressure, as a monotherapy or in combination with other diabetes medication. Recent studies have shown that SGLT2 inhibitors reduce the risk of cardiovascular-related death and heart failure (HF) hospitalization in patients with type 2 diabetes.1) It has been proposed that SGLT2 inhibitors have several direct or indirect effects that prevent the progression of HF. Increased osmotic diuresis, reduced sympathetic tone, and whole-body metabolic shift from glucose to fat oxidation caused by SGLT2 inhibition might explain the cardiovascular benefits, in addition to its blood glucose-lowering effects.2)
Patients with type 2 diabetes have shown elevated serum ketone body levels after SGLT2 inhibitor treatment.3) SGLT2 inhibition promotes ketone utilization as an energy source in the heart and this shift might provide an energy advantage to the failing heart.4) The ketone body beta hydroxybutyrate (βOHB) is one of major metabolites (acetoacetate, acetone, and βOHB) from liver by fatty acid oxidation.5) βOHB increases cardiac work efficiency and shows protective effects by reduces oxidative stress in several animal studies.6)7)
Interestingly, SGLT2 inhibitors also increase glycosuria and reduce body weight in non-diabetic subjects, and these subjects without diabetes also showed elevated serum ketone body levels.8)9) Therefore, we postulated that SGLT2 inhibitors would have beneficial effects on non-diabetic patients with congestive HF.
To test this hypothesis, we constructed a HF model in mice using doxorubicin (Dox). Dox is an effective anti-tumor drug that is widely used to inducing HF in animal studies.10) Dox-induced cardiotoxicity is characterized by left ventricular dysfunction and cardiac hypertrophy, which lead to congestive HF. We fed a normal chow diet (NCD) containing an SGLT2 inhibitor, empagliflozin (EMPA), to Dox-treated mice and examined their cardiac function, and their molecular and histological phenotypes.
METHODS
Chemicals and reagents
Dox hydrochloride (D1515), phloridzin dihydrate (P3449), and βOHB (54920) were obtained from Sigma-Aldrich (St. Louis, MO, USA). EMPA (Boehringer Ingelheim, Ingelheim am Rhein, Germany) is a potent SGLT2 inhibitor. We made the EMPA diet by mixing EMPA in NCD (Harlan Teklad, Madison, WI, USA) at a concentration 300 mg/kg of diet.
Animals
Male C57BL/6J (B6J) mice were purchased from the Institute of Medical Science, University of Tokyo. The mice were housed at ambient temperature (22±1°C) in a specific pathogen-free facility under a 12 hours light-dark cycle. All diets and water were provided ad libitum. The serum βOHB levels of mice were measured using a βOHB Colorimetric Assay kit (Cayman Chemical, Ann Arbor, MI, USA) according to the manufacturer's protocol. All experiments were performed in accordance with relevant guidelines and regulations. Our animal protocol was designed to minimize pain and discomfort to the mice. For euthanasia, mice were continuously exposed to isoflurane during tissue sampling. All animal procedures were approved by the Institutional Animal Care and Use Committee of CHA University (IACUC No. 160033, 170047). Our study did not involve human data or tissue.
Dox-induced cardiomyopathy experiment
We constructed acute cardiomyopathy and chronic cardiomyopathy mouse models as previously described.11) Male B6J mice (8-weeks-old, weighting 22–24 g) were randomly divided into 4 groups. Control group: B6J mice (n=5) were fed an NCD with phosphate-buffered saline (PBS) injection. EMPA group: B6J mice (n=5) were fed the EMPA diet with PBS injection. Dox group: B6J mice (n=5) were fed an NCD with Dox injection. Dox+EMPA group: B6J mice (n=5) were fed the EMPA diet with Dox injection. Acute cardiomyopathy was induced in the B6J mice by a single intraperitoneal (IP) injection of Dox (15 mg/kg). Diets were changed at night, 12 hours before PBS/Dox injection. To analyze the phenotype of these mice, all mice were sacrificed 2 weeks later. Chronic cardiomyopathy was induced by administering Dox at 2.5 mg/kg every other day for 12 days (cumulative dose=15 mg/kg). All mice were sacrificed 6 weeks later.
Mouse magnetic resonance imaging
Cardiac magnetic resonance imaging (MRI) was performed to assess the structural and functional changes in mice hearts by Dox-induced cardiotoxicity. Male B6J mice (10-weeks-old, n=5 per each group) were examined using a Mouse Agilent 9.4 Tesla MRI Scanner (Agilent Technologies, Santa Clara, CA, USA). Heart sizes were measured using Image J software and functional parameters were calculated as previously described.12)
Cell culture and materials
H9C2 cells (rat cardiac myoblasts) were purchased from the Korean Cell Line Bank (21446) and maintained in high glucose Dulbecco's modified Eagle's medium supplemented with 10% fetal bovine serum and 100 U penicillin/streptomycin. Cells were treated with various concentration of Dox (ranging from 0.1 to 10 µM) and tested after 12 hours or 24 hours. Dox and Phloridzin dihydrate were dissolved in dimethyl sulfoxide (DMSO). DMSO was used as a control vehicle.
Cytotoxicity assay and adenosine triphosphate assay
The cytotoxic effects of Dox and protective effects of other drugs in vitro on H9C2 cells were measured as previously described.13) The viability of H9C2 cells were analyzed using a 3-(4,5-dimethylthiazol-2-yl)-2,5-diphenyltetrazolium bromide based colorimetric assay using a Cell Proliferation Kit I (Sigma-Aldrich). Adenosine triphosphate (ATP) was measured using ATPLite Luminescence Assay System (PerkinElmer, Waltham, MA, USA).
Determination of mitochondrial membrane potential and reactive oxygen species
Mitochondrial membrane potential (MPP) and reactive oxygen species (ROS) were measured as previously described.14) To measure the MPP and ROS, H9C2 cells were preincubated βOHB for 2 hours, and then with Dox for 12 hours in serum free media. For mitochondrial analysis, H9C2 cells were incubated for 30 minutes with 50 nM tetramethylrhodamine methyl ester (TMRM; Sigma-Aldrich). TMRM fluorescence images were obtained using confocal microscopy (Leica TCS SP5 II). Intracellular ROS were measured using 2′,7′-dichlorodihydrofluorescein diacetate (H2DCFDA) (Thermo Fisher Scientific, Waltham, MA, USA).
RNA isolation and quantitative real-time reverse transcription polymerase chain reaction
Total RNA was extracted using the TRIzol® reagent (Invitrogen, Carlsbad, CA, USA) according to the manufacturer's protocol. For complementary DNA synthesis, total RNA (1µg) was reverse transcribed with the Qiagen Quantitect Reverse Transcription Kit (Qiagen, Hilden, Germany) according to the manufacturer's protocols. Quantitative real-time polymerase chain reaction (PCR) was performed using a FastStart Essential DNA Green Master kit (Roche Life Sciences, Indianapolis, IN, USA). The primer sequences are provided in Supplementary Table 1.
Western blot analysis
Heart tissue lysates and whole-cell lysates were used for western blotting analysis. Proteins were separated by electrophoresis and transferred to membranes. The membranes were incubated with specific primary antibodies (1:1,000) recognizing β-actin (#4970), cleaved-caspase 3 (#9664), and C/EBP homologous protein (CHOP; #5554), purchased from Cell Signaling Technology (Danvers, MA, USA). The membranes were washed with Tris-buffered saline containing 0.05% Tween 20 and incubated with horseradish peroxidase-linked anti-rabbit immunoglobulin G (IgG) antibody (1:2,000; AP188p) or anti-mouse IgG antibody (1:2,000; AP160P) from Sigma-Aldrich. Signals were captured using a ChemiDoc MP system (Bio-Rad, Hercules, CA, USA). Densitometric analysis was performed using Image J software.
Histological analysis
Mouse hearts were harvested, fixed in 4% paraformaldehyde in PBS, dehydrated, and embedded in paraffin. Then, 5-µm-thick tissue sections were deparaffinized and stained with hematoxylin and eosin (H&E). Fibrosis was detected with Masson's trichrome staining (Abcam, Cambridge, UK) according to the manufacturer's protocol.
RESULTS
An sodium-glucose co-transporter 2 inhibitor attenuates Dox-induced cardiomyopathy in mice
To test our hypothesis that EMPA might improve cardiac function in HF, we induced cardiac toxicity in mice by Dox administration and then fed them with an EMPA diet. We divided these mice into 4 groups: control group, EMPA group, Dox group, and Dox+EMPA group. Two weeks after Dox/vehicle injection, the left ventricles (LVs) of the mice in these 4 groups were examined to analyze the effects of EMPA on mouse hearts. To evaluate whether EMPA protects against Dox-induced cardiomyopathy, functional analysis was performed by heart MRI. In the acute stage, Dox causes cardiac hypertrophy in mice.15) The Dox+EMPA group showed body weight reduction after 2 weeks treatment but this change was not significant (Supplementary Figure 1). After 2 weeks of Dox treatment, mouse hearts showed hypertrophic changes (Figure 1A and B). As expected, EMPA reduced these pathological changes. The Dox+EMPA group displayed significantly reduced LV mass and improved fractional shortening compared with the Dox group (Figure 1B and C, Supplementary Figure 2). Masson's trichrome staining revealed that EMPA reduced perivascular and interstitial fibrosis in mouse hearts treated with Dox (Figure 1D-F and Supplementary Figure 3). These results suggested that the SGLT2 inhibitor protects against Dox-induced cardiac toxicity in vivo.
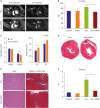 | Figure 1The SGLT2 inhibitor protects against Dox-induced cardiac toxicity. (A) Representative images of Dox-mediated changes in cardiac structure and function from cardiac MRI. (B) and (C) The Dox+EMPA group showed reduced LV mass, decreased LVESD, and improved FS compared with the Dox group. (D) Masson's trichrome stained cross-sections of mice, 2 weeks after single Dox injection. (E) Representative images of LV sections stained with H&E and with Masson's trichrome. The Dox+EMPA group showed less myocardial damage. (F) Quantification of interstitial fibrosis. Scale bar=50 μm. Each bar represents mean±standard error of mean.Dox = doxorubicin; EF = ejection fraction; EMPA = empagliflozin; FS = fractional shortening; H&E = hematoxylin and eosin; LV = left ventricle; LVEDD = left ventricular end diastolic diameter; LVESD = left ventricular end systolic diameter; MRI = magnetic resonance imaging; SGLT2 = sodium-glucose co-transporter 2.
*p<0.05.
|
Beta hydroxybutyrate protects against Dox-induced cardiotoxicity in vitro
We observed that an SGLT2 inhibitor has protective effects against Dox-induced cardiac injury in vivo. However, the exact mechanism underlying the cardio-protective effect of SGLT2 inhibitors is still unclear. The SGLTs are present in heart. However, the major SGLT is SGLT1, not SGLT2.16)
We checked the expression of Sglt genes in the mouse heart. As expected, Sglt1 is expressed in both the kidney and LV. However, Sglt2 gene expression was very low in the LV compared with its expression in the kidney (Figure 2A and B). To investigate the direct effect of SGLT in the heart, we treated H9C2 cells with phloridzin (PHL), a non-selective SGLT inhibitor. After 2 hours of pretreatment with PHL, H9C2 cells were incubated with Dox for 24 hours. As shown in Figure 2C and D, cell viability was significantly reduced after Dox treatment and PHL pretreatment did not show a protective effect on Dox-induced cytotoxicity. These results suggested that SGLT has no direct role in cardiomyocytes during Dox-induced cardiotoxicity.
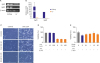 | Figure 2The SGLT inhibitor protects cardiomyocytes by increasing βOHB. (A) and (B) Sglt1 and Sglt2 mRNA expression in mouse LV and kidney by qRT-PCR. (C) Representative light microscopic images of H9C2 cells. H9C2 cells were stimulated with 5 μM Dox or pre-treated with PHL or βOHB for 2 hours and then treated with 5 μM Dox for 24 hours. (D) H9C2 cell viability of the PHL pre-treatment group by an MTT assay. (E) H9C2 cell viability of the βOHB pre-treatment group by an MTT assay. βOHB group showed improved cell viability under 1 μM Dox-induced cardiotoxicity compared to non-treated group. Scale bar=50 μm. Each bar represents mean±standard error of mean.βOHB = beta hydroxybutyrate; Dox = doxorubicin; LV = left ventricle; mRNA = messenger RNA; MTT = 3-(4,5-dimethylthiazol-2-yl)-2,5-diphenyltetrazolium bromide; PHL = phloridzin; qRT-PCR = quantitative real-time reverse transcription polymerase chain reaction; SGLT = sodium-glucose co-transporter.
*p<0.05 vs. Dox-treated group.
|
We focused on βOHB, a ketone body that is increased in the blood after SGLT2 inhibition, even in non-diabetic conditions.9)17)18) First, we treated H9C2 with βOHB at various concentrations (100 μM, 1 mM, 10 mM, and 30 mM) according to previous studies.18)19) As shown in Figure 2C and E, βOHB pretreatment had significant protective effects against Dox-induced cardiotoxicity.
Beta hydroxybutyrate reduces reactive oxygen species and improves mitochondrial function
Increased free radical production is the major mechanism of Dox-induced cardiac injury.20) Therefore, we measured intracellular ROS generation in H9C2 cells using H2DCFDA. H9C2 cells produced ROS after the addition of 5 μM Dox. However, when H9C2 cells were pretreated for 2 hours with βOHB, Dox-induced ROS production was significantly decreased (Figure 3A and B, Supplementary Figure 4). We then performed a western blotting assay to detect cell stress markers. We found that the levels of both cleaved caspase 3 and CHOP were increased after Dox treatment. In contrast, βOHB pretreatment suppressed the levels of these proteins (Figure 3C and D).
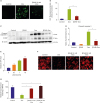 | Figure 3βOHB reduces ROS and improves mitochondrial function. (A) Representative confocal fluorescence images of H9C2 cells after Dox treatment. Higher level of ROS was detected by H2DCFDA staining (green fluorescence). (B) Quantification of intracellular ROS levels. βOHB reduced ROS of H9C2 cells with Dox. (C) Representative images of western blotting of cleaved caspase 3 and CHOP. (D) Densitometry analysis of immunoreactive bands of cleaved caspase 3. βOHB reduced cleaved caspase 3 expression of H9C2 cells with Dox. (E) Intracellular ATP was measured using a firefly-based ATP assay kit. Calculated ATP contents were normalized to the total protein content. Data are shown relative to ATP levels of the control (non-treated H9C2 cells). βOHB (1mM) increased ATP production compared to control. (F) Representative confocal fluorescence images of H9C2 cells stained with TMRM fluorescence probe (red fluorescence). (G) Quantification of TMRM fluorescence. βOHB restored TMRM intensity of H9C2 cells with Dox. Scale bar=50 μm. Each bar represents mean±standard error of mean.ATP = adenosine triphosphate; βOHB = beta hydroxybutyrate; CHOP = C/EBP homologous protein; DCF = 2′,7′-dichlorofluorescin; Dox = doxorubicin; H2DCFDA = 2′,7′-dichlorodihydrofluorescein diacetate; ROS = reactive oxygen species; TMRM = tetramethylrhodamine methyl ester.
*p<0.05; †p<0.01.
|
Dox treatment also induces mitochondrial dysfunction in cardiomyocytes.21) So, we measured the ATP levels after βOHB treatment. As expected, βOHB significantly increased intracellular ATP levels in H9C2 cells (Figure 3E). We then analyzed the MPP of Dox-treated H9C2 cells using TMRM fluorescent probe. Dox-treated H9C2 cells showed decreased uptake of TMRM. βOHB pretreatment restored the uptake of TMRM in H9C2 cells. These results suggested that βOHB protects cardiomyocytes from Dox-induced mitochondrial dysfunction (Figure 3F and G).
An sodium-glucose co-transporter 2 inhibitor protects the heart by increasing beta hydroxybutyrate levels
Collectively, these in vitro results suggested that the cardio-protective effects of SGLT2 inhibition depend on elevated serum βOHB. We measured serum βOHB levels of our 4 groups of mice after 2 weeks of treatment. As expected, the βOHB level was elevated in EMPA diet-fed groups (EMPA and Dox+EMPA) (Figure 4A). We then examined whether the EMPA diet reduced Dox-induced ROS generation in the mouse heart in vivo. We analyzed antioxidant gene expression in the LVs from the 4 groups of mice. In the qPCR analysis, the Dox treated LVs showed reduced anti-oxidative gene expression and the EMPA diet restored this suppression induced by Dox treatment (Figure 4B).
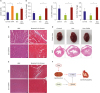 | Figure 4The SGLT2 inhibitor protects the heart by increasing βOHB. (A) Serum βOHB levels of mice, 2 weeks after single Dox (15 mg/kg) or saline injection. EMPA increased Serum βOHB levels of mice in both Control and Dox treated mice. (B) mRNA expression of FoxO3a, Sod2, and Cat (encoding catalase) in LV tissues of mice after single Dox or saline injection. EMPA increased these genes expression in LV tissues of mice with Dox. (C) Representative images of LV sections stained with H&E and with Masson's trichrome. Mice were injected daily with βOHB intraperitoneally after single Dox injection for 14 days. (D) Gross anatomical changes of Dox-treated hearts in a chronic model. (E) Representative images of LV sections stained with H&E and with Masson's trichrome. (F) A proposed model for the cardioprotective effect of the SGLT2 inhibitor against Dox-induced HF. Heart image was obtained and modified from Pixabay 2017 (https://pixabay.com/en/heart-human-heart-anatomy-medicine-2028154). Scale bar=50 μm. Each bar represents mean±standard error of mean.βOHB = beta hydroxybutyrate; Dox = doxorubicin; EMPA = empagliflozin; H&E = hematoxylin and eosin; HF = heart failure; LV = left ventricle; mRNA = messenger RNA; ROS = reactive oxygen species; SGLT2 = sodium-glucose co-transporter 2.
*p<0.05.
|
We then investigated whether βOHB could reduce Dox-induced cardiomyopathy in vivo. After a single IP injection of Dox (15 mg/kg), mice were injected with saline or βOHB (20 mmoL/kg), according to a previously described method.22) After 2 weeks of IP injection, mice were sacrificed, histological analysis showed preserved myofibril structure and reduced cardiac fibrosis in the LVs of mice treated with Dox+ βOHB compared with that in the LVs of mice treated with Dox (Figure 4C and Supplementary Figure 5).
In addition, we investigated whether EMPA could inhibit Dox-induced chronic structural changes, such as eccentric hypertrophy in the heart. We fed the EMPA diet to Dox-treated mice and sacrificed them 6 weeks after the last injection, as previously described.23) After 6 weeks of Dox injection, the hearts of Dox treated mice showed dilated cardiomyopathy (increased size and eccentric hypertrophy) (Figure 4D). The hearts of the EMPA diet-fed mice retained a similar size and structure to those of the control mice. Histological analysis also showed preserved myofibril structure and reduced cardiac fibrosis in the LVs of mice fed with Dox+EMPA compared with those of mice fed with Dox (Figure 4E). Collectively, these results suggested that elevation βOHB by SGLT2 inhibition attenuated the oxidative stress induced by Dox treatment in mice.
DISCUSSION
SGLT2 inhibitors have shown beneficial effects on HF patients with type 2 diabetes.24) Our study was designed to investigate the role of SGLT2 inhibitors in the development of Dox-induced HF in mice, which is a well-known non-diabetic HF animal model. We demonstrated that the SGLT2 inhibitor attenuated Dox-induced cardiomyopathy in mice. Dox-treated mouse hearts showed cardiac hypertrophy and myocardial fibrosis, and the EMPA diet-fed mice showed reduced Dox-induced cardiomyopathy in acute (Figure 1D and E) and chronic models (Figure 4D and E).
EMPA-fed mice showed increased serum βOHB levels compared with NCD-fed mice (Figure 4A). These changes in non-diabetic mice after EMPA treatment are consistent with recent clinical data from humans.9) As expected, βOHB improved cell viability (Figure 2C) and reduced ROS generation (Figure 3A) in Dox-treated H9C2 cells. Recent study supported these results about anti-oxidant properties of βOHB.25) βOHB also improves mitochondrial function and increases ATP production in pancreatic beta cells and neuronal cells.26)27) In line with these findings, we found that βOHB increased intracellular ATP levels and restored mitochondrial dysfunction in cardiomyocytes (Figure 3E and F).
Several studies support our findings about the cardioprotective role of βOHB. Ketone bodies are effective energy source of failing heart and increase survival in aging mice.26)28) Exogenous βOHB infusion protects ischemic injury in heart by reducing ROS and enhancing adenosine trisphosphate production.29) These findings led us to speculate that ketone bodies have critical role in maintaining heart function and SGLT2 inhibitor acts indirectly on the heart by increasing blood βOHB levels.
We found that βOHB attenuated Dox-induced cardiotoxicity in vitro. However, in vivo, βOHB supplementation reduced Dox-induced myofibrillar loss and cardiac fibrosis at the microscopic level (Figure 4C) but did not demonstrate significant improvement in the gross morphological changes caused by Dox (Supplementary Figure 6). These results suggested that metabolic and hemodynamic effects of SGLT2 inhibitors, such as improved glucose homeostasis, lowering of blood pressure and weight loss, also have additional protective effects on heart function.2)
In summary, our study showed that an SGLT2 inhibitor could reduce Dox-mediated LV dysfunction. This protective effect is mediated by elevated βOHB levels. During SGLT2 inhibition, elevated βOHB levels attenuated ROS production and improved mitochondrial dysfunction in cardiomyocytes (Figure 4F). Our findings suggested that cardioprotective role of SGLT2 inhibitor indicates a new strategy to prevent HF in patients receiving Dox.
 XML Download