

 PDF
PDF ePub
ePub Citation
 Print
Print


INTRODUCTION
In 2016, The Korean Society of Cardiology (KSC) and Korean Society of Interventional Cardiology (KSIC) established the Korean percutaneous coronary intervention (K-PCI) registry. Total 92 voluntarily participating centers provided demographic and procedural information, and in-hospital outcomes of 44,967 PCI cases performed in 2014. The reports, published in 2017, described clinical characteristics, practices of PCI in Korea and demonstrated Korean PCI practice pattern (KP3).1)2) As KSC and KSIC also agreed to collect and report PCI data biennially, new database of PCI in 2016 was added to K-PCI registry of 2014.
In this second report from K-PCI registry, we sought to describe the updated information of PCI practices in Korea and to compare them with those of 2014.
METHODS
Participation and data collection
Details of the K-PCI registry including participating centers and variables were described in the previous report.1) New cohort consists of PCI data from the participating hospitals from January 1, 2016, through December 31, 2016. The updated case report form (CRF) was used for the database of 2016 (K-PCI registry 2016 CRF v2.2, Supplementary Data 1). In the updated CRF, ST-elevation myocardial infarction (STEMI) metrics including door-to-balloon time (DTBT) were added. Regarding myocardial infarction (MI), periprocedural MI was not considered as a clinical event and only clinical MI was included in the in-hospital outcomes. Major adverse cardiovascular events (MACE) was defined as the composite of death, MI and repeat PCI. Major adverse cardiac and cerebrovascular events (MACCE) was the composite of MACE and stroke. This study was approved by the local Institutional Review Board (IRB) at each 92 participating centers (IRB No. 4-2017-0790). The written consent document was waived in participating centers, because of the retrospective nature of the study without clinical follow-ups. Data were collected using a web-based reporting system.
The K-PCI registry committee centrally managed the web-based registered study data. After the K-PCI registry was approved by the IRBs, demographic and procedural information, as well as in-hospital outcomes, of PCI in 2016 at 92 PCI centers was added to the database of 2014.
Korean percutaneous coronary intervention practice pattern
Distribution of KP3 was determined in K-PCI year 2016 cohort. Details of KP3 algorithm were reported previously.2) Briefly, there were 9 scenarios for PCI in patients with acute coronary syndrome (ACS) determined by presence of ST-segment elevation, times from symptom onset, presence of unstable features, coronary artery disease extent, use of fibrinolysis and presence of cariogenic shock. The 38 scenarios for PCI in non-ACS patients determined by severity of ischemic symptoms, use of anti-ischemic medical therapy, results of noninvasive or invasive supportive tests, prior history of bypass surgery, and extent of coronary disease.
KP3 class A was defined as the strategy evidenced by many randomized trials and/or more conservative for PCI rather than medical therapy or coronary artery bypass surgery. KP3 class C was defined as the strategy less evidenced by randomized trials and/or more aggressive for PCI compared to medical therapy or bypass-surgery. Class B was defined at the strategy where it is intermediate between class A and C.
Statistical analysis
Discrete data were presented as numbers and percentages and compared using χ2 tests or Fisher's exact test as appropriate. Continuous variables were presented as mean ± standard deviation or medians with interquartile ranges (IQRs), and were compared using the Student's t-test or Wilcoxon rank-sum test, respectively. All p-values were 2-tailed. All analyses were conducted using R version 3.5.1 (R Foundation for Statistical Computing, Vienna, Austria) and IBM SPSS statistics 23.0 (IBM Corp., Armonk, NY, USA).
To help to assess clinical significances, Cohen's d, the standardized mean-difference, was calculated as an effect size.3)4) Due to the large study population, small differences of 0.4 year in age and 0.2% in cardiac arrest (2.3% vs. 2.5%) had p-values less than 0.02. Therefore, we calculated effect sizes and used it another tool to consider clinical significances.5)6)7) Usually, the effect size is interpreted as small if d=0.2; medium if d=0.5; large if d=0.8.3) We interpreted a comparison result as significant if a p value<0.05 and Cohen's d>0.2.5)
RESULTS
Study population
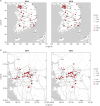
Although there were some changes in participating hospitals, the number of centers joining the K-PCI registry of 2016 was the same to that of 2014. About half (51.1%) of the PCI centers were located in the capital area (Figure 1; Supplementary Table 1). Total 48,823 PCI procedures were performed in 2016, increased by 8.7% when compared to 2014.
Figure 1
Geographic distribution of PCI centers participating in the K-PCI registry.
K-PCI = Korean percutaneous coronary intervention; PCI = percutaneous coronary intervention.
As the number of total PCI cases increased, centers with a PCI volume of 500 or more increased from 38.0% in 2014 to 45.7% in 2016. However, the overall distribution of PCI volume was similar to that of 2014 (Figure 2).
Clinical characteristics and presentation
Baseline demographic and clinical characteristics of the patients are presented in Table 1. The results were quite similar to those in 2014. The mean age of patients was 65.7±11.6 years, and 71.7% were males. Among patients undergoing PCI, 59.2% had hypertension, 35.8% had diabetes mellitus, 9.2% had history of prior MI, 23% had history of PCI, 1.3% had prior coronary artery bypass surgery, 6.6% had renal failure, 8.4% had prior history of cerebrovascular disease, and 2.3% had peripheral vascular disease. Among diabetic patients, the proportion under pharmacologic treatments increased (89.6%→93.2%, d=−0.25), mainly with oral hypoglycemic agents (79.7%→85.4%, d=−0.18).
Table 1
Baseline and clinical characteristics of the patients
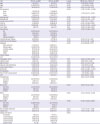
ACS = acute coronary syndrome; CABG = coronary artery bypass surgery; CAD = coronary artery disease; CI = confidence interval; CKD = chronic kidney disease; CTA = computed tomography angiography; CTO = chronic total occlusion; DM = diabetes mellitus; ESRD = end-stage renal disease; LVEF = left ventricle ejection fraction; MI = myocardial infarction; MRI = magnetic resonance imaging; NSTEMI = non-ST-elevation myocardial infarction; PCI = percutaneous coronary intervention; SPECT = single-photon emission computed tomography; STEMI = ST-elevation myocardial infarction.
ACS was 72% of the initial presentations, which is a composite of unstable angina 33.8%, non-STEMI (NSTEMI) 20.9% and STEMI 17.3%. Stable angina and silent ischemia were 23.9% and 4.1%, respectively.
The prescription pattern of antianginal medications was similar to that of 2014 cohort while the use of calcium channel blockers slightly increased from 36.5% in 2014 to 45.0% in 2016. Beta-blockers was the antianginal drug prescribed the most (53.2%), then calcium channel blockers, nicorandil (22.2%), trimetazidine (18.6%) and nitrates (17.1%) followed.
Non-invasive test and imaging studies
Only in 70.3% of the patients, left ventricular function was evaluated before PCI. The mean left ventricular ejection fraction was 56.5%.
From the total number of patients undergoing PCI, only 11.1% (7.8% in ACS patients, 19.4% in non-ACS patients) underwent non-invasive stress tests before PCI (Table 1). The treadmill test was performed most frequently (7.4%), then single-photon emission computed tomography (CT) (3.1%) and stress echocardiography (1.4%) followed.
Coronary CT angiography was performed in 11.1% (8.0% in ACS, 19.1% in non-ACS) of the patients, and 46.2% had an 1-vessel disease.
Procedural characteristics
Angiographic and procedural characteristics for each PCI procedure are presented in Table 2. Patients with single vessel involvement were 46.8%. The most frequently involved vessel was left anterior descending coronary artery (LAD, 73.0%), followed by the right coronary artery (RCA, 51.9%), left circumflex artery (LCX, 46.7%), and left main coronary artery (6.6%). LAD lesions were most likely to be treated (80.6%), followed by left main (69.9%), RCA (68.6%), and LCX (59.1%).
Table 2
angiographic and procedural characteristics
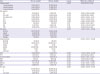
BMS = bare metal stent; CI = confidence interval; CTO = chronic total occlusion; DEB = drug-eluting balloon; DES = drug-eluting stent; FFR = fractional flow reserve; ISR = in-stent restenosis; IVUS = intravascular ultrasound; LAD = left anterior descending coronary artery; LCX = left circumflex artery; LM = left main; PCI = percutaneous coronary intervention; RCA = right coronary artery.
Among patients that underwent PCI, a chronic total occlusion (CTO) lesion was present in 11.2% and an in-stent restenosis lesion was present in 7.3%. PCI for graft vessels was 0.2% of all procedures. Two-thirds of the PCI procedures were performed as elective cases.
Trans-radial approach was still the most used access (58.6%). Even in ACS patients, more than half (55.8%) of procedures were performed via the trans-radial approach. For STEMI, trans-radial approach was used in 35.8% of the patients (Supplementary Figure 1).
Mechanical support devices were used in 1.4% of all PCI procedures (1.8% of ACS, 0.4% of stable disease; intra-aortic balloon pump 0.9%, emergency bypass system 0.6%).
Data on the use of PCI devices was also collected. Drug-eluting stents (DES) were implanted for 90% of the patients, plain old balloon angioplasty without stent implantation was done in 14.9%, and drug-eluting balloon was used in 5.7% of patients. A bare-metal stent was placed in 1.6% of all patients. During the procedures, intravascular ultrasound (IVUS) was used in 27.5% of patients (25.6% in patients with ACS, 32.3% in patients with stable disease) and fractional flow reserve (FFR) was measured in 4.1% of the patients (2.5% in ACS patients, 8.2% in non-ACS patients). Functional tests including FFR and non-invasive stress tests were performed in 14.5% (10% in ACS patients, 26.1% in non-ACS patients).
Clinical outcomes during hospitalization
Patient clinical outcomes during hospitalization are summarized in Table 3. During the admission for PCI, all-cause mortality rate was 2.4% (0.5% in patients with stable disease and 3.1% in patients with ACS), which was similar to the mortality of 2.3% in 2014. Cardiac deaths constituted 75% of all-cause deaths (1.8%). Non-fatal MI occurred in 0.7%, only half of the rate in 2014. Reduction of MI mainly contributed to the decreases in MACE and MACCE. The event rates of the other clinical outcomes were similar to those of 2014 (Table 3). In-hospital outcomes according to the diagnosis at the time of PCI are presented in Supplementary Data 2.
Table 3
In-hospital outcomes
Practice patterns and results by the percutaneous coronary intervention volumes
Supplementary Data 3 shows baseline demographic and procedural characteristics, clinical outcomes according to the PCI volumes. In contrast to the results of 2014, it was hard to find significant associations between PCI volumes and risk factors of hypertension, dyslipidemia, renal failure and peripheral vascular disease. Frequencies of non-invasive stress test, radial approach and IVUS use were not related to PCI volumes, either.
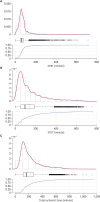
ST-elevation myocardial infarction quality metrics
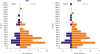
For STEMI, PCI was performed as an emergency setting in 90.2%. Figure 3 shows the distributions of DTBT, symptom to door time (STDT) and total ischemic time in STEMI patients. The median time (50th percentile) from hospital arrival to PCI (DTBT) was 62 minutes (IQR, 47–82). The proportions of DTBT within 90 and 60 minutes were 83.3% and 47.8%, respectively. The median of STDT was 94 minutes (IQR, 52–185). The proportion of STDT within 120 minutes was 61.2%. Total ischemic time, which was defined as the sum of STDT and DTBT, had the median of 168 minutes (IQR, 115–270). Patients who had total ischemic time within 120 and 180 minutes were 29.1% and 54.1%, respectively.
Korean percutaneous coronary intervention practice pattern (Korean practice pattern of percutaneous coronary intervention)
For KP3, 370 patients were excluded due to insufficient data, and 48,453 patients were included in the analysis. KP3 class A was noted in 66.7% of patients, class B in 29.9%, and class C in 3.4% of cases (Table 4, Figure 4). The distributions of KP3 classes were significantly different according to demographic, clinical presentation, co-morbidities, use of noninvasive stress test, anti-anginal medication, and angiographic variables (Table 4). Among clinical diagnoses, class C was more frequent in silent ischemia than stable angina or ACS. Class C was more common in patients with no or mild symptom than those with severe symptom. Class C was more common in patients without antianginal medications, positive noninvasive stress test results than patients who with antianginal medication or positive noninvasive stress test.
Table 4
Distribution of KP3 class
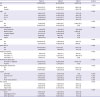
ACS = acute coronary syndrome; CCS = Canadian Cardiovascular Society; CTO = chronic total occlusion; DM = diabetes mellitus; KP3 = Korean practice pattern of percutaneous coronary intervention; MACE = major adverse cardiovascular events; MACCE = major adverse cardiac and cerebrovascular events; NSTEMI = non-ST-elevation myocardial infarction; LAD = left anterior descending coronary artery; MI = myocardial infarction; PCI = percutaneous coronary intervention; STEMI = ST-elevation myocardial infarction.
Figure 4
KP3. (A) The proportion of class C by hospitals, (B) Relationship between the proportion of class C in the hospital and the number of PCIs performed in the hospital (left) and the proportion of ACS cases in the hospital (right). (C) Changes of the distribution of KP3 class in non-ACS patients from 2014 to 2016.
ACS = acute coronary syndrome; KP3 = Korean percutaneous coronary intervention practice pattern; PCI = percutaneous coronary intervention.
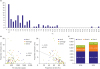
The median proportion of class C cases in all hospitals was 2.5% (IQR, 0.6–4.5%) (Figure 4A). A greater than 15% proportion of class C cases was noted only in 2 centers, while a proportion less than 1% was noted in 24 centers. The proportion of class C cases was more common and less variable setting in the hospital in Seoul and Gyeonggi province (which is the nearest province to Seoul, Supplementary Figure 2)
The proportion of class C cases was not dependent on the number of PCIs performed per hospital (r=−0.05, p=0.961, Figure 4B). The initial diagnosis of ACS was significantly associated with the proportion of class C cases found in a given hospital (r=−0.435, p<0.001, Figure 4B).
In-hospital clinical outcomes were different by KP3 classes (Supplementary Table 2). In ACS patients, in-hospital death and adverse events were more frequent in class A than class B. However, in non-ACS patients in-hospital death and cardiac death were significantly lower in class A than class B or class C.
In whole population, proportion of class C was 3.4% of patients including 1,660 cases in 2016 cohort, which was 3.5% (1,578 cases) in 2014 cohort (Figure 4C). Distribution of KP3 class in non-ACS patients changed. The proportion of class C cases in non-ACS patients decreased from 13.5% in 2014 to 12.1% in 2016 (p<0.001). However key determinants of proportions of class C by hospitals were similar in 2016 to those in 2014. In-hospital death was different by KP3 class in both ACS and non-ACS patients in 2016 cohort.
DISCUSSION
This is the second report from K-PCI registry, which describes the updated practices of PCI in Korea. Major findings of this report were; 1) the overall PCI practices in 2016 were similar to that in 2014; 2) the biggest change from 2014 to 2016 was the decrease in the in-hospital occurrence of MI (1.6%→0.7%, d=−0.42); 3) although the proportion of diabetic patients remained similar, diabetic patients in 2016 were more likely to be under glycemic control (89.6%→93.2%, d=−0.25), mainly with oral hypoglycemic agents (79.7%→85.4%, d=−0.18); 4) lots of associations between PCI volumes and demographic/procedural characteristics observed in the previous report have disappeared; 5) the median of DTBT was 62 minutes, and 83.3% of STEMI patients received primary PCI within 90 minutes while the median of total ischemic time was 168 minutes and patients who had total ischemic time within 120 and 180 minutes were 29.1% and 54.1%, respectively; 6) KP3 class A was noted in 66.7% of patients, class B in 29.9%, and class C in 3.4% in 2016, which was 67.7%, 28.8%, and 3.5%, respectively, in 2014; 7) the proportion of KP3 class C cases in the hospital was largely dependent on the proportion of ACS cases, and in-hospital mortality was significantly different by KP3 class in both ACS and non-ACS patients.
The overview of PCI practices in 2014 was provided and discussed in the previous report.1) In summary, wide-spread use of DES, relatively high-utility of FFR and IVUS, higher mortality rates were highlighted. Lastly, different patterns of patient characteristics and practices according to the PCI volumes were reported.
In addition, the proportion of trans-radial intervention (TRI) was 56.1% in 2014. It was higher than that of the report from US CathPCI Registry (25.2% of TRI in 2014),8) but lower than 58.6% of UK registry in 2012.9)
Regarding the reduction in in-hospital MI, the cause is unclear yet. The definition of MI was the same for the both registries, in which only clinical MI was included. Compared to 2014, patients in 2016 were less likely to have hypertension, dyslipidemia, family history of coronary artery disease, prior PCI, peripheral artery disease, diagnosis of ACS and multivessel disease. However, the differences were very small and their clinical effect is doubtful. Moreover, they were more likely to be older, and to have lower left ventricular ejection fraction, cardiac arrest, lesions at proximal LAD and CTO although the differences were also very small. In the multivariate logistic regression analysis, the different year was significantly associated with the decrease in MI even after adjusting other clinical and procedural factors (adjusted odds ratio, 0.34; 95% confidence interval, 0.29–0.41; p<0.001; Supplementary Data 4). In many studies, improvement in clinical outcomes after PCI has often been explained by advances of DES technology.10) However, detailed analysis was unfeasible because information of DES types was not available in this registry. We do not have any information or news of important changes in DES from 2014 to 2016, either. Otherwise, the reduction in in-hospital MI could be explained in part, at least, by changes in antiplatelet agents. New P2Y12 antagonists including ticagrelor and prasugrel became available in January 2011 and have been covered by national health insurance since July 2012 in Korea.11) These new agents were prescribed only for 1.2% of patients with acute MI (AMI) from 2010 to 2012. During 2013–2015, the prescription rates of prasugrel and ticagrelor rapidly increased to 10.6% and 29.3%, respectively. These new antiplatelet agents have been reported to reduce mortality and/or MI in patients with ACS especially who are receiving PCI.12)13) This hypothesis seems plausible especially because MI reduction was the biggest in STEMI and NSTEMI patients (Supplementary Data 2). However, detailed analysis was yet to be performed considering limited information for the use of antiplatelet agents in this registry.
We also reported STEMI metrics including DTBT using the K-PCI registry for the first time. In primary PCI for STEMI, the median of DTBT was 62 minutes, a little longer than 59 minutes of NCDR ACTION–GWTG in 2014.8) The proportion of DTBT less than 90 minutes was 83.3% in the K-PCI registry, while NCDR ACTION–GWTG reported it as 93.5% in 2014.8) In US, the proportions have been above 90% since 2011.8)14)
Recently, it is recommended to use first medical contact (FMC) to device time <90 minutes rather than DTBT.15) Because FMC to device time includes prehospital delays, it is longer than DTB and thus the metric is thought more strict than DTBT. In the study, the information of FMC was unavailable. Another important metric is total ischemic time.16) It is recommended to make total ischemic time within 120 minutes17) because the prognosis was better when total ischemic time was less than 2 or 3 hours.18)19)20) In the K-PCI registry, however, patients who had total ischemic time within 120 and 180 minutes were only 29.1% and 54.1%, respectively. Considering the proportion of DTBT less than 90 minutes was 83.3%, nationwide effort to reduce prehospital delay should be emphasized to make total ischemic time shorter.
Regarding KP3, key determinants of KP3 class were mostly variables included in the KP3 algorithm scenarios such as presentation with ACS or not, use of antianginal medications, angina symptom, and use of non-invasive stress tests. The proportion of class C in non-ACS patients decreased significantly from 13.5% in 2014 to 12.1% in 2016 (p<0.001). In-hospital clinical outcomes were significantly different by KP3 class in both ACS and non-ACS patients. In ACS patients, in-hospital death and cardiac death rates were significantly higher in class A than class B. In non-ACS patients, rates of in-hospital death and cardiac death were significantly lower in class A. Although KP3 class was significantly associated with in-hospital outcomes, prognostic implication of KP3 class should be interpreted cautiously in non-ACS patients due to limited supporting data. In K-PCI year 2104 cohort, in-hospital mortality was not significantly different by KP3 class in non-ACS patients. In non-ACS patients, baseline characteristics were different by KP3 classes and class B or class C patients had more co-morbidities and risk factors than class A patients (Supplementary Table 3). The proportion of inappropriate non-acute PCI cases was not associated with in-hospital mortality in previous report from CathPCI registry.21) Also, indication of PCI should be determined based on long-term clinical outcomes rather than in-hospital outcomes. Further studies are required to compare long-term outcome between PCI and other treatment options in the cases of non-class A scenarios form non-ACS patients.
There are several limitations to this study that should be considered. 1) the K-PCI registry is not representative of all Korean PCI procedures. This voluntary registry may include potential selection bias, errors in event adjudication, and potential variations in definition of variables. Considering that total 55,867 PCI procedures were recorded in the database of Health Insurance Review & Assessment Service in 2014,22) procedures registered in the K-PCI registry accounts for 80.5% of all PCI cases in Korea. K-PCI registry-participating centers were 92, constituting 53.2% of total 173 PCI centers in Korea. 2) Only in-hospital events were reported. Direct comparisons between them and 30-day or 1-year clinical outcomes of other studies would be inappropriate. Also, detailed information about medications was not available. 3) Only 2 time-points with a short interval of 2 years would not be enough to capture true trends in practice. Observed differences between 2014 and 2016 in the study could be noises by chance. A longer follow-up is needed to watch the true changes in clinical practice. 4) Regarding AMI metrics, direct comparisons of the K-PCI registry and NCDR ACTION–GWTG would be inappropriate because the K-PCI registry enrolled only patients who had received PCI while ACTION–GWTG did all MI patients regardless of treatment strategies.
In conclusion, in this second report from the K-PCI registry, we described the current practices of PCI and the changes from 2014 to 2016 in Korea. In addition, STEMI metrics including DTBT were reported using the K-PCI registry for the first time. We expect series of reports from the K-PCI registry could present the contemporary PCI practices and changes, and the database framework would facilitate active clinical research.
 XML Download