

 PDF
PDF ePub
ePub Citation
 Print
Print


INTRODUCTION
Airway epithelium plays a critical role in forming a physical barrier, which protects the submucosal tissues from harmful substances inhaled. This barrier function is primarily determined by the integrity of intercellular junctions, which consist of the apical tight junctions (TJs) and underlying adherent junctions (AJs). TJs and AJs establish cell-cell contact and cell polarity, and regulate the paracellular movement of ions and macromolecules.1 Recent studies have documented that TJ function is defective or altered in multiple airway diseases such as chronic rhinosinusitis,2 allergic rhinitis,3 chronic obstructive pulmonary disease4 and asthma.5
Epidemiological studies678 suggest that exposure to escalating environmental particulate matter (PM) is associated with an increase in respiratory tract diseases, with 1 recent study indicating that airborne PM may directly cause airway epithelial cell injury.9 Dysfunctional epithelial barrier may enhance uptake or exposure of deeper tissues to foreign pathogens, irritants, pollutants and allergens, and can lead to higher activation of subepithelial cells, such as immune cells.410 Thus, chronic exposure to airborne PM may potentially predispose an individual to chronic mucosal inflammatory disease by impairing airway barrier function. However, the causal relationship between PM and airway epithelial TJ dysfunction is not clear.
The aim of the present study was to assess the direct impact of PM with an aerodynamic diameter less than 2.5 μm (PM2.5) on the function and expression pattern of normal human nasal epithelial TJ. Nasal mucosa biopsy specimens obtained from noninflammatory subjects exhibited lower TJs expression in a higher PM2.5 season (i.e., winter) compared to those obtained in the summer. Using air-liquid interface (ALI) cultures of noninflammatory human nasal epithelial cells (NECs), we evaluated whether PM2.5 induces leakiness in epithelial barrier, along with down-regulation of claudin-1 at both messenger RNA (mRNA) and protein level, and whether it induces production of proinflammatory cytokines, which may cause TJs damage and tissue remodeling in the nasal mucosa.
MATERIALS AND METHODS
Patients
Patients undergoing paranasal sinus surgery for noninflammatory conditions (i.e., cerebrospinal fluid leak, bullous middle turbinate and septal deformities) were enrolled in the study. Surgery was conducted under general anaesthesia, and nasal mucosa was obtained from the middle turbinate or the uncinate process according to different purposes of the operation. Patients with histories suggestive of allergies or with total immunoglobulin E (IgE) levels exceeding 100 kU/L or allergen-specific IgE level > 3.51 kU/L were excluded. All patients were nonsmokers. The study protocol was approved by the Ethics Committee of Beijing Tongren Hospital, and all patients provided written informed consent prior to any samples being taken for investigation.
For in vivo study, the mucosal samples were obtained from our sample bank of patients meeting the above requirements and operated in the summer (i.e., June and July) or winter (i.e., January and February) months. One part of the mucosa was stored at –80°C for future RNA isolation, and the other was embedded in 4% paraffin for histological evaluation.
Isolation and ALI cultures of primary NECs
Freshly obtained nasal mucosal samples were washed in phosphate buffer saline (PBS) with 200 U/mL penicillin and 50 mg/mL streptomycin and were then enzymatically digested in 0.1% pronase (Protease XIV; Sigma-Aldrich, St. Louis, MO, USA) solution in Dulbecco's modified eagle media (DMEM) culture medium supplemented with 100 U/mL penicillin. After overnight incubation at 4°C with gentle shaking, the protease reaction was stopped by addition of 10% fetal bovine serum. Cells were washed in culture medium and pelleted by centrifugation at 100 g for 5 minutes. The cell pellet was then resuspended in 10 mL of culture medium and incubated in a plastic culture flask at 37°C for 1 hour to remove fibroblasts.
Freshly isolated NECs were seeded on 0.4-μm, 0.33-cm2 polyester transwell inserts (Costar, Corning, NY, USA) at a density of 105 cells per transwell in DMEM/F12: BEGM (1:1) culture medium (Lonza, Walkersville, MD, USA) and incubated at 37°C in 5% CO2 in air atmosphere. The culture medium was changed every other day, until the NECs grew to complete confluence, at which stage the apical culture medium was removed and the cells were allowed to differentiate further as ALI cultures.
Purification and characterisation of PM2.5
PM2.5 was a gift from the Institute for Environmental Health and Related Product Safety, Chinese Center for Disease Control and Prevention. The PM2.5 samples were collected on specialized filters in urban areas of Beijing during the period of 20 October to 25 November, 2014. Particles were released from filters and dispersed in solution by ultra-sonication in endotoxin-free 0.9% saline for 30 minutes. After being dried, the PM2.5 samples were weighed and aliquoted in PBS before being stored at −20°C until required. The assessment methods and results of the chemical composition of PM2.5 are presented in Supplementary Table S1.
Assessment of PM2.5 cytotoxicity to human cultured NECs
Cytotoxicity of PM2.5 was assessed by measuring lactate dehydrogenase (LDH) released into the culture medium of human NECs incubated in the presence of increasing concentrations of PM2.5 for 24 hours. The 50-μL aliquots of media were transferred to a 96 well plate and mixed with 50-μL reaction mixture (ThermoFisher scientific, Woburn, MA, USA). Thirty minutes after incubation in the dark at room temperature, the absorbance of the formazan salt was measured at 492 nm. Absorbance at 620-nm wavelength was used as a reference. All measurements were made in triplicates and cytotoxicity was calculated according to the manufacturer's instructions, including a background control for LDH activity in the media, a control for untreated cells (0% lysis of the cells) and a control for maximum LDH release (100% lysis of the cells).
Assessment of the effect of PM2.5 on transepithelial resistance (TER) and paracellular flux in NECs established as ALI cultures
Based on LDH cytotoxicity experiments, PM2.5 concentrations less than 100 μg/mL were considered nontoxic and applied to ALI cultures. The experiments were initiated at about 3 weeks in ALI culture, when TER reached a plateau of above 300 Ω × cm2. To mimic the in vivo state in which the pollution component would come into contact with the ciliated air-exposed surface of the respiratory epithelium, NECs were exposed to 50 μg/mL or 100 μg/mL PM2.5 added to the apical compartment for 8 hours daily. Then PM2.5 was sucked away and the cells were rinsed 3 times with PBS. Control cultures were prepared by adding only culture medium to the apical compartment.
Similarly, the effect of budesonide, an intranasal steroid commonly used as first-line therapy for nasal inflammation, was investigated by adding 1 μmol/L budesonide (Sigma-Aldrich) or culture medium into the upper chamber for 1 hour prior to treatment with PM2.5. The concentration of budesonide was adapted from the study of Sekiyama et al.,11 who claimed that 1 μmol/L budesonide could directly promote the permeability barrier function of airway epithelial cells Calu-3.
TER and paracellular diffusion of fluorescein isothiocyanate (FITC)-labeled 4-kDa dextran (Sigma-Aldrich) were determined as surrogate markers of epithelial integrity. TER measurements were made at 0 (before stimulation), 24, 48 and 72 hours after incubation with PM2.5, using a Millicell-ERS Volt-Ohm Meter (Millipore, Temecula, CA, USA). Cultures with TER < 300 Ω × cm2 were not included in experiments (14%), and TER was measured in triplicate for each subject.
Paracellular flux measurements were made after TER experiments. Paracellular permeability was evaluated by adding of 2 mg/mL FITC-dextran to the apical surface of the ALI cultures and then measuring the intensity of FITC in the basolateral medium after 12 hours, with an ELISA reader (Mithra LB 940; Berthold Technologies, Bad Wildbad, Germany) at 480 nm. Experiments were conducted with cells from each participant, employing a minimum of 2 cultures established in multiple well plates.
Quantitative real-time polymerase chain reaction (PCR) and immunostaining of TJs
After incubation with PM2.5 for 72 hours, NEC monolayers were dissected from transwell membranes. Total RNA was extracted and purified with an RNeasy Mini Kit (Qiagen, Hilden, Germany) and RNase-free DNase (Qiagen), according to the manufacturer's instructions. RNA was reverse transcribed into complementary DNA using a Revert Aid RT kit containing random hexamers (ThermoFisher Scientific) and quantitative real-time PCR was performed on a Bio-Rad iCycler using the iQ SYBR Green Supermix (BioRad, Hercules, CA, USA) as described in the manufacturer's protocol. Sequences of the predesigned primers used are listed in Supplementary Table S2. The amount of elongation factor 1α mRNA was used to standardize the quantities of each transcript according to the 2−ΔΔCT value.
A similar immunofluorescent staining procedure was employed for both paraffin-embedded biopsy sections and ALI cultures. Detailed information on the methods employed for staining TJs (claudin-1, ZO-1 and occludin) is described in the Supplementary Data S1. The fluorescence intensities of acquired images were quantified using ImageJ software (National Institute of Health, Bethesda, MD, USA).
Luminex and enzyme-linked immunosorbent assay (ELISA) analysis of cytokine concentration in culture medium
Inflammatory cytokines were measured in culture medium in the basolateral chamber collected after measurement of TER at the end of the 72-hour incubation period in the presence of PM2.5, and before addition of FITC into the upper chamber. All samples were stored in aliquots at −20 ºC until analysis for interleukin (IL)-8, IL-25, IL-33, transforming growth factor (TGF)-β, matrix metalloproteinase (MMP)-9, TIMP metallopeptidase inhibitor 1 (TIMP-1) and thymic stromal lymphopoietin (TSLP). Samples were assessed in duplicate and all samples, apart from IL-8 and TSLP, were analyzed using the Human Magnetic Luminex Screening Assay (R&D, Santa Clara, CA, USA) according to the manufacturer's recommendations. The assay was performed using an 8-point standard curve for each cytokine. Samples were analysed on a Bio-Plex 200 System (BioRad), and the data were evaluated using the Bio-Plex Manager software (BioRad). Standards, internal controls and samples are reported as means of duplicate measurements. IL-8 and TSLP were assayed by commercial ELISA kits (R&D) according to the manufacturer's instructions.
Statistical analysis
Data were analyzed using GraphPad Prism 5 software (GraphPad Software, La Jolla, CA, USA). Data are presented as means ± standard errors. Differences between groups were analyzed using the 2-tailed unpaired t test or the Mann-Whitney U test. Two-way analysis of variance or the Kruskal-Wallis test with post hoc analysis was used to compare multiple groups. Values of P < 0.05 were considered statistically significant.
RESULTS
TJ expression in nasal mucosa harvested in different seasons
Five and 7 samples of noninflammatory nasal mucosa were collected during endoscopic surgery in the summer (i.e., June and July) and winter (i.e., January and February), respectively. For quantitative PCR [qPCR] experiment, sample numbers were 5 for both winter and summer. The clinical data of these patients, including average 24-hour PM2.5 concentration in the week prior to the surgery, are shown in Supplementary Table S3.
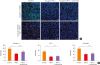
To visualize TJ expression in the nasal mucosa in different seasons, paraffin-embedded biopsy sections were stained for claudin-1, occludin and ZO-1 (Fig. 1). The immunofluorescent staining for ZO-1 and occludin was mainly confined to the upper most level of the epithelium, whereas the immunofluorescent staining for claudin-1 was distributed more extensively in the epithelium. The expression pattern of TJs was consistent with those found in other studies that claudin-1 was expressed not only pericellularly but in the cytoplasm, while ZO-1 and occludin were almost exclusively confined to the membrane. The cytoplasmic distribution of claudin-1 was consistent with those of previous studies.1213 Furthermore, the immunoreactivity of claudin-1, ZO-1 and occludin was significantly higher in the summer samples than in the winter samples. The qPCR of these samples showed that the arbitrary unit of TJ mRNAs (including ZO-1, ZO-2, CLDN-1, CLDN-4, CLDN-7 and occludin) all displayed a tendency for lower expression during the winter than during the summer; however, the differences were not statistically significant (Supplementary Fig. S1).
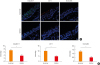 | Fig. 1(A) Representative images of immunofluorescent-stained claudin-1, ZO-1 and occludin in noninflammatory nasal mucosa collected during different seasons. The immunofluorescent staining for ZO-1 (red) and occludin (green) was mainly restricted to the apical compartment of epithelium, whereas the distribution of claudin-1 (green) was more extensive in the epithelium. A relatively weak staining was seen for claudin-1, occludin and ZO-1 in biopsy specimens collected during the winter compared to specimens collected during the summer. Bar = 20 μm. (B) Fluorescence intensities were quantified using ImageJ software (winter vs. summer; n = 7 and 5, respectively).
*Statistical significance at a level of P < 0.05.
|
Effect of PM2.5 on NECs established as ALI cultures
After visualization of TJ expression in different seasons, we aimed to assess the impact of PM2.5 in cultured NECs. ALI cultures of NECs were established from 23 samples of noninflammatory nasal mucosa. Assessment of cytotoxicity of PM2.5 to NECs demonstrated that PM2.5 concentrations above 100 μg/mL led to prominent cell death (more than 10%) and was therefore considered toxic (Supplementary Fig. S2). Concentrations of 50 μg/mL and 100 μg/mL were used in all subsequent experiments with ALI cultures.
Incubation of ALI cultures with 50 μg/mL PM2.5 intermittently for 72 hours significantly decreased the relative TER (ratio of each time point TER to that of 0 hour) compared to baseline level (1.02 ± 0.10 vs. 0.73 ± 0.07, P ﹤ 0.01), whereas incubation with 100 μg/mL PM2.5 significantly decreased relative TER by 24 hours (0.99 ± 0.06 vs. 0.73 ± 0.06, P ﹤ 0.01). Furthermore, the effect of 100 μg/mL PM2.5 on TER was greater than that of 50 μg/mL PM2.5 at each time point (Fig. 2A), indicating that PM2.5 lowered TER in a concentration- and time-dependent manner. According to our recovery study (Supplementary Fig. S3), after PM2.5 was withdrawed for 96 hours, relative TER returned to the baseline level. Since it took about 3 weeks to setup an ALI culture, we assumed the time point of tissue harvest would not affect the barrier integrity of cultured NECs.
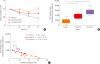 | Fig. 2Effect of PM2.5 on the barrier function of ALI cultures established from NECs. (A) TER at different time points following exposure to medium alone (control), 50 μg/mL PM2.5 or 100 μg/mL PM2.5 intermittently. Due to some inherent variability in baseline TER measurements across samples, all measurements were normalized to a value of 1.0 at the beginning of the measurement (0 hour). (B) Dose-dependent increase in FITC-dextran paracellular flux in ALI cultures treated with different doses of PM2.5. Barrier integrity was determined by paracellular flux in response to PM2.5 treatment after 72 hours. (C) TER negatively correlates with FITC-dextran permeability in ALI cultures (exposed to 100 and 50 μg/mL PM2.5 or medium alone). Data are expressed as mean ± standard error of the mean, n = 12 donors per group in duplicate.PM2.5, particulate matter with an aerodynamic diameter of less than 2.5 μm; FITC, fluorescein isothiocyanate; ALI, air-liquid interface; TER, transepithelial resistance.
*P < 0.05; †P < 0.01; ‡P < 0.001.
|
Similarly, assessment of paracellular flux as measured according to the amount of FITC-dextran passing across the epithelial layer demonstrated that epithelial permeability was significantly increased by incubation with 50 μg/mL PM2.5 (1.650 ± 0.28 mg/mL vs. 3.86 ± 0.30 mg/mL, P ﹤ 0.05) and 100 μg/mL PM2.5 (1.650 ± 0.28 mg/mL vs. 6.49 ± 0.49 mg/mL, P ﹤ 0.001) in a dose-dependent manner (Fig. 2B). Furthermore, TER was negatively correlated with paracellular flux of FITC-dextran (Fig. 2C).
Effect of pretreatment with budesonide on PM2.5-induced epithelial barrier damage
INS have been proven to be effective in the treatment of nasal inflammation and in protecting barrier function against different types of stimulations.3141516 In order to investigate if a topical steroid could prevent the PM2.5-induced damage to the epithelial barrier, budesonide (1 μmol/L) was applied to ALI-cultured NECs,1 hour before exposure to PM2.5. Although both 50 μg/mL and 100 μg/mL PM2.5 significantly reduced TER (Fig. 2A) and increased FITC-dextran flux across the epithelial cultures (Fig. 2B), pretreatment with budesonide altered the PM2.5-induced changes in neither TER (Fig. 3A and B) nor FITC-dextran flux (Fig. 3C) in the ALI-cultures.
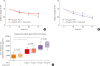 | Fig. 3PM2.5 undermined the barrier integrity of air-liquid interface cultures established from nasal epithelial cells, which could not be prevented by budesonide pretreatment. The relative TER of cultures exposed to 50 μg/mL PM2.5 (A) or 100 μg/mL PM2.5 (B) and (C) paracellular flux of FITC-dextran 4kDa at 72 hours in cultures incubated in the absence or presence of 50/100 μg/mL PM2.5 was not significantly altered by pretreatment of the cultures for 1 hour with budesonide (1 μmol/L). Data are expressed as mean ± standard error of the mean, n = 5 donors per group in duplicate.PM2.5, particulate matter with an aerodynamic diameter less than 2.5 μm; FITC, fluorescein isothiocyanate; TER, transepithelial resistance.
*P < 0.05; †P < 0.001.
|
Effect of PM2.5 treatment on TJs mRNA and protein expression in ALI cultures established from NECs
The expression of TJ genes previously shown to be detected in relatively high levels in human nasal mucosa was investigated, including claudin-1, claudin-4, claudin-7, occludin, ZO-1 and ZO-2.1718
Incubation with 100 μg/mL PM2.5 significantly increased the expression of claudin-7 and ZO-1 mRNAs, while the expression of claudin-1 in ALI cultures decreased (Fig. 4). Incubation with 50 μg/mL PM2.5 affected the mRNA expression of claudin-7 and claudin-1 similarly, but did not alter the expression of ZO-1 mRNA.
 | Fig. 4Effect of PM2.5 on the expression of tight junction mRNAs in air-liquid interface cultures established from nasal epithelial cells. After incubation with PM2.5 for 72 hours, relative mRNA expression of claudin-1 was significantly decreased and expression of ZO-1 and claudin-7 significantly increased in cultures treated with 100 μg/mL PM2.5, compared to control cultures (n = 10 each for the control and 50-μg/mL PM2.5-treated groups, n = 9 for the 100-μg/mL PM2.5-treated group).PM2.5 with an aerodynamic diameter of less than 2.5 μm; mRNA, messenger RNA.
*P < 0.05, †P < 0.01.
|
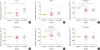
Assessment of the effects of PM2.5 on the expression of TJ proteins by confocal fluorescence microscopy demonstrated that fluorescence signals were interrupted and discontinuous at perijunctional areas in PM2.5-treated cultures, while claudin-1, occludin and ZO-1 presented as continuous fluorescent ring signals at the intercellular junction in untreated control cultures (Fig. 5A), with significant loss of fluorescent intensity compared to the control cultures (P < 0.05, Fig. 5B). Furthermore, pretreatment of the cultures with budesonide did not significantly alter the PM2.5-induced changes in any TJ protein (Fig. 5A and B).
 | Fig. 5(A) Representative images of claudin-1 (green), occludin (green) and ZO-1 (red) immunofluorescent staining in cultured nasal epithelial cells exposed to medium alone, 100 μg/mL PM2.5 or 100 μg/mL PM2.5 pretreated with budesonide. Cultures exposed to medium alone displayed distinct TJs at cell borders, whereas cultures treated with PM2.5 displayed diminished and less discernible TJs at cell-cell junctions. Cultures pre-treated with budesonide showed similar changes to those treated with just PM2.5. Representative images from 3 donors each are shown. Bar = 20 μm. (B) Fluorescence intensities were quantified using ImageJ software.PM2.5, particulate matter with an aerodynamic diameter less than 2.5 μm; N.S., not significant; TJ, tight junction; TRITC, tetramethylrhodamine.
*P < 0.05.
|
Effect of PM2.5 on inflammatory cytokines secreted by ALI cultures established from NECs
After determining the impact of PM2.5 on the barrier integrity of cultured NECs, we attempted to assess its effect on the inflammatory status of NECs. Cytokine concentrations in ALI culture medium of NECs treated with medium alone, 50 μg/mL PM2.5 or 100 μg/mL PM2.5 intermittently for 3 days are shown in the Supplementary Table S4. Incubation of cultures in the presence of 100 μg/mL PM2.5 significantly increased the concentrations of IL-8, TIMP-1 and TSLP compared to control cultures (Fig. 6). The secretion of other cytokines known to be produced by NECs was not affected by PM2.5.
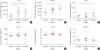 | Fig. 6Cytokine concentrations (pg/mL) in ALI culture medium of NECs treated with medium alone, 50 μg/mL PM2.5 or 100 μg/mL PM2.5 intermittently for 3 days, respectively. Cultured NECs produced significantly more IL-8, TIMP-1 and TSLP after treatment with PM2.5, compared to cultures treated with medium alone. A dose-dependent effect was visible, although it was not statistically significant for all mediators. The secretion of other cytokines produced by NECs was not affected by PM2.5. Data are presented as mean ± standard error of the mean (n = 8 to 10 in each group).PM2.5, particulate matter with an aerodynamic diameter less than 2.5 μm; IL, interleukin; TIMP-1, TIMP metallopeptidase inhibitor 1; TSLP, thymic stromal lymphopoietin; MMP, matrix metalloproteinase; NEC, nasal epithelial cell.
*P < 0.05; †P < 0.01; ‡P < 0.001.
|
DISCUSSION
Intercellular TJs are important components for efficient epithelial barrier function: the first-line defence against invasion by environmental pathogens and entrance of antigens. TJs form homodimer bands that prevent cells and proteins passing through the epithelium, and regulate paracellular water permeability selectively.19 Several studies have shown PM-induced reductions in barrier functions of skin,20 blood-brain barrier,21 endothelial cells22 and gastrointestinal tract23; however, little research has focused on the impact of PM on especially the integrity of upper airway epithelial thus far.
To understand the relationship between PM2.5 and increased nasal inflammation, the present study investigated the function and expression of TJs in NECs ALI cultures established from the nasal samples of normal human subjects. The findings of increasing concentrations of LDH leakage from cells supported the notion that cytotoxicity of PM2.5 is correlated with its concentration. While concentrations above were toxic, increased cell death and resulted in substantial loss of epithelial barrier integrity, concentrations below 100 μg/mL PM2.5 were much less toxic but still led to a significantly defective barrier function as well as decreased expression of TJ mRNAs and proteins. Less expression of TJ proteins highlighted by immunofluorescence staining was also shown in nasal mucosa biopsy specimens obtained from non inflammatory subjects during the winter compared to those obtained in the summer. Ambient PM2.5 concentrations in Beijing are much higher in the winter as a result of additional heating requirements than in the summer.24 Besides PM2.5 concentration, other meteorological factors, including humidity and temperature, vary in different seasons as well. However, considering the ability of the nasal cavity to condition cold and dry air, which took place mainly in the anterior nasal segment, including the nasal valve area,25 we assume PM2.5 as a potent but not exclusive reason of TJs impairment in the winter season.
INSs have been proven to be effective in the treatment of nasal inflammation, particularly allergic rhinitis, through different mechanisms.141516 The protective role of glucocorticoid on TJs was controversial.3 Fluticasone propionate can restore the nasal epithelial barrier function impaired by IL-4. Budesonide, but not fluticasone propionate, significantly improved barrier dysfunction in primary bronchial epithelial cells induced by cigarette smoke extract.26 Dexamethasone attenuates the up-regulation of claudin-2 (a pore-forming TJ component) induced by IFN/TNF, but does not affect the increased claudin-2 expression upon IL-1β stimulation.27 Although budesonide was found to be capable of enhancing the development of airway epithelial barrier,11 our study has demonstrated that budesonide failed to restore the PM2.5-induced damage to the epithelial barrier. This discrepancy might be explained by diverse stimulation and culture procedures and/or glucocorticoid concentrations.
The findings of the present study are partly in accordance with those of several other studies, which have focused on other airborne elements besides PM. For example, exposure of human bronchial epithelial cells to cigarette smoke extract has been shown to decrease TER, and significantly reduce the TJ-associated proteins ZO-1 and ZO-2 in the cell membrane.28 Similarly, exposure to Der p1 antigen has been shown to markedly decrease both TER and the expression of the sinonasal epithelium TJ proteins JAM-A and claudin-1,29 which contributes to increased epithelial permeability and also represents a potential mechanism for transepithelial antigen migration and exposure in allergic rhinitis. A previous study in mice has shown that intranasal administration of diesel exhaust particles before ragweed pollen challenge increased ragweed pollen-induced sneezing and disrupted nasal mucosal TJs, possibly due to the decreased expression of nasal mucosal ZO-1.30 Indeed, there is some evidence that insufficiency of TJs may be an important factor in the pathophysiology of upper airway diseases such as nasal polyposis and allergic rhinitis.231 In our experiment, there was discrepancy between the down-regulated ZO-1 and occludin protein levels with the slightly up-regulated ZO-1 and unchanged occludin mRNA levels. We assume that PM2.5 might have impact on both mRNA and protein levels. ZO-1 and claudin-7 mRNA elevation in response to PM2.5 exposure might reflect a defensive feedback mechanism of normal epithelial barrier, which has been observed in epithelium exposed to anaerobic bacteria or Staphylococcus aureus.3233 On the other hand, PM2.5 might also affect TJ molecules expression post-transcriptionally by different mechanisms, which called for further studies.
Besides their role in constituting a barrier, epithelial cells are crucial in the initiation, regulation, and resolution of immune responses at mucosal sites.3435 To assess the effect of PM2.5 on the expression of immune responsive genes, we examined the cytokine/chemokine production in NECs. Our study demonstrated that exposure of cultured NECs to PM2.5 led to increased production of IL-8, TIMP-1 and TSLP, whereas the expressions of IL-25, IL-33, TGF-β and MMP-9 were not affected. IL-8 production plays an important role in innate immunity involving neutrophil maturation, activation and chemotaxis. However, the enhanced immunity came at the price of remodeling and damaged barrier function.36 Yu et al.
37 also found that IL-8 regulated the permeability of endothelium by down-regulation of TJs in a dose- and time-dependence manner. Thus, the up-regulation of IL-8 by PM2.5 is capable of reducing TJ proteins and leading to leaky epithelium. Our study has also indicated that although PM2.5 did not significantly alter the synthesis of MMP9, which has been shown to modulate TJ integrity and cell viability in human airway epithelia,38 it did significantly increase TIMP-1, an inhibitor of MMP9. The increased levels of TIMP-1 may contribute to airway remodeling.39 Bleck and colleagues40 had also shown that a wide variety of stimuli, including diesel-exhaust particles, can induce the human bronchial epithelial release of TSLP, which may profoundly affect allergen-specific IgE production/T helper 2 differentiation.
In conclusion, using NECs established as ALI cultures, we have demonstrated that exposure to PM2.5 leads to loss of the barrier integrity of the human nasal epithelium. It is likely that this may be attributed to a combination of decreased expression of TJ proteins and increased release of proinflammatory cytokines. These results suggest an important mechanism of susceptibility to nasal inflammation in areas with high levels of PM2.5 pollution. Because ambient PM2.5 concentrations in Beijing are much higher in the winter than in the summer, we speculate the PM2.5-induced decreases in TJ proteins and increased inflammation may be one of the factors contributing to increased respiratory problems in the winter months.
 XML Download