Journal List > Allergy Asthma Immunol Res > v.12(1) > 1137114

Seo, Kim, Cho, Oh, and Kim: Deep Neural Network-Based Concentration Model for Oak Pollen Allergy Warning in South Korea

Abstract

Purpose

Oak is the dominant tree species in Korea. Oak pollen has the highest sensitivity rate among all allergenic tree species in Korea. A deep neural network (DNN)-based estimation model was developed to determine the concentration of oak pollen and overcome the shortcomings of conventional regression models.

Methods

The DNN model proposed in this study utilized weather factors as the input and provided pollen concentrations as the output. Weather and pollen concentration data were used from 2007 to 2016 obtained from the Korea Meteorological Administration pollen observation network. Because it is difficult to prevent over-fitting and underestimation by using a DNN model alone, we developed a bootstrap aggregating-type ensemble model. Each of the 30 ensemble members was trained with random sampling at a fixed rate according to the pollen risk grade. To verify the effectiveness of the proposed model, we compared its performance with those of models of regression and support vector regression (SVR) under the same conditions, with respect to the prediction of pollen concentrations, risk levels, and season length.

Results

The mean absolute percentage error in the estimated pollen concentrations was 11.18%, 10.37%, and 5.04% for the regression, SVR and DNN models, respectively. The start of the pollen season was estimated to be 20, 22, and 6 days earlier than that predicted by the regression, SVR and DNN models, respectively. Similarly, the end of the pollen season was estimated to be 33, 20, and 9 days later that predicted by the regression, SVR and DNN models, respectively.

Conclusions

Overall, the DNN model performed better than the other models. However, the prediction of peak pollen concentrations needs improvement. Improved observation quality with optimization of the DNN model will resolve this issue.

INTRODUCTION

Pollen induces allergic diseases such as allergic rhinitis, allergic conjunctivitis, asthma, and skin allergies. Flowers can be classified as entomophilous, which are pollinated by insects, and anemophilous, which are pollinated by the wind. Of these, the airborne pollen of anemophilous flowers is known to be the primary source of respiratory allergies. Korea has seen an increase in allergy cases, with the prevalence of allergic rhinitis in elementary school students increasing from 2.7% in 1995 to 28% in 2009 and the prevalence of allergic rhinitis in preschool children reaching 40.7% in 2009.1234 These figures indicate an increase in the latent risk of pollen allergies and hospital visit. Skin prick tests of patients with allergy symptoms (asthma, rhinitis, and dermatitis) in Suwon, Korea during 1999-2008 showed that approximately 20.5% of the patients were sensitized with tree pollens including oak.5 Oak is the dominant tree species in Korea, and its pollen has the highest sensitivity rate of all allergenic tree species in Korea.6 Therefore, oak pollen is a major factor influencing the number of daily hospital visits and medication use in Korea.
Beggs7 predicted that future increases in CO2 will lead to increased pollen output, longer pollen seasons, and greater human exposure to pollen, noting that the strength of both allergy inducement and risk will increase. D'Amato et al.8 also predicted that the pollen season will become longer as a result of global warming. Pollen allergy forecasting can be considered to be a response to this gradually increasing risk of pollen allergies, and Germany, Japan, Korea, England, the United States, and other countries now provide allergy forecasts for their respective primary pollens.
The Korea Meteorological Administration (KMA) has been providing pollen risk forecasts for pine and oak in the spring and Japanese hop and ragweed in the fall since 2008. The KMA pollen risk model predicts pollen concentrations from weather factors and is based on an initial model developed by Kim et al.,9 which used independent multiple regression models for 7 South Korean cities. To expand on this scope, Kim et al.4 then developed a model that could make prediction covering all of South Korea through the use of a single model employing robust multiple regression based on a Weibull probability distribution. However, the expanded and unified model still underestimated pollen concentrations and could not predict high concentrations well. In addition, the pollen seasons predicted by this model were longer actually than observed. We believe that the main causes of these problems are that the training data contain more low than high concentrations and the regression model cannot properly model the nonlinear relationship between weather factors and pollen concentrations. To address this, we used a machine learning method called a deep neural network (DNN) model in this study to improve on the existing method by modeling nonlinear relationship between weather factors and pollen concentrations. In addition, a bootstrap aggregating-type ensemble model was incorporated to prevent over-fitting and underestimation of the DNN model.
A DNN is an artificial neural network (ANN) with 3 or more hidden layers and is also known as multilayer perceptron. Previous studies applied ANNs in pollen concentration prediction models, including Grinn-Gofroń and Strzelczak,10 who studied Alternaria, Puc,11 who studied Betula, Iglesias-Otero et al.,12 who studied Plantago, and Astray et al.13 who studied Castanea. These efforts employed models with a single hidden layer in which the networks were limited in that they were constructed with the data obtained from a single site as the target. Therefore, these models could make predictions pertaining only to that site. In addition, many of these ANN models such as the one proposed by Astray et al.,13 utilized pollen concentration data observed on the previous day, which are generally not available for daily operational forecast.
The goal of the present study is to develop a DNN-based estimation model for oak pollen concentration that can overcome the shortcomings of regression models but maintain the capability of daily operational forecast. We compared the performance of proposed model with those of a conventional regression model and a support vector regression (SVR) model under the same conditions with respect to in the prediction of daily pollen concentrations and risk levels, as well as the length of yearly pollen season, to verify the effectiveness of the proposed model.

MATERIALS AND METHODS

Pollen observational network in Korea

In Korea, allergy-inducing pollen is observed using 7-day recording volumetric spore samplers (Burkard Scientific Ltd., Uxbridge, UK) installed in 12 locations (Guri, Busan, Jeonju, Daegu, Daejeon, Jeju, Gwangju, Gangneung, Pocheon, Pohang, Seoul and Seoul [KMA]). The Korean Academy of Pediatric Allergy and Respiratory Disease began observation in 1997 at 7 locations around the country, including Seoul, Busan, Daegu, Gwangju, Gangneung, Jeju and Guri, In 2006, they upgraded their observation network to 12 stations around the country in a joint research effort with the KMA.14 Collection drums containing Melinex tape are gathered at 7-day intervals and the tape is divided into one-day recording intervals at the analysis center in Guri. The tape is dyed with Calberla's fuchsin (10 mL glycerin, 20 mL 95% alcohol, 30 mL distilled water, and 0.2 mL basic fuchsin), placed under an optical microscope (200× magnification), and the pollen grains are counted. The pollen count is converted into a daily pollen concentration (grains m−3) based on the daily total amount of air intake (10L min−1), the intake area (14 mm × 2 mm), the collection tape's daily impact area (14 mm × 48 mm), and the observed area under the microscope.
The major allergy-inducing pollen species vary slightly by region and are classified into 9 types of weeds, 19 types of trees, and 1 type of grass.14 The risk grade of oak tree is set at 1 of 4 levels (mild: 0-49, moderate: 50-99, severe: 100-199, extreme: ≥ 200 and unit: grains m−3) based on the daily pollen concentration and daily allergic reaction reported by sensitized allergy patients.4

Weather data

As weather input for the pollen risk model, daily data were taken from KMA weather stations near the pollen observation network sites. Referencing the data of Kim et al.,4 the weather variables used in our analysis were daily maximum temperature, daily minimum temperature, growing degree day (GDD: accumulated mean temperature above 0°C from January 1st), difference of GDD (dGDD: difference in GDD between current and the previous day), daily mean relative humidity, daily mean wind speed, and daily precipitation. To describe the nonlinear relationship between the weather conditions and the pollen concentration, Kim et al.4 fit the input variables to a Weibull probability density function (PDF); here, we fit the GDD to a Weibull PDF. The input variables ultimately used in the study are shown in Table 1.
Table 1

Input variables utilized in the development of the oak pollen model

aair-12-149-i001
Variable name Unit Description
GDD °C Degree-days (accumulated average temperature above 0°C from 1 January)
WGDD °C GDD fit to Weibull probability density function
fGDD=cσcθσc1expGDDθσc,θ=480,σ=200,c=2aair-12-149-e001
dGDD °C Difference between current and previous day's GDD
dGDDt = GDDtGDDt−1
Tmax °C Daily maximum air temperature
Tmin °C Daily minimum air temperature
WS ms−1 Daily mean wind speed
PR mm Daily total precipitation
RH % Daily mean relative humidity
Jday Day Julian day (number of days from 1 January)

Oak pollen data

Korea's pollen activity of trees is mainly observed in April and May; pollen concentrations during this time having an uneven distribution, with 80% of the concentrations being below 10 (grains m−3). The risk grades are also distributed, with mild, moderate, severe, and extreme occurring with frequencies of 92.7%, 3.5%, 2.2%, and 1.6%, respectively. Using the data, in which the distribution tends toward low concentrations, leads to a model that underestimates concentrations and cannot predict high concentrations, which in turn degrades the model's performance in producing pollen risk warnings. To reduce underestimation, we varied the sampling size according to risk grade and used the results for model training.

Training and test data

For model training and verification, we used pollen and corresponding weather data from 2007 to 2016 from Busan, Daejeon, Daegu, Gangneung, Guri, Gwangju, Jeonju, Pohang, and Seoul (KMA), which were among the KMA's 12 pollen network stations with sufficient data and few missing values. Using the data from 2007 to 2014 as the training set, the DNN model structure was selected through k-fold cross validation (k = 10). The entire training set was used for model training. The data from 2015 and 2016 were used as the test set to evaluate the model's performance.

DNN-based concentration model for oak pollen

The pollen concentration data did not show a linear relationship with the weather variables and had a low correlation, with a correlation coefficient of below 0.3. Accordingly, we used a DNN to model the nonlinear relationship between the pollen concentration and the weather variables, applying analysis program R 3.3.3 and DNN package “H2o.”
Because the pollen concentrations trended low, the model was made to underestimate. As DNN is a model with a high possibility of training data over-fitting, we applied a bootstrap to sample the risk grade at a fixed rate to the DNN and an ensemble method on the DNN prediction values for each sub sample set. This method, in which a sample set is extracted from the entire sample and an ensemble method is used on the model prediction values for each sub-sample set, is called bootstrap aggregating, or bagging.15 Bootstrapping is a resampling technique that usually has the effect of reducing result uncertainty.1617 Normally, bootstrapping is based on random sampling with replacement, but in this case random sampling without replacement was used as the fixed total amount of pollen created by trees is assumed. In cases where many mild risk grade samples are extracted, the model will underestimate; likewise, if there are few samples, the model will overestimate. Optimizing the sample extraction ratio for each risk grade is difficult because many combinations must be optimized with the DNN structure; accordingly, we extracted training sets with ratios fixed at 7% (mild), 80% (moderate), 90%(severe), and 100% (extreme) so that the ratios of the training sets for the mild and non-mild risk grades would be similar. In this case, the former and latter grades accounted for 54% and 46%, respectively.
The DNN's structure is determined by the number of hidden layers, the number of neurons in each layer, and the activation function. Among activation functions such as sigmoid, hyper tangent, and rectified linear unit, we used the hyper tangent function as it produces reliable results. Because it is difficult to test the structure of all combinations in optimizing the DNN structure, a structure was selected using heuristic methods. In this study, there were generally many cases in which the prediction value became very large or very small as the number of hidden layers increased, and there were many cases in which underestimation occurred as the number of hidden layers decreased. Furthermore, performance was good when the number of neurons in the first hidden layer was larger than that in the input layer and when the number of neurons in the first hidden layer was larger than in each succeeding layer. Accordingly, the number of hidden layers was set at 5 and the first hidden layer's neuron number was set to a maximum of 150. The number of neurons in each layer was decreased in units of 10 and a k-fold cross validation (k = 10) test was performed to set the DNN structure. The ultimately selected DNN structure was 8:8-150-100-100-100-100-1:1, with 5 hidden layers. In addition, because a neural network model varies depending on the initial seed value, fine-tuning was performed after pre-training to set the initial values. In general, pre-training methods use either a restricted Boltzmann machine (RBM) or an auto-encoder (AE).1819202122 For this study, we used an AE as its calculations are simpler than those of an RBM.
Our overall training process for the pollen concentration model involves extracting B bootstrap sample sets from the training set, training the DNN model through pre-training and fine tuning of the sample sets, creating final prediction values from each DNN model's predictive value mean, and finally classifying the risk according to the pollen risk grades (Fig. 1). Here, we used a truncated mean of the prediction values in which the top and bottom 5% of the values were removed to reduce the effect of outliers. We tested the sensitivity of B to the number of bootstrap sample sets and used this to set its value. We found that as B grew larger, the mean absolute error (MAE) and the root mean squared error (RMSE) both grew smaller, with convergence occurring at values of B above 30. Ultimately, a bootstrap DNN model with a B of 30 was used as the pollen concentration model.
Fig. 1

Structure of DNN model for oak pollen concentration modeling.

DNN, deep neural network; WGDD, growing degree day fit to Weibull probability density function; dGDD, difference of growing degree day; Tmax, daily maximum air temperature; Tmin, daily minimum air temperature; PR, daily total precipitation; RH, daily mean relative humidity; WS, daily mean wind speed; Jday, Julian day (number of days from 1 January).
aair-12-149-g001

Evaluation of the new model

To evaluate the performance of the model, we used a bagging technique for the same conditions, input variables, and training data as the DNN model and compared the results with those of a regression model (multiple linear regression) and a SVR model. We compared the actual and predicted values produced by each model of pollen concentration, daily pollen risk grade, and the pollen season using the 2015-2016 test data. For the daily pollen concentrations, we calculated the mean absolute percentage error (Equation. 1), MAE, and RMSE; for the daily pollen risk, we calculated the accuracy rate of each model with regard to the observed risk grades. For the pollen season, the first day at which the pollen concentration was observed (or predicted) to be 10 grains m−3 or higher was set as the season's starting date, while the last day in which the pollen concentration was observed (or predicted) to be 10 grains m−3 or lower was the season's ending date.
(Equation. 1)
APE=100ni=1nPiOiOi,wherePi:predictedvalue,Oi:observedvalueaair-12-149-e002

RESULTS

Pollen concentration and risk grade

Table 2 lists the MAPE results of the predicted pollen concentrations for each model in 9 cities during the test period. Lower values of MAPE correspond to better performance. The mean MAPE for 2015 was lowest in the DNN model at 5.56% and highest in the regression model at 13.57%. The mean MAPE for 2016 was lowest in the DNN model at 4.51% and highest in the SVR model. The mean of the RMSE was 48.59, 37.57 and 36.72 grains m−3 in the regression, SVR and DNN models, respectively. The mean of the MAE was 23.26, 23.14, and 17.25 grains m−3 in the regression, SVR and DNN models, respectively. In terms of the overall MAPE, RMSE and MAE, the DNN model exhibited the best performance and the regression model showed the worst performance.
Table 2

MAPEs of regression, SVR and DNN models for modeling pollen concentrations at the 9 evaluation sites in 2015 and 2016

aair-12-149-i002
Site 2015 2016
Regression SVR DNN Regression SVR DNN
Seoul 8.53 8.98 5.55 4.53 7.64 3.48
Busan 18.06 6.69 2.05 13.84 8.34 3.84
Gwangju 17.42 18.55 11.71 7.83 8.79 3.02
Daegu 17.90 10.85 4.33 5.98 7.38 2.81
Gangneung 19.54 13.89 8.80 18.29 21.42 15.39
Guri 7.06 8.58 4.37 4.42 8.14 3.20
Jeonju 13.09 13.34 7.37 5.17 8.04 2.45
Daejeon 5.11 8.01 2.89 4.15 8.15 2.83
Pohang 15.41 9.09 2.99 14.85 10.62 3.61
Average 13.57 10.89 5.56 8.78 9.84 4.51
MAPE, mean absolute percentage error; SVR, support vector regression; DNN, deep neural network.
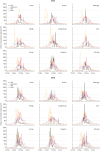
A comparison between the observed and predicted daily pollen concentrations obtained using the regression, SVR and DNN models show that the regression model predicted pollen occurrences earlier than observed, with the difference being especially strong in Busan and Pohang (Fig. 2). Furthermore, although nearly no pollen was observed in March and June, the regression model predicted pollen outbreaks in these months. The SVR and DNN models showed patterns of pollen occurrence that were more similar to observed patterns. However, the SVR model had similar pollen occurrence distributions among regions and did not express regional characteristics well. Additionally, it showed earlier start and later ending of the pollen period than the observed. The DNN model had pollen distributions that were closer to the observed distributions than either the regression or SVR models, and it expressed the characteristics of each region well. In particular, its pollen starting and ending dates and its date of highest concentration were closer to the observed values than the other models. It should be noted that there are many missing values for Gwangju in 2015 and Gangneung in 2016 owing to equipment failures, resulting in many differences between the observations and predictions and higher MAPE values than in other regions.
Fig. 2

Predicted and observed daily oak pollen concentrations during the evaluation period in 2015–2016 at the 9 sites in Korea.

OBS, observation; SVR, support vector regression; DNN, deep neural network.
aair-12-149-g002
Next, the accuracy rates of the models in predicting the pollen risk grades for the 9 observation sites from 2015 to 2016 were compared. For the mild grade, the regression model had an accuracy of 89.1%, the SVR model had an accuracy of 75.6%, and the DNN model had an accuracy of 83.1%. For the moderate grade, the regression model had an accuracy of 6.9%, the SVR model had an accuracy of 70.1%, and the DNN model had an accuracy of 33.1%. For the severe grade, the regression model had an accuracy of 13.0%, the SVR model had an accuracy of 21.1%, and the DNN model had an accuracy of 56.5%. For the extreme grade, the regression model had an accuracy of 4.5%, the SVR model had an accuracy of 0.0%, and the DNN model had an accuracy of 9.1%, i.e., all 3 models had low accuracy. However, in underestimating the extreme grade by one grade as the severe grade, the DNN model showed the best performance at 54.6% (Table 3).
Table 3

Frequencies (%) of observed and predicted pollen risk grade levels by the regression, SVR and DNN models at the 9 sites in Korea from 2015 to 2016

aair-12-149-i003
Observed risk grade Predicted risk grade
Model Mild (%) Moderate (%) Severe (%) Extreme (%) Total
Mild Regression 1,819 (89.1) 87 (4.3) 86 (4.2) 49 (2.4) 2,041
SVR 1,543 (75.6) 423 (20.7) 75 (3.7) 0 (0.0)
DNN 1,697 (83.1) 238 (11.7) 94 (4.6) 12 (0.6)
Moderate Regression 51 (58.6) 6 (6.9) 26 (29.9) 4 (4.6) 87
SVR 6 (6.9) 61 (70.1) 20 (23.0) 0 (0.0)
DNN 16 (18.4) 33 (37.9) 34 (39.1) 4 (4.6)
Severe Regression 30 (65.2) 6 (13.0) 6 (13.0) 4 (8.7) 46
SVR 3 (6.5) 33 (71.7) 10 (21.7) 0 (0.0)
DNN 6 (13.0) 12 (26.1) 26 (56.5) 2 (4.3)
Extreme Regression 8 (36.4) 5 (22.7) 8 (36.4) 1 (4.5) 22
SVR 4 (18.2) 12 (54.5) 6 (27.3) 0 (0.0)
DNN 4 (18.2) 6 (27.3) 10 (45.5) 2 (9.1)
SVR, support vector regression; DNN, deep neural network.
With the exception of the mild grade, the regression model was nearly incapable of predicting risk grades, while the SVR tended to predict severe and extreme grades as moderate grades. By contrast, the DNN model predicted the severe grade better than the other models. Overall, the regression model tended to underestimate the risk grade, the SVR model concentrated its risk grade predictions on the moderate grade, and the DNN model concentrated its risk grade predictions in the severe grade.
In terms of risk grade warning, the DNN model performed better than the other models in cases where the moderate and severe grades were estimated to be one grade higher and cases in which the extreme grade was estimated as the severe grade.

Pollen season

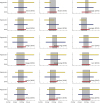
Fig. 3 shows the comparison results of the observed pollen seasons to the pollen seasons predicted by the models. The gray areas in Fig. 3 indicate the observed pollen seasons, with the lines showing pollen seasons predicted by the regression (orange), SVR (blue) and DNN (red) models. The regression model overestimated most pollen seasons and predicted longer pollen season than were observed. Particularly in Busan, its prediction diverged a great deal from the observed pollen season. The SVR model predicted shorter pollen seasons than the regression model but also overestimated by a fair amount. On the other hand, the DNN model overestimated to a lesser degree than the other models and predicted pollen seasons that were similar to the observed seasons. In 2015, the regression and SVR start dates were 26 and 27 days earlier than the observed start date, respectively, while the DNN model was 8 days early. In 2016, the regression and SVR models were on average 13 and 16 days early, respectively, while the DNN model was 4 days early. The regression and SVR models' pollen season end dates for 2015 were 36 and 21 days later than the observed end date, respectively, while the DNN model was 11 days late. In 2016 regression and SVR models were 29 and 18 days later than the observed date, respectively, while the DNN model was 7 days late. Overall, the DNN model's pollen season predictions were best.
Fig. 3

Comparison of observed (gray area) and predicted pollen seasons by the regression (yellow), SVR (blue) and DNN (red) models at the 9 sites in Korea from 2015 to 2016.

OBS, observation; SVR, support vector regression; DNN, deep neural network.
aair-12-149-g003

DISCUSSION

The most widely used pollen observation system worldwide involves manual observation through the microscope of a tape gathered from a 7-day recording volumetric spore sampler; correspondingly, there is a minimum lapse of 1 day to 1 week following the observation date before the data can be obtained. This system has disadvantages in terms of the possibility of observer-induced observation error and missing values due to observation equipment failures. Because data cannot be collected in real time, managing the observation equipment is difficult. The pollen data used in our research had many missing data points, which limited our modeling and analysis. In particular, there were much missing data for Gwangju in 2015 and Gangneung in 2016, making it difficult to verify the model. Although automatic observation systems can be used to overcome the limitations of manual observations, this can lead to other problems in the accuracy of identifying pollen species.
The automatic observation of pollen counts and concentrations primarily involves observation and analysis of data through optical equipment. Crouzy et al.23 used an ANN and support vector machine on data collected by laser beam and photo-detector to automatically observe 8 types of pollen. Oteros et al.24 automatically observed pollen by comparing the microscopic images of pollen samples collected from collection devices with 58 criteria based on an image library. Other research on automatic detection has been carried out by Kawashima et al.,25 O'Connor et al.,26 and Wagner and Macher.27
Although automatic observations can be problematic from the standpoint of pollen misclassification, they can make it possible to operate observation systems with real time monitoring. Data collected in real time can be used in prediction models. Astray et al.13 and Iglesias-Otero et al.12 used an ANN model that took the previous day's pollen concentration and weather data as input variables to improve pollen concentration prediction performance. In the present study, we tested a prototype model that uses the previous day's pollen concentration values, which were found to be very similar to observed pollen concentrations. Overall, automatic observation systems would be expected to improve the model's predictive power. However, the current set of input data without utilizing the observation data of the previous day is the best option for daily operational forecast of pollen.
The pollen concentration model in this study employs a bagging method that constructs an ensemble of DNN models for each sub-sample for which all the training data have been sampled at a fixed ratio for each risk grade. Generally, using bootstrapping or bagging in a neural network model can improve the model's performance and robustness, and the method is therefore used in a variety of deep learning models.282930313233 In this study, all of the training data were used for a single model. When the regression, SVR and DNN models were trained, they underestimated when predicting the pollen concentrations and could not model grades moderate and above. Of all the models, the DNN model underestimated the least, but the results still showed that it could not properly simulate severe and extreme grades. This suggests that the model training method used in this study is useful for data distributed unevenly toward low or high values, as were the pollen concentration data. It is also noted that more reliable results are obtained when using multi-model ensemble methods to make ensembles of various machine learning methods.
The hardest part of using a DNN model can be determining the hidden layer structure. As there is no optimal method for determining it, we chose the model's structure using heuristic methods, which require researchers to test a variety of structure combinations and therefore is time-consuming and inefficient. It is possible to use a harmony search (HS) algorithm as a more efficient method for determining DNN structures. HS is a heuristic optimization algorithm proposed by Geem34 that is often used for complex optimization problems. HS approaches optimization problems by using combinations of model parameters selected heuristically or randomly along with a harmony memory created from the loss function values of parameter combinations. Each parameter of the harmony memory is sampled randomly and loss values for new combinations are calculated to update the harmony memory with the goal of finding the parameter combination with the minimum loss value.34 Research on applying HS to neural networks has been conducted by Kulluk et al.,35 Rosa et al.36 and Papa et al.37 Using HS to optimize a DNN by using the number of hidden layers and the number of neurons in each layer as parameters is one approach to optimizing DNN structures that might be used to more efficiently determine DNN structures.
There are several limitations that should be considered while interpreting the results of this study. One is associated with the efficiency and uncertainty of pollen sampling. The pollen concentrations predicted by our pollen concentration model were classified into 4 risk grades, with the grades predicted by the DNN model showing a tendency toward overestimation. Given that the results are to be used to prevent pollen allergies, and assuming an equipment's efficiency of 90%, overestimation can be considered preferable to underestimation. Including cases in which moderate and severe grades were predicted as one grade higher, as well as cases in which an extreme grade was predicted to be severe, the DNN model had an accuracy of 77.0% for the moderate grade, 60.8% for the severe grade, and 54.6% for the extreme grade. This confirms that the pollen concentration model developed in this study can be used for pollen allergy prevention. Added to the fact that the DNN model performed best in predicting pollen seasons, these results suggest that its prediction results would be useful in effectively suppressing allergy symptoms by, for example, planning the timing of medicine use at the beginning of an allergy season.
The applicability of the DNN model is also limited by the environmental conditions of the modeling source data, as with other conventional models. For example, long-term changes in vegetation, regional and yearly variation in pollen production, and peak daily pollen concentration are not explicitly considered in the DNN model. We will have to continue monitoring daily and yearly changes in airborne pollen concentration and updating the DNN model for daily forecast.
In summary, 1) Korean oak pollen is produced in April and May, with the highest concentrations occurring at the end of April and the beginning of May. The pollen concentration distribution is uneven and has many low concentrations. Given such a distribution, there is a high possibility of pollen model underestimation. 2) A DNN model was used to map the nonlinear relationship between pollen concentrations and weather factors. To prevent the model from underestimating or over-fitting, an ensemble DNN model was constructed from 30 sub-samples of training data. To verify the model's performance, it was compared to a regression model and an SVR model trained under the same conditions. 3) Examination of the pollen concentration prediction performance over a 2015-2016 verification period revealed that the DNN had the best performance in terms of RMSE, MAE and MAPE. The DNN model's predicted pollen distributions were also the most similar to observed values. Looking at the pollen risk grade prediction performance, the regression model performed best for the mild grade while the SVR model was best for the moderate grade. The DNN model was best for severe and extreme grades. Looking at pollen allergy risk warnings, the DNN model performed the best and the regression model performed worst. 4) The DNN model produced a pollen season timing that was closest to the observations. The DNN model's start and end dates were 6 and 9 days earlier and later, respectively, than the observed dates. The regression and SVR models' start and end dates had errors of around 20 days or more with respect to the observed dates. 5) Overall, the DNN model showed the best prediction performance for pollen concentration, risk warning, and pollen season. 6) Starting in 2017, the DNN model developed in this study is used at the KMA during April and June. It provides oak pollen risk grades for each region in South Korea in the form of a digital map. Conventional regression models to predict the risk grades of pine and Japanese hop pollen grains can be upgraded using the DNN model in the future.

ACKNOWLEDGMENTS

This work was supported by the Korea Meteorological Administration Research and Development Program “Advanced Research on Biometeorology and Industrial Meteorology” under grant (1365003004). The authors appreciate the thoughtful comments and suggestions of the reviewers that improved the quality of the paper significantly.

Notes

Disclosure There are no financial or other issues that might lead to conflict of interest.

References

1. Hong SJ, Ahn KM, Lee SY, Kim KE. The prevalence of asthma and allergic diseases in Korean children. Korean J Pediatr. 2008; 51:343–350.
2. Jee HM, Kim KW, Kim CS, Sohn MH, Shin DC, Kim KE. Prevalence of asthma, rhinitis and eczema in Korean children using the International Study of Asthma and Allergies in Childhood (ISAAC) questionnaires. Pediatr Allergy Respir Dis. 2009; 19:165–172.
3. Kim HY, Kwon EB, Baek JH, Shin YH, Yum HY, Jee HM, et al. Prevalence and comorbidity of allergic diseases in preschool children. Korean J Pediatr. 2013; 56:338–342.
crossref pmid pmc
4. Kim KR, Kim M, Choe HS, Han MJ, Lee HR, Oh JW, et al. A biology-driven receptor model for daily pollen allergy risk in Korea based on Weibull probability density function. Int J Biometeorol. 2017; 61:259–272.
crossref pmid
5. Kim SH, Park HS, Jang JY. Impact of meteorological variation on hospital visits of patients with tree pollen allergy. BMC Public Health. 2011; 11:890.
crossref pmid pmc
6. Hong CS. Pollen allergy plants in Korea. Allergy Asthma Respir Dis. 2015; 3:239–254.
crossref
7. Beggs PJ. Impacts of climate change on aeroallergens: past and future. Clin Exp Allergy. 2004; 34:1507–1513.
crossref pmid
8. D'Amato G, Holgate ST, Pawankar R, Ledford DK, Cecchi L, Al-Ahmad M, et al. Meteorological conditions, climate change, new emerging factors, and asthma and related allergic disorders. A statement of the World Allergy Organization. World Allergy Organ J. 2015; 8:25.
pmid pmc
9. Kim KR, Park H, Lee H, Kim MJ, Choi Y, Oh J. Development and evaluation of the forecast models for daily pollen allergy. Korean J Agric For Meteorol. 2012; 14:265–268.
crossref
10. Grinn-Gofroń A, Strzelczak A. Artificial neural network models of relationships between Alternaria spores and meteorological factors in Szczecin (Poland). Int J Biometeorol. 2008; 52:859–868.
crossref pmid
11. Puc M. Artificial neural network model of the relationship between Betula pollen and meteorological factors in Szczecin (Poland). Int J Biometeorol. 2012; 56:395–401.
crossref pmid
12. Iglesias-Otero MA, Fernández-González M, Rodríguez-Caride D, Astray G, Mejuto JC, Rodríquez-Rajo FJ. A model to forecast the risk periods of Plantago pollen allergy by using the ANN methodology. Aerobiologia (Bologna). 2015; 31:201–211.
crossref
13. Astray G, Fernández-González M, Rodríguez-Rajo FJ, López D, Mejuto JC. Airborne castanea pollen forecasting model for ecological and allergological implementation. Sci Total Environ. 2016; 548-549:110–121.
crossref pmid
14. NIMS. Current status of pollen observational network in Korea and application of the data. Technical note series NIMS-TN-2015-011. Seogwipo: NIMS;2015.
15. Breiman L. Bagging predictors. Mach Learn. 1996; 24:123–140.
crossref
16. Efron B. Bootstrap methods: another look at the jackknife. Ann Stat. 1979; 7:1–26.
crossref
17. Efron B, Tibshirani RJ. An introduction to the bootstrap. Boca Raton (FL): Chapman and Hall/CRC;1994.
18. Hinton GE, Osindero S, Teh YW. A fast learning algorithm for deep belief nets. Neural Comput. 2006; 18:1527–1554.
crossref pmid
19. Rumelhart DE, Hinton GE, Williams RJ. Learning representations by back-propagating errors. Nature. 1986; 323:533–536.
crossref
20. Bourlard H, Kamp Y. Auto-association by multilayer perceptrons and singular value decomposition. Biol Cybern. 1988; 59:291–294.
crossref pmid
21. Hinton GE, Zemel RS. Autoencoders, minimum description length, and Helmholtz free energy. Adv Neural Inf Process Syst. 1994; 6:3–10.
22. Bengio Y, Lamblin P, Popovici D, Larochelle H. Greedy layer-wise training of deep networks. In : Schölkopf B, Platt J, Hoffman T, editors. Advances in neural information processing systems, vol. 19. Cambridge (MA): MIT Press;2007. p. 153–160.
23. Crouzy B, Stella M, Konzelmann T, Calpini B, Clot B. All-optical automatic pollen identification: towards an operational system. Atmos Environ. 2016; 140:202–212.
crossref
24. Oteros J, Pusch G, Weichenmeier I, Heimann U, Möller R, Röseler S, et al. Automatic and online pollen monitoring. Int Arch Allergy Immunol. 2015; 167:158–166.
crossref pmid
25. Kawashima S, Thibaudon M, Matsuda S, Fujita T, Lemonis N, Clot B, et al. Automated pollen monitoring system using laser optics for observing seasonal changes in the concentration of total airborne pollen. Aerobiologia (Bologna). 2017; 33:351–362.
crossref
26. O'Connor DJ, Healy DA, Hellebust S, Buters JT, Sodeau JR. Using the WIBS-4 (Waveband Integrated Bioaerosol Sensor) technique for the on-line detection of pollen grains. Aerosol Sci Technol. 2014; 48:341–349.
27. Wagner J, Macher J. Automated spore measurements using microscopy, image analysis, and peak recognition of near-monodisperse aerosols. Aerosol Sci Technol. 2012; 46:862–873.
crossref
28. Zhang J. Developing robust non-linear models through bootstrap aggregated neural networks. Neurocomputing. 1999; 25:93–113.
crossref
29. Franke J, Neumann MH. Bootstrapping neural networks. Neural Comput. 2000; 12:1929–1949.
crossref pmid
30. Ha K, Cho S, MacLachlan D. Response models based on bagging neural networks. J Interact Market. 2005; 19:17–30.
crossref
31. Granitto PM, Verdes PF, Ceccatto HA. Neural network ensembles: evaluation of aggregation algorithms. Artif Intell. 2005; 163:139–162.
crossref
32. Tiwari MK, Chatterjee C. Uncertainty assessment and ensemble flood forecasting using bootstrap based artificial neural networks (BANNs). J Hydrol (Amst). 2010; 382:20–33.
crossref
33. Wen G, Hou Z, Li H, Li D, Jiang L, Xun E. Ensemble of deep neural networks with probability-based fusion for facial expression recognition. Cognit Comput. 2017; 9:597–610.
crossref
34. Geem ZW, Kim JH, Loganathan GV. A new heuristic optimization algorithm: harmony search. Simulation. 2001; 76:60–68.
crossref
35. Kulluk S, Ozbakir L, Baykasoglu A. Self-adaptive global best harmony search algorithm for training neural networks. Procedia Comput Sci. 2011; 3:282–286.
crossref
36. In : Rosa GH, Papa JP, Marana AN, Scheirer WJ, Cox DD, editors. Fine-tuning convolutional neural networks using harmony search. 20th Iberoamerican Congress; 2015 Nov 9–12; Montevideo, Uruguay. Geneva: Springer;2015. 10. p. 683.
37. Papa JP, Scheirer W, Cox DD. Fine-tuning deep belief networks using harmony search. Appl Soft Comput. 2016; 46:875–885.
crossref
TOOLS
ORCID iDs

Yun Am Seo
https://orcid.org/0000-0001-9283-4376

Kyu Rang Kim
https://orcid.org/0000-0001-8872-6751

Changbum Cho
https://orcid.org/0000-0003-1940-7487

Jae-Won Oh
https://orcid.org/0000-0003-2714-0065

Tae Hee Kim
https://orcid.org/0000-0003-1630-0027

Similar articles