

 PDF
PDF ePub
ePub Citation
 Print
Print


INTRODUCTION
Allergic rhinitis (AR) is a common disease with a prevalence of up to 40% of the global population, and patients complain of lowered quality of life because of its unpleasant symptoms.1 Among many complaints, olfactory disturbance (OD) is relatively common and is observed in 20%-40% of patients with AR.23456 In fact, OD is one of the most important factors that determine the quality of life of the patients with AR. Nevertheless, if the physician is not fully aware of the importance of this inability, it is easy to disregard the symptoms of olfactory disturbance. Despite this, a few studies have been conducted to investigate the relationship between AR and OD.
It was thought that the main cause of OD in patients with AR is the failure of odorants to reach the olfactory epithelium because of mechanical obstruction, which is caused by the hypertrophy of the inferior turbinate. However, recent studies have suggested that sensorineural inhibition, which is caused by injuries to the olfactory epithelium, may be the cause of OD.789 Nevertheless, no functional study has been conducted to determine whether OD actually occurs in animal models of AR. Furthermore, no immunological or histological study has been conducted to determine the cause of OD in allergic individuals.
On the other hand, local allergic rhinitis (LAR) has recently been gaining attention. LAR could be defined as an intrinsic Th2-type inflammation of the nasal cavity without systemic allergen sensitization.10111213 Recently, a model of LAR, which was induced by the repeated administration of allergens into the nasal cavity without systemic sensitization, was reported in experimental animals. Therefore, it could be accepted as an animal model of LAR.1415 Therefore, we investigated whether OD also occurs in the murine model of LAR and its underlying mechanism.
Therefore, we attempted to: i) experimentally induce AR and LAR in mice and ii) prove the occurrence of OD by performing a test of olfactory function. Furthermore we aimed to: iii) evaluate the infiltration of eosinophils into the olfactory epithelium, iv) evaluate whether OD is ameliorated and whether nasal inflammation is altered after intranasal treatment with steroids, and v) evaluate the expression of olfactory marker proteins (OMPs) by performing immunofluorescent staining of the olfactory epithelium.
MATERIALS AND METHODS
Animals
Forty female BALB/c mice, which were 4 to 6 weeks old and free of murine-specific pathogens, were purchased from the Orient Bio (Seongnam, Korea). They were raised in a controlled environment, with a regular 12/12-hour light-dark cycle and ad libitum access to food and water that was free of ovalbumin (OVA). All the mice that were used in this study were handled according to a protocol that was approved by the Institutional Animal Care and Use Committee of Inha University (IACUC No. INHA 170821-510).
Experimental protocols for the treatment of the mice in each group
For the detailed experimental protocol, the methods of previous studies were followed.16171819 The mice of the control group (n = 8) were subjected to intraperitoneal (i.p.) sensitization and intranasal (i.n.) challenge with sterile saline alone. For the induction of allergic asthma and rhinitis, the mice of the AR group (n = 8) were first sensitized by an i.p. injection of 25 μg of OVA (Sigma-Aldrich, St. Louis, MO, USA) and 1 mg of aluminum hydroxide gel (alum adjuvant; ThermoFisher Scientific, Waltham, MA, USA) in 100 μL of sterile saline on days 0, 7, and 14 (thrice). After systemic sensitization, the mice were locally challenged by i.n. instillation of 500 μg of OVA into their nostrils from days 21 to 27 (7 times).
In order to prevent systemic sensitization and to induce local allergic inflammation of the nasal mucosa of only the mice in the LAR group (n = 8), only intranasal challenge with 1% OVA was performed 15 times (days 1 to 5, 8 to 12, and 21 to 25, 5 μL of OVA per nostril).14 The mice of the OD group (n = 8, total anosmia group), were subjected to an i.p. injection of methimazole once (75 mg/kg, Wako Pure Chemical Industries, Osaka, Japan). Three days later, the mice were sacrificed. Since methimazole is known to selectively destroy olfactory epithelial cells, this model was used as a positive control model of OD.20
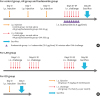
Finally, in order to assess the therapeutic effect of intranasal steroids on allergic asthma and rhinitis, an intranasal budesonide group was established. The mice of the budesonide group (n = 8) were subjected thrice to i.p. injection and 7 times to i.n. challenge with OVA as performed in the AR group. Between the 21st and the 27th days of the experiment, after 30 minutes of i.n. challenge with OVA, budesonide was administered (12.8 μg per time) into the nasal cavity.21 The protocol for the treatment of the mice of each group is summarized in Fig. 1.
Collection of serum and measurement of serum levels of total and OVA-specific immunoglobulin E (IgE)
Twenty-four hours after the last i.n. instillation with saline or OVA (and 3 days after the i.p. injection of methimazole into the mice of the OD group), the mice were sacrificed immediately. Blood was collected from the inferior vena cava. Whole blood was centrifuged at 13,000 ×g for 30 minutes at 4°C, and the supernatant (serum) was stored immediately at −80°C for further analysis.
For the analysis, the samples were diluted to 1:50. The serum levels of total IgE and OVA-specific IgE were measured using enzyme-linked immunosorbent assay (ELISA). The total IgE level was measured and compared with a mouse IgE standard (BD Biosciences Pharmingen, San Diego, CA, USA). In order to determine the serum titers of OVA-specific IgE, the plate coated OVA 200 μg/mL with IgE-capture antibody was used, and the optical density was measured at 450 nm in accordance with the protocol provided by the manufacturer.
Differential cell counts in broncho-alveolar lavage (BAL) fluid
As mice of the AR group have systemic allergies, pulmonary inflammation should also be induced. On the other hand, the pulmonary parenchyme of the LAR group should be normal, because mice in this group were induced local nasal inflammation without systemic atopy using only a small amount of OVA. To confirm that this experimental model was successfully made, we conducted a BAL fluid analysis.
In order to collect BAL fluid, the trachea was first cannulated using polyethylene tube, and then the lung was lavaged with 800 μL of Hank's balanced salt solution (HBSS; ThermoFisher Scientific) thrice. The fluid was centrifuged at 3,000 ×g for 15 minutes at 4°C, and the supernatant was stored immediately at −80°C for measuring the levels of cytokines. The resulting pellet was suspended immediately in saline for cell counting.
Total cell numbers were determined in duplicate using a hemocytometer. Subsequently, an aliquot of 100-200 μL of the BAL fluid was centrifuged in a Cytospin 2 cytocentrifuge (Shandon Scientific, Pittsburgh, PA, USA). The differential cell counts of eosinophils, neutrophils, and lymphocytes were determined from the centrifuged preparations that were stained using the Diff-Quik stain kit (Sysmex Corp., Kobe, Japan) by counting 500 or more cells from each sample at 200× magnification.
Buried-food pellet test
In order to conduct the buried-food pellet test (a test to evaluate olfactory function in laboratory animals), the protocol described by Lehmkuhl et al.
22 was followed. Briefly, all the mice were subjected to fasting 24 hours before the test. On the day of the test, fresh bedding, without any smell, was placed inside a new unused cage (in order to minimize confusion, which could be due to other odors, among the mice)., Next a food pellet was hidden at random by burying it at a depth of 1 cm under the bedding in the cage. Then, a mouse was introduced into the cage with the pellet hidden inside it, and the time taken for the mouse to detect the pellet was measured. When the mouse failed to detect the pellet for more than 15 minutes, the time was recorded as 15 minutes, and the experiment was concluded. A video of this experiment has been attached as Supplementary Videos S1 and S2.
Histopathological examination
Tissue specimens of the lungs and nasal cavity were fixed in 10% neutral buffered formalin for 24 hours. The lung tissues were washed with deionized water and then embedded in paraffin. The nasal tissues were also washed with deionized water and then, immersed in ethylenediaminetetraacetic acid solution for decalcification for 3-4 weeks. After that, they were embedded in paraffin in the same way as were the lung tissues. The tissue sections (with a thickness of 3 μm) were stained with hematoxylin and eosin (for the qualitative evaluation of histopathological changes), periodic acid-Schiff's reagent (for the staining of mucus), and Sirius red (for the evaluation of eosinophilic infiltration).
The number of eosinophils that had infiltrated into 1 mm2 of pulmonary parenchyma was counted in 20 random high-power fields (at 200× magnification). The number of eosinophils that had infiltrated into 1 mm2 of the nasal septum, turbinates, and olfactory epithelium was counted in the T2 area (the section which is immediately posterior to the upper incisors), for each sample, in 10 high-power fields (400× magnification). The histopathological examinations were performed, and the eosinophils in the tissue specimens were counted by 2 unbiased, blinded researchers.
Immunofluorescence staining
For immunofluorescence staining, the slides were washed with phosphate-buffered saline (PBS), which contained 0.1% Tween 20, and blocked with PBS/1% bovine serum albumin (BSA)/0.2% Triton X-100 for 1 hour at room temperature. Then, the tissue sections were incubated overnight with anti-OMP antibody (goat polyclonal antibody; Wako Chemicals USA, Inc, Richmond, VA, USA) at a dilution of 1:400 in PBS/0.5% BSA/0.2% Triton X-100. After washing with PBS, the slides were incubated for 1 hour at room temperature with Alexa Fluor 488-conjugated donkey anti-goat IgG (Thermo Fisher Scientific), which was diluted to 1:500 in PBS/0.5% BSA/0.2% Triton X-100. Finally, the nuclei were stained with Hoechst 33342 at a dilution of 1:2500 (ThermoFisher Scientific) at room temperature for 5 minutes, and the sections were mounted with vecta shield (VECTOR, Burlingame, CA, USA).
Statistical analysis
Nonparametric tests, such as the Kruskal-Wallis test and the Mann-Whitney U test were performed in order to compare the titers of total IgE and OVA-specific IgE, the number of inflammatory cells in the BAL fluid, the number of eosinophils that infiltrated into the pulmonary parenchyma and nasal cavity, and the results of the buried-pellet test. A P value of < 0.05 was considered statistically significant.
RESULTS
The serum concentrations of total and OVA-specific IgE were significantly higher in the AR group than in the control group (P < 0.01). On the other hand, there was no significant difference in IgE concentration between the LAR and OD groups and the control group. The serum levels of total and OVA-specific IgE in the intranasal budesonide group tended to decrease after treatment, compared with that of the AR group; however, this difference was not statistically significant (p > 0.05, Fig. 2).
 | Fig. 2Serum levels of (A) total IgE and (B) OVA-specific IgE.IgE, immunoglobulin E; OVA, ovalbumin; AR, allergic rhinitis; LAR, local allergic rhinitis; OD, olfactory disturbance.
*Statistically significant difference from the control group, P < 0.01; †Statistically significant difference from the AR group, P < 0.01; the Kruskal-Wallis and Mann-Whitney U tests.
|
The analysis of the BAL fluid revealed that the levels of inflammatory cells, such as eosinophils, neutrophils, and lymphocytes, were significantly highe in the AR group than in the control group (P < 0.01 for all cell types). On the other hand, there was no significant increase in the number of inflammatory cells in the BAL fluid of the LAR group. Therefore, it is suggested that the inflammation of the pulmonary parenchyma could be minimal after LAR induction (by intranasal challenge only). After the intraperitoneal injection of methimazole, there was no significant difference in the number of eosinophils in the BAL fluid between the OD, and control groups. On the other hand, the number of neutrophils and lymphocytes was significantly higher in the OD group than in the AR group (P < 0.05). Finally, in the intranasal budesonide group, the levels of eosinophils and lymphocytes were moderately lower, and that of neutrophils, slightly higher than those of the AR group; however, no statistical significance was demonstrated (P > 0.05, Fig. 3).
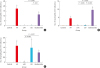 | Fig. 3Number of inflammatory cells (eosinophils, neutrophils, and lymphocytes) in the BAL fluid.BAL, broncho-alveolar lavage; AR, allergic rhinitis; LAR, local allergic rhinitis; OD, olfactory disturbance.
*Statistically significant difference from the control group, P < 0.05; †Statistically significant difference from the control group, P < 0.01; ‡Statistically significant difference from the AR group, P < 0.01; the Kruskal-Wallis and Mann-Whitney U tests.
|
Compared with the mice of the control group (35.6 ± 12.2 seconds), those of the AR (81.3 ± 19.8 seconds) and LAR groups (66.2 ± 12.7 seconds) took significantly longer periods of time to detect the pellets that were buried under the bedding (P < 0.01). However, compared with the OD group (710.4 ± 259.6 seconds), which was the positive control group for OD, the time delay until the pellet detection by the mice of the AR and LAR groups was relatively small (P < 0.01). Finally, after treatment, the time taken by the mice of the intranasal budesonide group to detect the pellet was significantly reduced, compared with the time taken by the mice of the AR and LAR groups (35.8 ± 11.9 seconds, P < 0.01). It is noteworthy that the mice of the intranasal budesonide group could detect the pellet as rapidly as did the mice of the control group (Fig. 4).
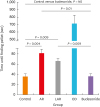 | Fig. 4Time until the hidden-food pellet detection as measured by the “buried-food pellet test.”NS, not significant; AR, allergic rhinitis; LAR, local allergic rhinitis; OD, olfactory disturbance.
|
The infiltration of inflammatory cells into the lung parenchyma was significantly higher in the AR group than that of the control group (P < 0.01). Therefore, it could be confirmed that asthma was induced simultaneously in the AR group. On the other hand, there was no significant difference in the lung tissues between the LAR (without systemic sensitization) and OD groups (not related to allergy) and the control group. The infiltration of inflammatory cells into the lung parenchyma of the intranasal budesonide group was significantly reduced after treatment compared with that in the AR group, which was also statistically significant (P < 0.05, Fig. 5). Next, the histological changes in the nasal tissues were examined. There was considerable goblet cell hyperplasia and active mucus secretion in the nasal septa of the AR group compared with that of the control group. The epithelial cells of the turbinate tissues were moderately damaged. In the LAR group, hyperplasia was also observed in the goblet cells of the nasal septum; however, the damage to the epithelial layers of the turbinate tissues was relatively mild. No significant change was observed in the nasal septa of the OD group, compared with those of the control group; however, the epithelial layers of the turbinate tissues were severely damaged. Finally, there was a statistically significant improvement in the proliferation of goblet cells in the nasal septa and damage to the epithelial layers in the turbinate regions of the budesonide group compared with those of the AR group (P < 0.05, Fig. 6).
 | Fig. 5Histopathological examination of the lung parenchyma (A) and the number of eosinophils that infiltrated into 1 mm2 of the lung parenchyma (B).AR, allergic rhinitis; LAR, local allergic rhinitis; OD, olfactory disturbance; H&E, hematoxylin and eosin; PAS, periodic acid Schiff.
*Statistically significant difference from the control group, P < 0.01; †Statistically significant difference from the control group, P < 0.001; ‡Statistically significant difference from the AR group, P < 0.001; the Kruskal-Wallis and Mann-Whitney U tests (scale bar = 200 μm).
|
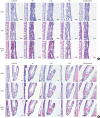 | Fig. 6Histopathological examination of the (A) nasal septa and (B) turbinate tissues (scale bar = 50 μm).AR, allergic rhinitis; LAR, local allergic rhinitis; OD, olfactory disturbance; H&E, hematoxylin and eosin; PAS, periodic acid Schiff.
|
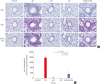
Hematoxylin and eosin staining revealed some damage to the olfactory epithelia of the AR group compared with those of the control group. The olfactory epithelia of the LAR group also showed some degree of damage, and the damage to the epithelia of the AR and LAR groups was considerably less than that of the OD group (the positive control with completely destroyed olfactory epithelium). The lesions in the olfactory epithelia of the intranasal budesonide group were ameliorated moderately after treatment (Fig. 7).
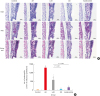 | Fig. 7Histopathological examination of the olfactory epithelia (A) and the number of eosinophils that infiltrated into 1 mm2 of the olfactory epithelia (“mucosa” is better. In sirius staining, positive cells are in submucosa area.) (B).AR, allergic rhinitis; LAR, local allergic rhinitis; OD, olfactory disturbance; H&E, hematoxylin and eosin; PAS, periodic acid Schiff.
*Statistically significant difference from the control group, P < 0.001; †Statistically significant difference from the AR group, P < 0.001; the Kruskal-Wallis and Mann-Whitney U tests (scale bar = 50 μm).
|
In the control group, since OMP expression in the olfactory epithelia was normal, it appeared as strong green color (fluorescein isothiocyanate; FITC) in the epithelial layers (Fig. 8, first column).However, in the AR and LAR groups, OMP expression was markedly suppressed by the nasal allergic inflammation (second and third columns). In the OD group, the olfactory epithelia were almost completely destroyed after methimazole administration, and OMP expression was negligible. Finally, OMP expression in the intranasal budesonide group was substantially restored by the treatment with intranasal budesonide.
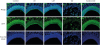 | Fig. 8Expression of OMP by immunofluorescent staining. FITC was used for the conjugation with the secondary antibody against anti-OMP antibody (green color).OMP, olfactory marker protein; FITC, fluorescein isothiocyanate; AR, allergic rhinitis; LAR, local allergic rhinitis; OD, olfactory disturbance.
|
DISCUSSION
In this study, we intended evaluate whether the experimental animal model (AR/LAR/OD) is well established in each group. In the AR group, not only the serum levels of total and OVA-specific IgE, but also the various inflammatory cells, such as eosinophils, neutrophils, and lymphocytes in the BAL fluid, were significantly higher. The histological examination of the lungs and nasal cavity revealed significantly higher inflammatory cell infiltration. Thus, we could consider this group as typical murine models of AR. On the other hand, in the LAR group, no systemic findings (increased serum IgE level, and a high number of inflammatory cells in the BAL fluid and lung parenchyma) were observed. On the other hand, significantly high inflammatory cell infiltration was observed only in the nasal cavity. Therefore, we concluded that LAR was well induced as reported in previous studies.1415 Methimazole is a drug that selectively destroys the olfactory epithelium. Since the action of methimazole is not related to allergies, all the indicators of allergy were not elevated in the OD group compared with the control group. Finally, in the intranasal budesonide group, serum IgE levels, and the number of inflammatory cells in the BAL fluid and lungs (which are related to systemic allergies) tended to decrease as a whole; however, it was not statistically significant. This is presumably because budesonide was administered intranasally rather than intraperitoneally; therefore, the systemic effect was moderately weak. However, the infiltration of inflammatory cells into the nasal cavity decreased significantly in the intranasal budesonide group compared with the AR group.
Next, we attempted to compare the results of the olfactory function test (measured as the time taken to detect the pellet that was buried under the bedding) for each group to compare the degree of OD. It was found that the time taken for pellet detection was significantly higher in the AR and LAR groups than in the control group. To the best of our knowledge, our study is the first to functionally evaluate the degree of OD in live animals with induced AR and LAR. However, the degree of OD was much lower than that in the OD group mice, whose olfactory epithelia were totally destroyed and total anosmia was induced. This is consistent with the findings of previous clinical trials. According to Guss et al.,23 48% of all 31 patients with allergic rhinitis complained of OD. However, none of them complained of total anosmia, and OD was not severe. Apter et al.
2425 also reported that OD was less severe in patients with allergic rhinitis than in those with chronic rhinosinusitis. Some studies have also suggested that patients with persistent, moderate-to-severe AR mainly complain of hyposmia.26
OD was significantly ameliorated in the intranasal budesonide group compared with the untreated AR and LAR groups, and was quite comparable with the control group. This implies that treatment with intranasal steroids could effectively alleviate OD in patients with AR. These findings are also in good consistency with those of previous clinical studies on patients. The results of the odor threshold test improved considerably when intranasal mometasone furoate was administered to patients with AR for 2 weeks.26
The observation of the olfactory epithelia revealed that eosinophilic infiltration was significantly higher in the AR and LAR groups than in the control group. On the other hand, eosinophilic infiltration in the intranasal budesonide group had decreased significantly. Kern27 have shown that in the biopsy samples of the olfactory mucosa of patients with chronic rhinosinusitis, the infiltration of inflammatory cells into the olfactory mucosa was high, while the thickness of the olfactory epithelium was low. Rhee et al.28 suggested that the frequency of complaints of OD increases with increasing severity of the symptoms of AR. There is also a report that in patients with seasonal AR, OD is more severe during allergy seasons than during “non-allergy” seasons.29 In another study, patients with seasonal AR reported no anosmia; however, patients with perennial AR reported anosmia of up to 20%.30
According to our extensive review of the literature, our study is the first to evaluate changes in OMP expression in the olfactory epithelia of animal models of AR and LAR. It could be confirmed that OMP expression was significantly suppressed in the AR and LAR groups compared with the control group. Also, the decrease in OMP expression was not particularly substantial, compared with that of the OD group. These results are quite consistent with those of the buried-food pellet test, which were better in the AR and LAR groups than in the OD group. In the intranasal budesonide group, OMP expression was restored after the intranasal steroid treatment. This was also consistent with the fact that the result of the buried pellet test for the intranasal budesonide group was almost normal and comparable with that of the control group, i.e., olfactory function was normal. Thus, we suggest that nasal allergic inflammation reduces OMP expression substantially; however, it can be restored through intranasal steroid treatment. In addition, the restoration of OMP expression is closely related to functional recovery.
It has been speculated that the increased apoptosis of olfactory sensory neurons could be the cause of OD in patients with AR.31 However, there is a lack of research studies that support this hypothesis. Epstein et al.32 reported that the thickness and apoptotic index of the olfactory epithelium decreased and increased, respectively, after the intraperitoneal and intranasal administration of fungal antigens (extract of Aspergillus fumigatus antigens) to C57BL/6 mice. However, the antigen used and the experimental protocol in our study are quite different from those of Epstein's study. Moreover, they did not evaluate functional aspects, such as olfactory function.
Through this study, we discovered that there is a significant correlation between our results using animal models of AR and LAR and those of the previously conducted clinical studies. Therefore, Using animal models could be beneficial for studing the relationship between AR and OD. Hence, more research based on this model is required. For example, studies have shown that the frequency of OD is higher in patients with perennial AR than in those with seasonal AR.330
The study on OD in LAR is the first one based on our extensive review of the literature. We have already published the results of clinical studies on the clinical features and treatment outcomes of patients with LAR.133334 Compared to the AR group, the LAR group had less nasal inflammation (less eosinophilic infiltration in olfactory mucosa). On the other hand, both groups showed similar degrees of OD (similar time on the buried pellet test).
In conclusion, OD is caused by the infiltration of eosinophils into the olfactory epithelium and suppressed OMP expression, which were observed in the animal models of AR and LAR, and it could be reversed by intranasal steroid treatment.

 XML Download