Journal List > J Lipid Atheroscler > v.8(2) > 1137026

Lee and Lim: Mendelian Randomization Analysis in Observational Epidemiology

Abstract

Mendelian randomization (MR) in epidemiology is the use of genetic variants as instrumental variables (IVs) in non-experimental design to make causality of a modifiable exposure on an outcome or disease. It assesses the causal effect between risk factor and a clinical outcome. The main reason to approach MR is to avoid the problem of residual confounding. There is no association between the genotype of early pregnancy and the disease, and the genotype of an individual cannot be changed. For this reason, it results with randomly assigned case-control studies can be set by regressing the measurements. IVs in MR are used genetic variants for estimating the causality. Usually an outcome is a disease and an exposure is risk factor, intermediate phenotype which may be a biomarker. The choice of the genetic variable as IV (Z) is essential to a successful in MR analysis. MR is named ‘Mendelian deconfounding’ as it gives to estimate of the causality free from biases due to confounding (C). To estimate unbiased estimation of the causality of the exposure (X) on the clinically relevant outcome (Y), Z has the 3 core assumptions (A1-A3). A1) Z is independent of C; A2) Z is associated with X; and A3) Z is independent of Y given X and C; The purpose of this review provides an overview of the MR analysis and is to explain that using an IV is proposed as an alternative statistical method to estimate causal effect of exposure and outcome under controlling for a confounder.

INTRODUCTION

One of an analytical approach to establish the causal relationships of observed associations between a modifiable exposure or potential risk factor and a clinically relevant outcome is Mendelian randomization.1 Randomized controlled trials (RCTs) generalize the observed results from a sample obtained through sampling to reduce bias in the planning phase and establish causal relationship. The main goal of statistics is to infer the characteristics of the populations of interest based on the information obtained from the sample. The rationale of this reasoning is the randomization concept like random assignment.2 However, this is difficult to do in observational epidemiological studies.
The ‘gold standard’ for empirically testing scientific hypotheses in clinical research is a RCT. This design involves randomly assigning different treatments to experimental units (e.g., individuals) of a population. In the simplest form, one ‘active group’ (e.g., intervention on a risk factor) is compared against a ‘control group.’3
Making inferences about causal effects based on data from observational study using instrumental variables (IVs) as genetic variants is known as Mendelian randomization. Mendelian randomization is named ‘Mendelian deconfounding’ because it aims to provide an estimate of causality free from biases caused by confounding.4 Mendelian randomization was first proposed by Gray and Whitley in 1986 and is a method of estimating the causality of a disease without prior randomization. Recently, Mendelian randomization is used to estimate causality of genetic products. Because genetic polymorphism is conceptually randomized, that is, the genotype of individual cannot be changed and interpersonal covariates are perfectly balanced among people with theoretically different polymorphisms. Thus, an approach to Mendelian randomization was created to theoretically eliminate all confounding about any relationship between genetic polymorphism and disease.56
One area of recent research in which Mendelian randomization analysis have studied at coronary heart disease or cardiovascular disease789 and the causality between lipid metabolism and insulin resistance using Mendelian randomization with pleiotropy and lack of information on genotype and ethnicity.10 Mendelian randomization is a good design to control reverse causation and confounding, which are often encountered in epidemiological studies. In other words, it is a method to test or estimate the causal effect from observation data with confounding.10
In epidemiological studies, it is not easy to see if a particular disease and its potential risk factors influence it. Observational epidemiological studies are not easy to observe results while mediating on exposure, such as RCTs.
It is difficult to say that the genetic variation of an individual inherited from his or her parents is completely random, but it can be assumed that the genetic variation of a population is distributed randomly in exposure, which is a potential risk factor for a particular result (a disease of interest). Thus, the Mendelian random assignment method was attempted to address these limitations. In observational epidemiological studies, it always looks for a complete approach to assess causality with the goal of simulating random contrast tests in observational studies. One special example that can be observed with this complete randomization is the case of Mendelian randomization in genetic epidemiology.11

OBSERVATIONAL STUDY LIMITATION

Types of observational studies include cohort studies, case-control studies, and cross-sectional studies. From the point of view of Mendelian randomization studies, prospective cohort studies define disease of interest and observe what phenotype is formed when tracking down the population groups being studied. In addition, in the case-control study, the patients were divided into 2 groups according to their phenotype.
The limitations of the observational study are as follows: X is the cause of Y, but Y is the cause of X. The reverse causation is such that the measured value is used in the retrospective observation study, or difficulty in controlling confounders. There is also a limit to uncertainty about the sequential occurrence of diseases or the difficulty in following up the occurrence of events. In addition, for phenotypes with low incidence, statistical test may be difficult when the sample size is small.

MENDELIAN RANDOMIZATION

The method of using an IV has been used in economics,12 but it has also been introduced and used in recent epidemiological studies. Mendelian randomization studies using instruments can avoid the limitation of observational studies. Issues such as generalization, feasibility, ethics and high budget, which are the limitations of RCTs research, make Mendelian randomization more attractive.1314
Mendelian randomization is a method of testing causal effects from observational data with potential risk factors or allowing them to be evaluated in certain disease. Assuming that mate selection is not associated with the genotype. Since genetic types are randomly assigned when transmitted from parent to offspring in the meiosis process, population genetic distributions are typically associated with confounding factors that adversely affect observational epidemiologic studies. In this regard, Mendelian randomization can be considered a naturally RCT. Because a polymorphism is an IV, Mendelian randomization relies on previous genetic associations to provide good candidate genes for response to intermediate phenotype.
Mendelian randomization is the using genetic variants in non-experimental design to infer causality about an exposure effect on an outcome.3
Mendelian randomization may also be used to identify causality in epidemiological studies. Some examples of Mendelian randomization are shown in Table 1 with the exposure and outcome by type of exposure.
Table 1

Epidemiological evidence for causal relationships assessed by Mendelian randomization

jla-8-67-i001
Exposure type Exposure Outcome
Dietary factors Milk intake Problem of metabolic syndrome15
Caffeine intake Occurrence of still birth16
Alcohol intake Increased blood pressure17
Physical characteristics Body mass index Early menarche18
Body fat mass Academic achievement19
Inter-generational effect Intrauterine folate Neural tube defects20
Biomarkers CRP Elevated adiposity21
CIMT22
Cancer23
Insulin resistance, increased triglycerides, and HDL cholesterol24
Apolipoprotein E Cancer25
Homocysteine Homocysteine concentration increases stroke26
Pathological conditions Mental health problems such as ADHD, depression and obesity. Lower educational achievement27
CRP, C-reactive protein; CIMT, carotid intima-media thickness, cholesterol; HDL, high-density lipoprotein; ADHD, attention deficit hyperactivity disorder.

NOTATION AND GLOSSARY FOR MENDELIAN RANDOMIZATION

The word “exposure (X)” throughout this paper represents risk factors, an intermediate phenotype, which can be a biomarker or potential risk factor that may affect the outcome (Y, disease). IVs (Z) in Mendelian randomization analysis are used genetic variants for estimating the causality. The choice of the genetic variable as IV (Z) is essential to a successful in Mendelian randomization analysis. Mendelian randomization is named ‘Mendelian deconfounding’ as it gives to estimate of the causality free from biases due to confounding (C). Before introducing more detail concepts required to establish IVs, there are shown in some notation and glossary in Table 2.
Table 2

Some notation and glossary used in Mendelian randomization approach

jla-8-67-i002
Glossary Notation Explanation
Causality - The relationship between cause and effect. It is a genetic association of phenomena through which a cause under certain conditions gives rise to, causes the effect.
Confounding C A confounding variable is a variable which can cause the disease under study and is associated with the exposure of interest. This means a confounder of the X–Y association in this paper.
GWAS - GWAS uses the term genome-wide to explore the entire genome.
It is an observational study of a set of genetic variants throughout the genome in different individual to see which variant is associated with the trait. GWAS can apply equally to all other genetic variants and other living things, although it generally focuses on the association between characteristics such as SNP and major human diseases.
Genotype - It is the set of genes in DNA which is responsible for a particular trait.
Genotyping - Genotype analysis, diagnosing diseases caused by genetic modification, and providing information on the development of treatments. SNP analysis plays an important role in genetic analysis, enabling understanding of and prevention of genetic diseases and the development of customized drugs.
Instrumental variable Z Instrument.
It is used to estimate causal relationships when controlled experiments are not feasible or when a treatment is not successfully delivered to every unit in a randomized experiment.
Linkage disequilibrium - It is the non-random association of alleles at different loci in a given population. Loci are said to be in linkage disequilibrium when the frequency of association of their different alleles is higher or lower than what would be expected if the loci were independent and associated randomly.
Penotype X It is the physical expression/characteristics of that trait.
This means an exposure in this paper: the risk factor (or protective factor, or intermediate phenotype) of interest
SNP - A single gene polymorphism, one or dozens of base variants that represent individual deviation out of the 3 billion base sequences held by chromosomes.
Outcome Z Result. This means a targeted disease in this paper.
Reverse causation - It refers either to a direction of cause-and-effect contrary to a common presumption or to a 2-way causal relationship in, as it was a loop.
GWAS, genome-wide association study; SNP, single nucleotide polymorphism.

EXPLANATION OF VARIABLES

It is easy to understand some statistical terms for Mendelian randomization analysis: confounders and instrument variables. Let the IV is Z, the variable that represents the cause is X, and the variable Y is the outcome or disease. When it needs to confirm that Y is affected by X, a variable Z can be added to the model that affects only X and does not affect Y. Then X is a causal variable that really affects Y. The variable Z used at this time is called the IV. Fig. 1 is reflected the conceptual description of the Mendelian randomization with 3 core assumptions (A1, A2, and A3).
Fig. 1

Conceptual description of the Mendelian randomization. (A) A1: Z is independent of C. A2: Z is associated with X; (B) Z is independent of Y given X and C.

jla-8-67-g001

IVs

Mendelian randomization can be called random allocation using the genetic variants as IVs for assessing the causal effect of the exposure on the outcome.2829
IVs are associated with exposure, but are not associated with confounding variables of exposure-outcome associations, nor are causal pathway to outcome other than exposure.30
Let Z be the IV or instrument. It is associated with exposures (X), also called risk factors or intermediate phenotype but not associated with an outcome (Y) except through its association with exposures (X).
The choice of genetic variants as IV (Z) plays an important role to success Mendelian randomization.1 The genetic IV can be identified by searching published databases or reports estimating genetic associations with an exposure of interest. Genome-wide association study (GWAS) has been used for Mendelian randomization analysis over the past decade.31

SELECTION PROCESS AND CORE ASSUMPTIONS OF IVs

The most important consideration is the validation of genetic variants to be used as an IV in Mendelian randomization. Genotyping should be done to diagnose diseases caused by genetic variants and provide information on the development of treatments. Genotyping plays an important role in genetic analysis, which enables understanding and prevention of genetic diseases and development of personalized medicine. Before studying Mendelian randomization, it is necessary to choose the single nucleotide polymorphisms (SNPs) that define and affect diseases of interest. For example, a GWAS is a research method that collectively explores the genetic factors of disease and drug reactivity. The results of the GWAS research are reported in the National Human Genome Research Institute. It is listed in the GWAS catalog (https://www.ebi.ac.uk/gwas).3233
In order to be used as IVs (SNPs), the following 3 assumptions must be satisfied. The following assumptions can be validated by statistical methods, but above all, validity should be considered in using specific genetic variants as an IV.34 Fig. 1 shows this graphical concept.
  • A1) IV (Z, SNP) should be related to exposure (X, phenotype).

  • A2) IVs (Z, SNPs) should not be directly related to any confounding (C). That is, IV (Z, SNP) should be unrelated to any other risk factor/confounding (C) that may affect the outcome variable (Y, disease).

  • A3) IVs (Z, SNPs) should not have a direct association with outcome (Y, disease).

However, the A2 is often considered fulfilled because of the randomization of alleles to gametes.35
The A3 have also been proposed to address specific threats for statistical test.36
An overview of selected issues that can lead to the deviation of the 3 core assumptions (A1–A3) is provided in Table 3.137
Table 3

Selected issues to inference from Mendelian randomization

jla-8-67-i003
Specific research field Issues Comments
Biological mechanisms Pleiotropy It occurs when genetic variants are associated with many kinds of risk factors.
Canalization A biological compensatory mechanism that adapts to changes caused by genetic variation and does not reflect the effects of the actual expected genetic variants.
Non-Mendelian inheritance Linkage disequilibrium Other variables that are associated with the genetic variants used as an IV affect the outcome.
Effect modification When confounding occurs due to some specific third-party variable for the relationship between an IV and a potential exposure.
Population effects Population stratification The population included in the study is divided into distinct subpopulations.
Ascertainment effects The fraction of a genetic variants of the population included in the study is different from that of the real population, and also if specific results in the study design have a reverse causation.
IV, instrumental variable.

EXPLANATION OF IVs

Each of the 3 assumptions of an IV can be interpreted as follows;
  • A1) The genetic variants as an IV (Z) must be related to the exposure (X, phenotype). The stronger the association, the more likely the difference in the exposure depending on the subgroup (genotype) of the IV (Z).

  • A2) The distribution of demographic and confounding should not differ by genotype as IV (Z, SNPs).

  • A3) The conditional independence of the exposure (X, phenotype) and the confounding (C) of the exposure and results shall be satisfied.

STATISTICAL ANALYSIS IN GWAS

In GWAS, the objective of statistical analysis is to estimate and test. First of all, distribution and statistical test are carried out by using graphs, tables, and statistics for demographics and potential risk factors according to genotypes of SNP used as IVs. The odds ratio (OR) is estimated for the difference in the genetic frequency of SNP locus in GWAS, mainly for the patients and normal, or a large number of SNP locus are tested for the contingency table. If the environmental factors of the comparison target group differ, a regression model is used to describe environmental factors, such as age and gender, other than the SNP locus by introducing a statistical model. In addition, analysis of variance is performed to show an association between potential risk factors and IVs and various statistical analyses are carried out including the analysis of survival time and a machine learning model.

ASSOCIATION

Whether an exposure (X) and an outcome (Y) are interrelated, it needs to check the observational association. If there are predictive factors to confirm the association between X and Y, it can be analyzed by adjusting them as covariates. If a variable transformed is been made for a potential exposure (X) when checking the association with outcome (Y), then X used for Mendelian randomization analysis should be analyzed with the same variable transformed.
A relative risk is used in prospective cohort study and clinical trials as a measure of association and OR is used in retrospective case-control study.

R FUNCTIONS FOR MENDELIAN RANDOMIZATION

Yavorska and Staley38 described R program package available for the Mendelian randomization in R program version 3.0.1 or later using summarized data. This description expressed several methods for conducting Mendelian randomization with summarized data on summarized genetic associations between exposure and outcome was obtained from a consortium. This can be used to obtain causality using IV. Some useful functions are described in Table 4.39
Table 4

R functions for Mendelian randomization

jla-8-67-i004
Function Description/example of usage
mr_allmethods Description The mr_allmethods function uses summary data to implement Mendelian randomization analysis to calculate estimates (as well as standard error and confidence interval limits) for all methods in the package (or selected group of methods).
Usage mr_allmethods(object, method = "all")
mr_conmix Description Contamination mixture method for robust and efficient estimation under multiple validity assumptions.
Usage mr_conmix(object, psi = 0, CIMin = NA, CIMax = NA, CIStep = 0.01, alpha = 0.05)
mr_egger Description The mr_egger function implements the MR-Eggger method introduced by Bowden et al (2015). This method is 1) directional bleed test (MR-Egger intercept test), 2) causal relationship test, 3) causal relationship evaluation. If the intercept period differs from zero, the genetic variation is not a valid tool variable and the standard estimation is biased. When the InSIDE (Instrument Strength Independent of Direct Effect) assumption is established, the MR-Egger slope parameter provides a consistent estimate of the causal effect even when the cause effect is different from zero.
Usage mr_egger(object, robust = FALSE, penalized = FALSE, correl = FALSE, distribution = "normal", alpha = 0.05, ...)
mr_hetpen Description Heterogeneity-penalized model-averaging method for efficient modal-based estimation.
Usage mr_hetpen(object, prior = 0.5, CIMin = -1, CIMax = 1, CIStep = 0.001, alpha = 0.05)
mr_input Description The mr_input function is required to enter and format the data to be used by the evaluation function provided in this package. The RInput class with the function output can also be viewed graphically using the mr_plot function.
Usage mr_input(bx = 0, bxse = 0, by = 0, byse = 0, correlation = matrix(), exposure = "exposure", outcome = "outcome", snps = "snp", effect_allele = NA, other_allele = NA, eaf = NA)
mr_ivw Description The mr_ivw function implements a reverse dispersion method, known informally as the "Toby Johnson" method. If you use a single genetic variation, it's just a ratio method.
Usage mr_ivw(object, model = "default", robust = FALSE, penalized = FALSE, weights = "simple", psi = 0, correl = FALSE, distribution = "normal", alpha = 0.05, ...)
mr_maxlik Description The mr_maxlik function implements the maximum likelihood method introduced by Burgess et al (2013).
Usage mr_maxlik(object, model = "default", correl = FALSE, psi = 0, distribution = "normal", alpha = 0.05, ...)
mr_mbe Description The mr_mbe function implements mode-based methods introduced by Hartwig, Bowden, and Davey Smith (2017).
Usage mr_mbe(object, weighting = "weighted", stderror = "simple", phi = 1, seed = 314159265, iterations = 10000, distribution = "normal", alpha = 0.05)
mr_median Description The mr_median function implements the weighted median (default) or simple median method introduced by Borden (Bowden) et al. (2016) to calculate the median of the evaluated tool variable estimate using each genetic variation individually.
Usage mr_median(object, weighting = "weighted", distribution = "normal", alpha = 0.05, iterations = 10000, seed = 314159265)
mr_ mvegger Description The mr_mvegger function performs multivariate Mendelian arbitrary arbitrary randomization through the MR-Egger method. This is achieved by multivariate weighted linear regression.
Usage mr_mvegger(object, orientate = 1, correl = FALSE, distribution = "normal", alpha = 0.05)
mr_ mvinput Description The mr_mvinput function is required to enter and format data for use with the multivariate Mendelian arbitrary waveform function provided in this package.
Usage mr_mvinput(bx = matrix(), bxse = matrix(), by = 0, byse = 0, correlation = matrix(), exposure = "exposure", outcome = "outcome", snps = "snp", effect_allele = NA, other_allele = NA, eaf = NA)
mr_ mvivw Description The mr_mvivw function performs multivariable Mendelian arbitrary randomization through the inverse-variance method. This is achieved by multivariate weighted linear regression.
Usage mr_mvivw(object, model = "default", correl = FALSE, distribution = "normal", alpha = 0.05, ...)
mr_ plot Description The mr_plot function has two functions. It can generate visual representations of both MRInput and MRAll objects.
Usage mr_plot(object, error = TRUE, line = "ivw", orientate = FALSE, interactive = TRUE, labels = FALSE)

DISCUSSION

Although Mendelian randomization appears to be a perfect epidemiological approach to directly estimating the causal effect, but there are still limitations and assumptions in its application, as there are limitations in all research designs, including randomized controlled studies. The estimation and test of the magnitude of the causality is not always of interest or may not be available but still Mendelian randomization can be used to evaluate whether a causality. There are still the wider areas in genetic epidemiology and it should be considered methodological developments in Mendelian randomization using genetic variants as IVs.

CONCLUSION

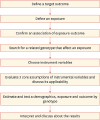
A study using Mendelian randomization can be carried out in accordance with the procedure in Fig. 2 as a checklist. A well designed Mendelian randomization study which satisfies the assumptions often provides more reliable evidence than a conventional observational epidemiology study. But the findings must be careful when interpreting the results and compared with existing evidence from different study. It is very important to check whether the assumptions satisfying a Mendelian randomization analysis and a valid instrumental variable might not be available for any research because of lack of knowledge. Moreover, the relevance of the results for clinical decisions should be interpreted in light of other sources of evidence.
Fig. 2

Flow chart of process for Mendelian randomization analysis.

jla-8-67-g002

Notes

Funding None.

Conflict of Interest The authors have no conflicts of interest to declare.

References

1. Sekula P, Del Greco M F, Pattaro C, Köttgen A. Mendelian randomization as an approach to assess causality using observational data. J Am Soc Nephrol. 2016; 27:3253–3265.
crossref
2. Lim CY, In J. Randomization in clinical studies. Korean J Anesthesiol. 2019; 72:221–232.
crossref
3. Burgess S, Thompson SG. Mendelian randomization: methods for using genetic variants in causal estimation. Boca Raton (FL): CRC Press;2015.
4. Tobin MD, Minelli C, Burton PR, Thompson JR. Commentary: development of Mendelian randomization: from hypothesis test to ‘Mendelian deconfounding’. Int J Epidemiol. 2004; 33:26–29.
crossref
5. Gray R, Wheatley K. How to avoid bias when comparing bone marrow transplantation with chemotherapy. Bone Marrow Transplant. 1991; 7:Suppl 3. 9–12.
6. Wheatley K, Gray R. Commentary: Mendelian randomization--an update on its use to evaluate allogeneic stem cell transplantation in leukaemia. Int J Epidemiol. 2004; 33:15–17.
crossref
7. Jansen H, Samani NJ, Schunkert H. Mendelian randomization studies in coronary artery disease. Eur Heart J. 2014; 35:1917–1924.
crossref
8. Ference BA, Yoo W, Alesh I, Mahajan N, Mirowska KK, Mewada A, et al. Effect of long-term exposure to lower low-density lipoprotein cholesterol beginning early in life on the risk of coronary heart disease: a Mendelian randomization analysis. J Am Coll Cardiol. 2012; 60:2631–2639.
crossref
9. Bu SY. Genetically mediated lipid metabolism and risk of insulin resistance: insights from Mendelian randomization studies. J Lipid Atheroscler. 2019.
crossref
10. Smith GD. Mendelian randomization for strengthening causal inference in observational studies: application to gene × environment interactions. Perspect Psychol Sci. 2010; 5:527–545.
crossref
11. Greenland S. An introduction to instrumental variables for epidemiologists. Int J Epidemiol. 2000; 29:722–729.
crossref
12. Wright S. Appendix. In : Wright PG, editor. The tariff on animal and vegetable oils. New York (NY): Macmillan;1928.
13. Goldberger AS. Structural equation methods in the social sciences. Econometrica. 1972; 40:979–1001.
crossref
14. Ogbuanu IU, Zhang H, Karmaus W. Can we apply the Mendelian randomization methodology without considering epigenetic effects? Emerg Themes Epidemiol. 2009; 6:3.
crossref
15. Almon R, Alvarez-Leon EE, Engfeldt P, Serra-Majem L, Magnuson A, Nilsson TK. Associations between lactase persistence and the metabolic syndrome in a cross-sectional study in the Canary Islands. Eur J Nutr. 2010; 49:141–146.
crossref
16. Bech BH, Autrup H, Nohr EA, Henriksen TB, Olsen J. Stillbirth and slow metabolizers of caffeine: comparison by genotypes. Int J Epidemiol. 2006; 35:948–953.
crossref
17. Chen L, Smith GD, Harbord RM, Lewis SJ. Alcohol intake and blood pressure: a systematic review implementing a Mendelian randomization approach. PLoS Med. 2008; 5:e52.
crossref
18. Mumby HS, Elks CE, Li S, Sharp SJ, Khaw KT, Luben RN, et al. Mendelian randomisation study of childhood BMI and early menarche. J Obes. 2011; 2011:180729.
crossref
19. von Hinke Kessler Scholder S, Smith GD, Lawlor DA, Propper C, Windmeijer F. Genetic markers as instrumental variables: an application to child fat mass and academic achievement. Bristol: The Centre for Market and Public Organisation;2010.
20. Ebrahim S, Davey Smith G. Mendelian randomization: can genetic epidemiology help redress the failures of observational epidemiology? Hum Genet. 2008; 123:15–33.
crossref
21. Timpson NJ, Nordestgaard BG, Harbord RM, Zacho J, Frayling TM, Tybjærg-Hansen A, et al. C-reactive protein levels and body mass index: elucidating direction of causation through reciprocal Mendelian randomization. Int J Obes. 2011; 35:300–308.
crossref
22. Kivimäki M, Lawlor DA, Smith GD, Kumari M, Donald A, Britton A, et al. Does high C-reactive protein concentration increase atherosclerosis? The Whitehall II Study. PLoS One. 2008; 3:e3013.
crossref
23. Allin KH, Nordestgaard BG, Zacho J, Tybjaerg-Hansen A, Bojesen SE. C-reactive protein and the risk of cancer: a mendelian randomization study. J Natl Cancer Inst. 2010; 102:202–206.
crossref
24. Timpson NJ, Lawlor DA, Harbord RM, Gaunt TR, Day IN, Palmer LJ, et al. C-reactive protein and its role in metabolic syndrome: mendelian randomisation study. Lancet. 2005; 366:1954–1959.
crossref
25. Trompet S, Jukema JW, Katan MB, Blauw GJ, Sattar N, Buckley B, et al. Apolipoprotein e genotype, plasma cholesterol, and cancer: a Mendelian randomization study. Am J Epidemiol. 2009; 170:1415–1421.
crossref
26. Casas JP, Bautista LE, Smeeth L, Sharma P, Hingorani AD. Homocysteine and stroke: evidence on a causal link from mendelian randomisation. Lancet. 2005; 365:224–232.
crossref
27. Ding W, Lehrer SF, Rosenquist JN, Audrain-McGovern J. The impact of poor health on academic performance: New evidence using genetic markers. J Health Econ. 2009; 28:578–597.
crossref
28. Wehby GL, Ohsfeldt RL, Murray JC. ‘Mendelian randomization’ equals instrumental variable analysis with genetic instruments. Stat Med. 2008; 27:2745–2749.
crossref
29. Thomas DC, Conti DV. Commentary: the concept of ‘Mendelian randomization’. Int J Epidemiol. 2004; 33:21–25.
crossref
30. Burgess S, Small DS, Thompson SG. A review of instrumental variable estimators for Mendelian randomization. Stat Methods Med Res. 2017; 26:2333–2355.
crossref
31. Pearl J. Causality. Cambridge: Cambridge University Press;2000.
32. Nitsch D, Molokhia M, Smeeth L, DeStavola BL, Whittaker JC, Leon DA. Limits to causal inference based on Mendelian randomization: a comparison with randomized controlled trials. Am J Epidemiol. 2006; 163:397–403.
crossref
33. Teumer A. Common methods for performing mendelian randomization. Front Cardiovasc Med. 2018; 5:51.
crossref
34. Didelez V, Sheehan N. Mendelian randomization as an instrumental variable approach to causal inference. Stat Methods Med Res. 2007; 16:309–330.
crossref
35. Lawlor DA, Harbord RM, Sterne JA, Timpson N, Davey Smith G. Mendelian randomization: using genes as instruments for making causal inferences in epidemiology. Stat Med. 2008; 27:1133–1163.
crossref
36. Greco M FD, Minelli C, Sheehan NA, Thompson JR. Detecting pleiotropy in Mendelian randomisation studies with summary data and a continuous outcome. Stat Med. 2015; 34:2926–2940.
crossref
37. Lim HR. Effect of blood lead concentration on attention deficit hyperactivity disorder in Korean children: a Mendelian randomization study [dissertation]. Seoul: Seoul National University;2017. 78.
38. Yavorska O, Staley J. Package ‘MendelianRandomization’ [Internet]. place unknown: CRAN;2019. accessed on 10 June 2019. Available from: https://cran.r-project.org/web/packages/MendelianRandomization/MendelianRandomization.pdf.
39. Yavorska OO, Burgess S. MendelianRandomization: an R package for performing Mendelian randomization analyses using summarized data. Int J Epidemiol. 2017; 46:1734–1739.
crossref
TOOLS
ORCID iDs

Kwan Lee
https://orcid.org/0000-0003-2554-4170

Chi-Yeon Lim
https://orcid.org/0000-0003-0178-6976

Similar articles