

 PDF
PDF ePub
ePub Citation
 Print
Print


INTRODUCTION
Abnormal proliferation of vascular smooth muscle cells (VSMCs) is a critical event in development and progression of various vascular diseases including atherosclerosis, hypertension, and restenosis after coronary intervention.12345 Phenotypic changes of VSMC of contractile type into synthetic type by cytokines, growth factors, and environmental factors increase proliferation and migration of VMSC and cause vascular diseases.16 Thus, inhibition of VSMC proliferation may protect against vascular diseases.
The anti-malarial drugs chloroquine (CQ) and hydroxychloroquine (HCQ) are quinoline-based drug and inhibit late autophagy by increasing lysosome pH.78 In addition to the anti-malarial effects of CQ and HCQ, they have been used in treatment of cancer.9 Additionally, CQ and HCQ treatment has a demonstrated protective effect on autoimmune diseases such as systemic lupus erythematosus and rheumatoid arthritis.1011 A previous study shows that HCQ treatment protects against cardiovascular disease in rheumatoid arthritis patients,612 and CQ has been shown to prevent progression of experimental pulmonary hypertension and associated cancer.13 In a recent study, CQ induced a switch in tumor-associated macrophages from M2 to M1 macrophages.14 However, the effects of CQ and HCQ in VSMC proliferation and neointima formation have not been addressed.
Adenosine monophosphate-activated protein kinase (AMPK) is a serine/threonine kinase composed of α, β, and γ subunits and serves as an intracellular energy sensor and regulator.15 AMPK plays a key role in maintaining the balance between anabolic and catabolic programs for cellular homeostasis in response to metabolic stress.1617 AMPK activates p21, which arrests cell cycle and suppresses cell proliferation,18 and inhibits VSMC proliferation and migration.1920 The importance of AMPK in cardiovascular function has been demonstrated in a number of studies using statins and metformin, a variety of drugs that at least partially convey cardiovascular protection through activation of AMPK.21
Transforming growth factor-β1 (TGF-β1) is a cytokine acting canonically via Smad signaling to exert effects in a wide range of cell types.2223 TGF-β is considered anti-proliferative,124 but other findings suggest that TGF-β and downstream Smad signaling stimulate growth in primary VSMCs.25262728 In recent reports, the proliferative capacity of TGF-β in VSMCs has been suggested to involve Smad2/3 phosphorylation and p27, a cyclin-dependent kinase inhibitor.2728 Although anti-malarial drugs have been reported to play a role in suppression of cell proliferation, little is known about their molecular mechanism. Thus, this study investigated whether CQ and HCQ have protective effects on cardiovascular diseases through AMPK signaling both in vitro and in vivo.
MATERIALS AND METHODS
1. Reagents and antibodies
Recombinant human TGF-β1 was purchased from R&D Systems (Minneapolis, MN, USA). HCQ sulfate was purchased from Thermo Fisher Scientific (Waltham, MA, USA). CQ phosphate was purchased from Santa Cruz Biotechnology (Santa Cruz, CA, USA). Compound C was purchased from Calbiochem (San Diego, CA, USA). Anti-phospho-AMPK, anti-AMPK, anti-LC3, anti-phospho-Smad2, and anti-phospho-Smad3 antibodies were from Cell Signaling Technology (Danvers, MA, USA), and anti-p27 and anti-Smad3 antibodies were from Santa Cruz Biotechnology. Anti-Cyclin D and anti-Collagen I were from Merck-Millipore (Temecula, CA, USA). Anti-Collagen III was from Fitzgerald Industries International (Acton, MA, USA). Anti-tubulin was from Sigma-Aldrich (St. Louis, MO, USA).
2. Cell culture
Primary rat VSMCs were isolated from Sprague-Dawley rat thoracic aorta. The cells were cultured in 50% fetal bovine serum (FBS)-Dulbecco's Modified Eagle Medium (DMEM) with 1% antibiotics-antimycotics in a CO2 incubator. VSMCs were maintained in DMEM supplemented with 10% FBS, 50 U/mL penicillin, and 50 μg/mL streptomycin at 37°C in a 95% air-5% CO2 atmosphere. VSMCs from passages 4 and 7 were used for the experiments.
3. Carotid artery ligation model
Male mice were ligated at 8 weeks of age. Specific pathogen-free C57BL/6 mice were obtained from Samtaco (Seoul, Korea). Anesthesia was induced by intraperitoneal (i.p.) injection of avertin (15 mg/kg). The left common carotid artery (LCA) was exposed by blunt dissection. Three of 4 caudal branches of the LCA (left external carotid, internal carotid, and occipital artery) were ligated with 6-0 silk suture.29 After surgery, mice were treated with CQ (50 mg/kg, i.p.) or HCQ (50 mg/kg, i.p.) every other day for 3 weeks. All animals were anesthetized and perfused with PBS followed by 4% paraformaldehyde. Both left and right carotid arteries were excised and embedded in paraffin. Lumen diameter, lumen area, neointima area, media area, and total vessel area were measured using NIH Image J (National Institutes of Health, Bethesda, MD, USA). All animal experiments were handled in accordance with the protocol (#YUMC-AEC2018-005) approved by the Institutional Animal Care and Use Committee at Yeungnam University College of Medicine, Daegu, Korea.
4. Histology and Immunohistochemical staining
In ligated LCA, cross sections at predefined proximal distances from the ligation site were analyzed. In non-ligated right common carotid artery (RCA), section distance to the bifurcation of internal and external carotid arteries was analyzed. Blocks were sectioned at 5 μm intervals using a microtome. Slides were dewaxed with xylene, dehydrated, and then stained with hematoxylin and eosin.
5. Western blotting
VSMCs were washed twice with cold PBS and lysed with lysis buffer supplemented with 1 mmol/L phenylmethyl sulfonyl fluoride and 0.01 mmol/L protease inhibitor cocktail. Cell lysates were incubated on ice for 15 minutes and then centrifuged at 17,000 g for 15 minutes at 4°C. Protein concentrations in samples were determined using supernatants and a Bradford assay. Proteins were separated by sodium dodecyl sulphate-polyacrylamide gel electrophoresis and transferred to polyvinylidene difluoride membranes, which were blocked in 5% skim milk and immunoblotted with primary antibodies and then with corresponding secondary antibodies. Signals were visualized using electrochemiluminescence detection regents (EMD Millipore, Billerica, MA, USA) according to the manufacturer's instructions.
6. MTT assay
TGF-β1-induced proliferation was quantified by the MTT assay. Briefly, VSMCs were cultured on 24-well plates; when up to 80% confluent, the medium was replaced with serum-free DMEM. Cells were then pretreated with CQ and HCQ (10 μM) and stimulated with TGF-β1 (1, 2 ng/mL) for 72 hours. MTT reagents were added for 4 hours at 37°C and removed by washing with PBS followed by eluting with dimethyl sulfoxide. Proliferation was measured using a microplate reader (Bio-Rad, Hercules, CA, USA) at 570 nm.
7. Flow cytometric analysis
Cells were trypsinized and fixed in 95% ethanol followed by staining with propidium iodide (PI) (50 μg/mL) for 30 minutes at 37°C. PI stained cells were filtered using a 5 mL polystyrene round bottom tube fitted with a cell-strainer cap prior to flow cytometry. All flow cytometry measurements were obtained using a FACSCalibur (Becton Dickinson, San Jose, CA, USA). Cell cycle analysis was performed using CellQuest Pro software (Becton Dickinson).
8. Cell count
VSMCs were cultured on 12-well plates; when up to 80% confluent, the medium was changed to serum-free DEME overnight. Cells were then pretreated with CQ or HCQ (10, 20 μM) for 2 hours and incubated with platelet-derived growth factor (PDGF; 10 ng/mL) for indicated times (1, 2, or 3 days). Cell proliferation was determined by cell counting with a hematocytometer.
RESULTS
1. Anti-malarial drugs induce AMPK activation in primary rat VSMCs
To investigate the effects of anti-malarial drugs in AMPK activation in VSMCs, we examined the effects of CQ and HCQ on AMPK phosphorylation in primary rat VSMCs. Rat VSMCs were treated with CQ or HCQ for 1 hour and then subjected to immunoblotting with anti-phospho-AMPK antibody. As shown in Fig. 1, CQ and HCQ increased AMPK phosphorylation in a dose-dependent manner, suggesting that CQ or HCQ activate the AMPK signaling pathway in VSMCs.
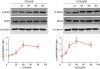 | Fig. 1Anti-malarial drugs increase AMPK phosphorylation in primary rat VSMCs. Primary rat VSMCs were treated with CQ or HCQ at the indicated concentrations for 1 hour. Phosphorylation of AMPK was determined by immunoblotting with anti-phospho-AMPK antibody. Amount of protein was normalized to total amount of AMPK and tubulin expression. Bar graphs present the densitometric quantification of western blot bands. Results are expressed as mean±standard deviation and are representative of 3 independent experiments.AMPK, adenosine monophosphate-activated protein kinase; VSMC, vascular smooth muscle cell; CQ, chloroquine; HCQ, hydroxychloroquine; p-AMPK, phospho-adenosine monophosphate-activated protein kinase.
*p<0.05; †p<0.01 compared with controls.
|
2. Anti-malarial drugs inhibit cell proliferation and cell cycle progression in rat VSMCs
To investigate the anti-proliferative effects of CQ and HCQ on cell proliferation, rat VSMCs were pretreated with CQ or HCQ (10, 20 μM) for 2 hours and stimulated with 10 ng/mL PDGF for 1, 2, or 3 days. CQ or HCQ inhibited the cell proliferation induced by PDGF in rat VSMCs (Fig. 2A).
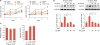 | Fig. 2Anti-malarial drugs inhibit PDGF-induced cell proliferation and cell cycle progression in rat VSMCs. (A) Rat VSMCs were pretreated with CQ or HCQ (10, 20 μM) for 2 hours and then incubated with PDGF (10 ng/mL) for indicated times (1, 2, or 3 days). Cell proliferation was determined by cell counting. (B) Serum-starved rat VSMCs were pretreated with CQ or HCQ (20, 40 μM) for 2 hours and then incubated with PDGF (10 ng/mL) for 24 hours. Protein expression of cyclin D was determined by immunoblotting with anti-cyclin D antibody. Amount of protein was normalized to tubulin expression. Bar graphs present the densitometric quantification of western blot bands. Results are expressed as mean±standard deviation and are representative of 3 independent experiments. (C) Serum-starved rat VSMCs were pretreated with CQ or HCQ (20, 40 μM) for 2 hours and then incubated with PDGF (10 ng/mL) for 24 hours. For cell cycle analysis, cells were detached, stained with PI, and subjected to flow cytometry. Results are representative of 3 independent experiments that yielded similar results.PDGF, platelet-derived growth factor; VSMC, vascular smooth muscle cell; CQ, chloroquine; HCQ, hydroxychloroquine.
*p<0.05; †p<0.01 compared with cells treated with PDGF.
|
Since cell proliferation was associated with cell cycle progression, we investigated the effects of CQ and HCQ on cell cycle. For cell cycle analysis, serum-starved VSMCs were pretreated with CQ or HCQ for 2 hours and then incubated with 10 ng/mL PDGF for 24 hours (Fig. 2B). Cyclin D, which is a regulator of cell cycle progression increased by PDGF, was decreased by both CQ and HCQ. Also, we observed cell cycle arrest and confirmed that CQ and HCQ increased G2/M phase arrest but not G0/G1 phase arrest (Fig. 2C). These results indicate that CQ and HCQ affect VSMC proliferation and cell cycle progression.
3. Anti-malarial drugs inhibit TGF-β1-induced Smad3 phosphorylation and cell proliferation in rat VSMCs
Recent studies have demonstrated that TGF-β1 increases VSMC proliferation through Smad3 signaling.2728 In addition, it has been reported that AMPK inhibits TGF-β1-induced VSMC proliferation.30 To investigate the effects of CQ and HCQ in TGF-β1, Smad3 phosphorylation and cell proliferation were examined in VSMCs treated with TGF-β1 (Fig. 3A). CQ and HCQ both inhibited TGF1-β1-induced Smad3 phosphorylation. In addition, CQ and HCQ induced AMPK phosphorylation in the presence or absence of TGF-β1 (Fig. 3A). A cell viability assay and cell counting analysis showed that TGF-β1-induced VSMC proliferation decreased following treatment with CQ or HCQ (Fig. 3B and C). These results indicate that CQ or HCQ inhibit TGF-β1-induced VSMCs proliferation via Smad3 and AMPK pathways.
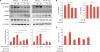 | Fig. 3Anti-malarial drugs inhibit TGF-β1-induced Smad3 phosphorylation in rat VSMCs. (A) Rat VSMCs were pretreated with CQ or HCQ (40 μM) for 2 hours and then incubated with TGF-β1 (2 ng/mL) for 10 or 30 minutes. Phosphorylation of Smad3 and AMPK was determined by immunoblotting with anti-phospho-Smad3 and anti-phospho-AMPK antibodies, respectively. Amount of protein was normalized to total amount of Smad3, AMPK, and tubulin. Bar graphs present densitometric quantification of western blot bands. Results are expressed as mean±standard deviation and are representative of 3 independent experiments. (B) Rat VSMCs were pretreated with CQ or HCQ (10 μM) for 2 hours and then incubated with TGF-β1 (2 ng/mL) for 3 days. Cell viabilities were determined with the MTT assay. The data represent the mean values of 3 wells. (C) Rat VSMCs were pretreated with CQ or HCQ (10 μM) for 2 hours and then incubated with TGF-β1 (2 ng/mL) for 3 days. Cell proliferation was determined by cell counting. Results are representative of 3 independent experiments that yielded similar results.TGF-β1, transforming growth factor-β1; VSMC, vascular smooth muscle cell; CQ, chloroquine; HCQ, hydroxychloroquine; AMPK, adenosine monophosphate-activated protein kinase; p-AMPK, phospho-adenosine monophosphate-activated protein kinase; p-Smad3, phospho-Smad3.
*p<0.05; †p<0.01 compared with controls. ‡p<0.01 vs. TGF-β1 2 ng/mL-treated. §p<0.01 vs. control, ∥p<0.01 vs. TGF-β1 2 ng/mL-treated.
|
4. Anti-malarial drugs attenuate carotid artery ligation-induced neointimal hyperplasia in vivo
The partial ligation model of the carotid artery was used to evaluate the effect of CQ or HCQ on smooth muscle cell proliferation in vivo. Morphometric analysis of carotid arteries 3 weeks after ligation of the LCA indicated that CQ and HCQ decreased neointima width compared with vehicle control (Fig. 4A). However, media width was not valid. In addition, there was no significant decrease in intima width of the non-ligated RCA. VSMC proliferation mainly contributes to neointima formation in a carotid artery ligation model. Collagen I and collagen III expression was increased in LCA compared with RCA, and CQ and HCQ inhibited ligation-induced collagen I and collagen III expression in LCA (Fig. 4B). These results show that CQ and HCQ inhibited carotid artery ligation-induced VSMC proliferation.
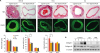 | Fig. 4Carotid artery ligation-induced neointimal hyperplasia is significantly attenuated in animals treated with anti-malarial drugs. (A) Partial carotid ligation was performed on 8-week-old male C57BL/6 mice. After surgery, mice were treated with CQ (50 mg/kg, i.p.) or HCQ (50 mg/kg, i.p.) every other day for 3 weeks. Top panel: H&E staining of C57BL/6 arteries under 200× magnification. Elastin was visualized by autofluorescence. Images are representative of n=4. Bottom panel: graphical representation of the media, intima, and intima/media ratio (n=4; mean±standard error of mean). (B) C57BL/6 arteries were isolated and homogenized. Protein levels were measured by western blot analysis with specific antibodies against collagen I, collagen III, and tubulin. Results are representative of 3 independent experiments.CQ, chloroquine; HCQ, hydroxychloroquine; i.p., intraperitoneal; R, non-ligated right common carotid artery; L, ligated left common carotid artery; I, intima; M, media; H&E, hematoxylin and eosin; LCA, left common carotid artery; RCA, right common carotid artery.
*p<0.05.
|
DISCUSSION
In the present study, we investigated the effects of CQ and HCQ, anti-malarial drugs, in abnormal proliferation of VSMCs and neointimal hyperplasia. The major findings of the present study were that CQ and HCQ activate AMPK and inhibit PDGF-induced VSMC proliferation (Figs. 1 and 2). In addition, CQ and HCQ inhibited TGF-β1-induced Smad3 phosphorylation and VSMC proliferation (Fig. 3). We also found that CQ and HCQ inhibited carotid artery ligation-induced neointima formation and collagen induction in vivo.
CQ or HCQ, which are quinoline-based drugs, are known as anti-malarial drugs and inhibit late autophagy by interfering with fusion between the autophagosome and lysosome by increasing lysosome pH. In recent years, quinoline-based drugs have used as anti-inflammatory agents for rheumatoid arthritis, lupus erythematous, cancer, and sarcoidosis as well as some dermatologic conditions.10111214 CQ and HCQ decrease cytokine production from T-lymphocytes and monocytes and attenuate proinflammatory cytokines, including interleukin-6, interleukin-1β, and tumor necrosis factor-α.3132 In addition, CQ inhibits cell growth and induces cell death by necrosis as well as by apoptosis in A549 lung cancer cells,33 and the CQ-mediated anti-cancer effect was associated with decreases in p42/44 MAPK and Akt activities in CT26 mouse colon cancer cells.34 However, the molecular mechanism by which CQ and HCQ regulate abnormal proliferation in VSMC and intimal hyperplasia has not been addressed. In the present study, CQ- and HCQ-induced AMPK activation were involved in inhibition of VSMC proliferation (Fig. 3). In addition, CQ and HCQ inhibited TGF-β1-induced Smad3 phosphorylation, suggesting that CQ and HCQ inhibit carotid artery ligation-induced intimal hyperplasia and collagen induction via inhibition of the Smad3 signaling pathway.
It is well known that cell proliferation is related to the cell cycle. Thus, we examined whether CQ and HCQ affect the cell cycle of VSMCs by flow cytometric. Most cell cycle arrest occurred at the G1/G0 phase, suggesting a role of CQ and HCQ in G0/G1 phase arrest. Interestingly, we found HCQ increased G2/M phase arrest but not G0/G1 phase arrest. It has been reported that CQ and HCQ cause G2/M phase arrest in cancer cells, increasing p21 level and decreasing cyclin B1 level.35 These results suggest that inhibition of VSMC proliferation by CQ and HCQ can be attributed to cell cycle arrest through G2/M phase arrest.
In conclusion, we found that CQ and HCQ activated AMPK and inhibited PDGF-induced VSMC proliferation. In addition, CQ and HCQ inhibited TGF-β1-induced Smad3 phosphorylation and VSMC proliferation. Moreover, CQ and HCQ inhibited carotid artery ligation-induced neointima formation in vivo. These results suggest that CQ and HCQ are potential therapeutic targets for vascular diseases with abnormal VSMC proliferation.
 XML Download