

 PDF
PDF ePub
ePub Citation
 Print
Print


INTRODUCTION
The prevalence of obesity, defined as a body mass index (BMI) of ≥ 30 kg/m2, has increased worldwide, with about one-third of the population being either overweight (OW) (BMI ≥ 25 kg/m2) or obese (OB) [1]. Over the last few years, a growing body of evidence has suggested that a high BMI during diagnosis could be considered as a poor prognostic factor in patients with early stage breast cancer [234].
In many studies, significant weight gain was observed during chemotherapy in women with breast cancer [56789]. There has been increasing evidence that weight gain during chemotherapy is associated with increased recurrence risk and decreased survival [21011]. Even though the underlying mechanism remains unclear, it has been proposed that increased circulating levels of estrogen, insulin, insulin-like growth factor, and other hormonal factors in OB patients may promote proliferation of breast cancer cells [121314].
Neoadjuvant chemotherapy (NAC) is a therapeutic strategy, being used increasingly for initially large, inoperable, or locally advanced breast tumors, as well as operable cancers susceptible to specific treatments. NAC not only induces clinical responses that allow breast-conserving surgery and better survival in certain patients, but also provides a unique opportunity to evaluate intervention efforts, including response to chemotherapeutic agents and lifestyle interventions [1516].
The data available on the influence of weight on NAC response has been inconsistent. Some studies suggest that OB patients are less likely to have pathologic complete response (pCR) to NAC and are more likely to experience worse disease-free survival (DFS) and overall survival (OS) [17181920], while others showed contradictory results [212223]. There have been few studies focusing on the influence of weight change during NAC on pCR and long-term survival. A prospective, randomized pilot trial conducted by Rao et al. [24] randomized female patients with estrogen receptor (ER)-positive breast cancer undergoing NAC to a supervised exercise program group and to a control group. Patients in the exercise program group had a significantly lower BMI after NAC and had significantly greater reductions in Ki-67 compared to those in the control group. This indicated that weight control during NAC may have a positive effect on patient outcome.
In this study, weight and weight change were evaluated by BMI and BMI change, respectively. We sought to examine the influence of initial BMI and BMI change during NAC on pathologic response and long-term survival in Chinese breast cancer patients.
METHODS
Patients
This retrospective study was performed using data from female patients who received anthracycline/taxane-based NAC for stage II or III breast cancer in Shanghai Ruijin Hospital from January 2009 to December 2015. The regimen of NAC in each patient was determined based on physician's choice. After completion of NAC, the patients underwent curative surgery. Patients who had complete data on weight and BMI before and after NAC were enrolled in this study. The independent Ethical Committee/Institutional Review Board of Ruijin Hospital, Shanghai Jiaotong University School of Medicine reviewed and approved this study protocol (approval No. 2016-39), which was conducted in accordance with the Declaration of Helsinki. Informed consent was exempted due to the retrospective format of this study.
The baseline clinicopathological characteristics of the patients including age, menopausal status, past medical history, weight, BMI, time of core needle biopsy and definite surgery, surgery type, clinical and pathological tumor characteristics at diagnosis and surgery, and neoadjuvant and adjuvant treatment (such as chemotherapy, endocrine therapy, targeted therapy, and radiation) information were obtained by reviewing the electronic medical records of Ruijin Hospital. Patients received local and systemic treatments as per physicians' choice. Survival status was obtained through outpatient medical history and/or phone calls.
Weight was evaluated using BMI, which was calculated by dividing the weight in kilograms by the square of height in meters. BMI was categorized using the definition of the World Health Organization as follows: BMI < 25 kg/m2 was categorized as normal weight/underweight (NW/UW); 25.0 to 29.9 kg/m2 as OW; and ≥ 30 kg/m2 as OB. BMI change was defined as the difference in BMI between day 1 of the first cycle of NAC and the day before surgery. A BMI gain or loss of > 2 kg/m2 following NAC was considered to be significant, whereas BMI-changes ranging between −2 and 2 kg/m2 were considered to indicate a stable weight.
Pathologic assessment
All of the patients had undergone core needle biopsy and were pathologically diagnosed with breast cancer before NAC administration. Histopathological information including breast cancer pathological type, histological grade, tumor size, lymph node status, and immunohistochemical (IHC) results of ER, progesterone receptor (PR), and human epidermal growth factor 2 (HER2), identified by 2 different pathologists independently, was obtained from patients' pathological reports. ER positivity (ER+) and PR positivity (PR+) were defined as more than 1% positive invasive tumor cells showing nuclear staining. Hormone receptor positivity (HR+) was defined as ER+ or PR+. HER2 status was determined using IHC staining and scored as 0, 1+, 2+, 3+ according to 2007 American Society of Clinical Oncology/College of American Pathologists guidelines [25]. HER2 IHC 2+ samples were further examined by fluorescence in situ hybridization (FISH). HER2 IHC 3+ or FISH positive tumors were regarded as HER2 positive. Tumors were classified into four breast cancer subtypes in this study: HR+/HER2–, HR+/HER2+, HR+/HER2+, and HR−/HER2− (triple negative breast cancer; TNBC). The pCR was defined as the absence of residual invasive carcinoma in the breast during surgery (ypT0/is).
Statistical analysis
For the purpose of comparison, patients were included either into NW/UW group or into OW/OB group according to the initial BMI before NAC. Patients were also categorized into BMI-gain (BMI gain > 2 kg/m2) group and BMI-stable/loss (BMI change within ± 2 kg/m2 or BMI loss > 2 kg/m2) group according to the BMI change during NAC.
DFS was defined as the time interval from the date of curative breast cancer surgery to the date of breast cancer recurrence at local or regional sites, metastasis to distant sites, newly diagnosed breast cancer in the contralateral breast, other malignancies, or death from any cause. OS was defined as the time interval from the date of breast cancer surgery to the date of death from any cause.
Univariate models (cross-tabulation and 2-sided χ2 test) were used to evaluate the predictive effect of categorical variables on initial BMI and BMI-change. Univariate and multivariable logistic regression analyses were used to calculate the odds ratio (OR) and 95% confidence intervals (CIs) of different clinicopathological variables for pCR.
Survival curves were plotted using the Kaplan-Meier method and compared between groups using the log-rank test. Univariate and multivariate Cox proportional hazards regression analyses were performed to calculate hazard ratios and 95% CI for clinicopathological variables and survival.
All analyses were performed using IBM SPSS 23.0 for Mac (IBM Corp., Armonk, USA). All reported p-values were 2-sided, and p < 0.05 was considered statistically significant.
RESULTS
Basic clinicopathological characteristics of patients and the associations with BMI catogories
In total, 409 patients who received anthracycline/taxane based NAC were included in the final analysis. Among the 152 patients with HER2+ disease, 81 (53.3%) patients received anti-HER2 therapy concurrent with NAC. The average BMI of all patients before NAC was 23.40 ± 3.04 kg/m2. In total, 112 patients (27.4%) were OW or OB. The average BMI after NAC was 23.66 ± 3.02 kg/m2. The average BMI change value was 0.27 ± 1.49 kg/m2. BMI after NAC was significantly higher than BMI before NAC (t = −3.604, p < 0.001).
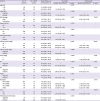
The clinicopathological characteristics according to initial BMI categories and BMI-change categories are listed in Table 1. Age, menopausal status, pathological type, clinical tumor stage, clinical node stage, American Joint Committee on Cancer (AJCC) stage, ER status, PR status, HER2 status, molecular subtypes, and pCR rates were balanced between OW/OB and NW/UW patients. OW/OB patients had a higher rate of diabetes mellitus (12.5% vs. 3.7%, p = 0.001) and hypertension (27.7% vs. 15.5%, p = 0.005) compared with NW/UW patients. All the listed clinicopathological characteristics were similar between BMI-gain patients and BMI-stable/loss patients.
Table 1
Baseline patient characteristics stratified by initial BMI and BMI-change
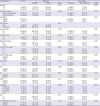
Values are presented as number (%).
BMI = body mass index; OB = obese; OW = overweight; NW = normal weight; UW = underweight; DM = diabetes mellitus; HTN = hypertension; IDC = invasive ductal carcinoma; AJCC = American Joint Committee on Cancer; ER = estrogen receptor; PR = progesterone receptor; HER2 = human epithelial growth factor-2; TNBC = triple negative breast cancer; HR = hormone receptor; pCR = pathologic complete response.
The influence of BMI and BMI-change on NAC response
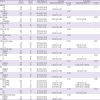
Overall, 24.9% (102/409) of patients acquired pCR following NAC. The pCR rate was 25.3% (75/297) in the NW/UW group and 24.1% (27/112) in the OW/OB group (p = 0.811) and was also similar between the BMI-gain group (23.3%, 10/43) and the BMI-stable/loss (25.1%, 92/366) group (p = 0.787). BMI and BMI-change were not correlated with pCR, while pathologic type, clinical node stage, and PR status were found to be associated with pCR (Table 2).
Table 2
Univariate and multivariate logistic regression analyses of clinicopathological factors and OR of pCR
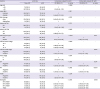
Values are presented as number (%).
BMI = body mass index; CI = confidence interval; OB = obese; OW = overweight; NW = normal weight; UW = underweight; DM = diabetes mellitus; HTN = hypertension; IDC = invasive ductal carcinoma; AJCC = American Joint Committee on Cancer; ER = estrogen receptor; PR = progesterone receptor; HER2 = human epithelial growth factor-2; TNBC = triple negative breast cancer; HR = hormone receptor; pCR = pathologic complete response; OR = odds ratio.
The influence of BMI and BMI-change on DFS
The median follow-up time was 43.2 (8.9–93.6) months. In total, 107 DFS events were recorded, including 15 loco-regional recurrence, 3 contralateral breast cancers, 77 distant metastases, 1 secondary malignancy, and 11 deaths. Kaplan-Meier analysis revealed that OW/OB patients had significantly worse DFS than NW/UW patients (p = 0.008, Figure 1A). Patients with BMI gain during NAC also had a worse DFS than patients with BMI stable/loss (p = 0.001, Figure 2A). Univariate analysis identified initial BMI status before NAC, BMI-change type, primary tumor stage, AJCC stage, ER status, PR status, molecular subtype, and pCR as prognostic factors of DFS in patients who received NAC. A multivariate Cox proportional hazard model including the above factors was established. OW/OB before NAC (hazard ratio, 1.69; 95% CI, 1.13–2.53; p = 0.011) and BMI gain (hazard ratio, 2.09; 95% CI, 1.28–3.42; p = 0.003) remained independent prognostic factors for DFS (Table 3).
Figure 1
Kaplan-Meier plot of DFS (A) and OS (B) by initial body mass index.
DFS = disease-free survival; OS = overall survival; OB = obese; OW = overweight; NW = normal weight; UW = underweight.
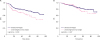
Figure 2
Kaplan-Meier plot of DFS (A) and OS (B) by BMI change.
DFS = disease-free survival; OS = overall survival; BMI = body mass index.
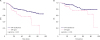
Table 3
Univariate and multivariate analysis of factors associated with DFS
BMI = body mass index; CI = confidence interval; OB = obese; OW = overweight; NW = normal weight; UW = underweight; DM = diabetes mellitus; HTN = hypertension; IDC = invasive ductal carcinoma; AJCC = American Joint Committee on Cancer; ER = estrogen receptor; PR = progesterone receptor; HER2 = human epithelial growth factor-2; TNBC = triple negative breast cancer; HR = hormone receptor; pCR = pathologic complete response; DFS = disease-free survival
The influence of BMI and BMI change on OS
In total, 59 deaths were recorded until the last follow-up, among which 57 patients died of breast cancer and 2 died of other reasons. Kaplan-Meier analysis revealed that patients with BMI gain during NAC had a worse OS than patients with BMI stable/loss (p = 0.010, Figure 2B). There was no difference in OS between OW/OB patients and NW/UW patients (p = 0.467, Figure 1B). Univariate analysis identified BMI-change type, primary tumor stage, ER status, PR status, molecular subtype, and pCR as prognostic factors for OS in patients who received NAC. Multivariate analysis showed that BMI-change remained an independent prognostic factor for OS (hazard ratio, 1.97; 95% CI, 1.04–3.74; p = 0.039) (Table 4).
Table 4
Univariate and multivariate analysis of factors associated with overall survival
BMI = body mass index; OB = obese; OW = overweight; NW = normal weight; UW = underweight; DM = diabetes mellitus; HTN = hypertension; AJCC = American Joint Committee on Cancer; ER = estrogen receptor; PR = progesterone receptor; HER2 = human epithelial growth factor-2; TNBC = triple negative breast cancer; HR = hormone receptor; pCR = pathologic complete response.
DISCUSSION
BMI gain after NAC was observed in our cohort of Chinese breast cancer patients. There was no association between initial BMI or BMI-change and pCR rates. Initial BMI was an independent prognostic factor for poor DFS but not for OS, while BMI-gain could predict both poor DFS and poor OS.
In most of the studies done in the recent years, an inverse relationship has been observed between weight and breast cancer and weight gain is commonly observed during adjuvant chemotherapy and has shown a negative impact on breast cancer outcome. Although some studies have suggested that higher BMI is associated with a more advanced stage of breast cancer in terms of tumor size [26], lymph node involvement [27], and hormonal status [28], we only found a significantly different distribution of the comorbidity of hypertension and diabetes mellitus.
NAC has recently been introduced successfully into clinical treatment for non-metastatic breast cancer and is now an established therapy approach. The highest efficacy of NAC in the treatment of breast cancer has been characterized by pCR at the time of surgery and pCR represents an important surrogate marker for improved outcome in these patients. Our study showed no association between initial BMI or BMI-gain and pCR rates. Most of the prior studies about the influence of BMI on NAC response were conducted in Western countries and the results were quite inconsistent. Litton et al. [20] first reported the relationship between OW and OB status and the pathologic response to NAC in patients with operable breast cancer in M.D. Anderson Cancer Center, and found that higher BMI was associated with less pCR to NAC and OS. This result was supported by another study from Germany [19]. However, in a pooled analysis of 4 prospective Alliance clinical trials, no major difference in pCR rates according to BMI difference was observed [23]. Conversely, in a study from Austria, OB women were reported to have increased pCR rate to NAC and favorable progression-free survival [21]. The data on BMI and pCR in Asian patients was limited. In Chen et al. [18] study of a Chinese breast cancer cohort, higher BMI was associated with worse pCR, unlike our study. The proportion of OW/OB patients was 39.1% in Chen et al. [18] study, while in our study it was only 27.4%, possibly contributing to this difference. In a prior Korean study in which the rate of OW/OB patients was 27.2%, higher BMI was not significantly associated with pCR [22], similar to our result.
This is the first study investigating whether increased BMI during NAC is associated with pCR rates and survival in Chinese breast cancer patients. Significant BMI-gain was observed in our study. BMI-gain was not associated with pCR but was an independent prognostic factor for poor DFS and OS. Weight gain during chemotherapy in women with breast cancer was observed in many studies. Studies focusing on BMI change during NAC were limited and had inconsistent results. In Bao et al. [29] study of patients with breast cancer undergoing NAC, BMI decreased by 0.9 kg/m2 after NAC, and in Kogawa et al. [30] NAC study, the median BMI change was −0.1 kg/m2 . Bao et al. [29] study enrolled only TNBC patients, and the result indicated no correlation between weight change during NAC and Ki-67 change or attaining pCR. In Kogawa et al. [30] study, increased BMI was not observed to be an independent predictor of pCR and clinical outcomes, but subset analyses showed that BMI was associated with improved pCR rates in normal BMI/UW group and in postmenopausal group, contradictory to our study. Another study conducted by Rao et al. [24] enrolled ER-positive female patients with breast cancer, who underwent NAC, and they were randomized to a supervised exercise program group and to a control group. Patients in the exercise program group had a significantly lower BMI after NAC and had significantly greater reductions of Ki-67 compared to those in the control group, which indicates the association between lower BMI and better outcome [24]. Several factors including increased circulating levels of estrogen, insulin, insulin-like growth factor, and other hormonal factors in OB patients were considered to be associated with worse outcomes of breast cancer [121314]. However, the relationship between these factors and the effect of chemotherapy was unknown. The negative association of BMI with NAC response and the positive association of BMI with survival, observed in our study, indicated that OW might have less impact on chemotherapy sensitivity but more impact on other treatment stages of breast cancer, requiring further exploration. At present, it could be observed from our study that the issue of BMI control should be paid more attention. However, given the previous limited and inconsistent data, the target of BMI management during NAC is still controversial. The role of BMI in breast cancer probably depends on patients' clinical characteristics and more studies are necessary.
Our study has several important strengths and limitations. The novelty of this study is that we tested the associations among BMI before NAC, BMI-change after NAC, pCR rates, and long-term survival of patients with breast cancer. In addition, this is the first study to determine whether increased BMI during NAC is associated with pCR rates and survival in Chinese patients and showed results different from previous studies. However, since our study was a single-center retrospective study with limited number of patients and the follow-up time was short, wrong conclusions could have been made. The limited sample size also restricted us from performing further subgroup analysis. Moreover, unknown factors, such as dose intensity of NAC, could have contributed to the worse outcome in the OW/OB and BMI-gain group. More studies are necessary to confirm the predictive and prognostic value of BMI and BMI change in patients undergoing NAC.
In conclusion, our study showed that BMI increase was observed after NAC in Chinese breast cancer patients. Initial BMI was an independent prognostic factor for poor DFS but not for OS, while BMI-gain could predict both poor DFS and poor OS. Our study suggests the importance of weight control during NAC. Further research is warranted to develop effective strategies for weight control among breast cancer patients to improve their NAC response and survival.
 XML Download