

 PDF
PDF ePub
ePub Citation
 Print
Print


INTRODUCTION
The consumption of adequate calories in order to avoid malnutrition is no longer a challenge. However, eating sufficiently to lead a healthy life, free from diseases has become a challenge in today’s times. This change has influenced the importance of the concept of diet quality [1]. Diets rich in fruits and vegetables are globally believed to be a preventive measure against cardiovascular diseases and certain types of cancers [2] and have a positive impact on long-term health issues such as heart disease and asthma [3]. Methods for assessment of children's diet quality are necessary to monitor health status of different subgroups [4].
Diet quality is usually evaluated using different indices developed for different countries according to the national dietary guidelines for that specific country. In India, there exists no standardized index for the diet quality assessment of children. Hence, the present study attempted to develop an index to evaluate the diet quality of Indian children, in accordance with the recommendations for Indian children aged between 7–9 years in the National Dietary Guidelines [5].
MATERIALS AND METHODS
Sampling and recruitment of participants
The present study is part of a wider study of 500 children from the rural area of Srinagar Garhwal, Uttarakhand, in which a diet quality index called the Diet Quality Index for Indian children (DQIIC) was developed and standardized for the diet quality assessment of Indian children. This study was a cross sectional study, conducted in six schools in which the relationship between diet quality and nutritional status of children between ages 7–9 years was observed. However, the present study comprised a subsample of 100 children aged between 7–9 years who were enrolled from a randomly selected school for the standardization of the DQIIC. The researcher informed the participants' parents about the purpose of the study, assessment tools to be used, and the approximate time to be taken for the study. Informed consent was obtained from the parents as well as relevant authorities before embarking upon data collection. The present study was designed as per the guidelines for ethical consideration in human studies suggested by the Indian Council of Medical Research (ICMR) in 2017 [6], which are based on the revised Helsinki Declaration (2013). All reasonable steps were taken to maintain patient confidentiality.
Background information
Background information and data on socio-economic status (Kuppuswamy's scale, 2014) [7] were collected following which the dietary behavior assessment was administered. The dietary behavior of children was assessed using a self-designed and pretested semi-structured questionnaire. It comprised questions related to dietary habits. Parents of the children were contacted and asked to complete the questionnaire. A 24-hour dietary recall was also used for the dietary assessment. In brief, for the 24-hour recalls, the researcher collected data on foods/beverages consumed by children in a day with the help of their parents. This information included the type, amount, brand name, food preparation method and any additions (e.g., spoons of sugar to milk, tea or coffee, spoons of clarified butter in chapatis etc.). Quantity of food consumed by the participants was modified into nutrients, using validated Nutrition Software of India – ‘DietCal – A Tool for Dietary Assessment and Planning’ version-8.0 (Profound Tech Solution; http://dietcal.in/) which calculates nutrients using values from Indian Food composition Tables 2017 [8]. The data thus obtained became the stepping stone for the development of the diet quality index.
Development of the Diet Quality Index for Indian children
To begin with, dietary guidelines for Indian children as well as other standardized international diet quality assessment tools were studied. In addition, the dietary behavior of children who were a part of the study was assessed using a pretested questionnaire. For pilot testing, an index with nineteen components was prepared, after referring to the dietary guidelines for Indians (2010) [5]. It was administered to 30 children between ages 7–9 years. Following the reliability assessment, it was found that the reliability of this pilot tested index was below cut off; it was then modified. Initially during the process of modification, 19 components were included: cereals, pulses, meat and meat products, milk and milk products, green leafy vegetables, fruits, sugar, roots and tubers, other vegetables, overall variety, empty calorie foods, frequency of breakfast consumption, frequency of consumption of meal given in lunch box, number of meals in a day, frequency of consumption of least favorite food, consumption of meal from any other place besides one's home in the past two days, dietary behavior regarding consumption of advertised foods, consumption of homemade foods, sodium, and total energy from fats. However, after receiving suggestions of experts, roots and tubers, green leafy vegetables, and other vegetables were deleted and components such as vegetables, protein, iron, calcium, and vitamin C were included in the index. A final draft of the index consisting of 21 components was prepared and entitled DQIIC, which is based on the dietary guidelines for Indian children, as proposed by ICMR, 2010 [5]. Components such as protein, iron, calcium, and vitamin C were included for evaluating the adequacy of these nutrients in Diet Quality index international as these are essential in protection against under-nutrition and deficiency disorders and we have also used it for the similar reason [9].
Scoring of Diet Quality Index for Indian children
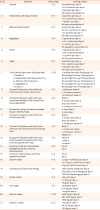
Scoring of the DQIIC is described in Table 1. Participants whose dietary intake was as per the recommended dietary allowances (RDA) for Indian children between ages 7–9 years were awarded the highest scores, while those whose diet was not in accordance with the RDA of the participants were awarded lower scores. The DQIIC scoring system focused not only on frequency of consumption of different food groups but also on the amount of intake of foods and nutrients. This was shown to be associated with increased risk of some chronic diseases and dietary behavior, focusing on food consumption of school age children. Components assessing adequacy of food groups are given scores in the range of 0–4 points. Items related to food groups were given a maximum score of 3 or 4. Vegetables were given a maximum score of 4 because this component included leafy vegetable as well as other vegetables. Maximum score for overall variety was 10 and this score decreased with the decrease in number of food groups. Components assessing moderation were given a score of 0–2. Components assessing food related behavior in children were in range of 0–6 points. Scores were given to these components on the basis of their importance for a child's health. Scores given to the components related to dietary behavior were in the range of 0–2 mostly except for 3 components (frequency of having eaten in some other eating places by the child except home during the last 7 days; breakfast skipping; frequency of finishing tiffin by the child). The lower response category was 1 for frequency of having eaten in some other eating places except for home during the last seven days as none of the options included for this item are completely faulty. Breakfast skipping and frequency of finishing tiffin by the child are in the score range of 0–6 as these contribute to daily energy requirement of a child and are part of child’s daily schedule and had similar options too. For frequency of eating least favourite but healthy food by the child, a similar score of 1 has been provided to two options as these options are almost similar. A score range of 0–10 was given to the components assessing adequacy of nutrients in diet of children. Score ranges on four questions of nutrients-protein, vitamin C, calcium and iron are variable owing to the observations of dietary behavior survey and the secondary empirical evidences [1011] about the intake pattern of foods rich in these nutrients in Indian children. Milk and calcium rich sources are deficient in the diet owing to expenses involved; moreover calcium accrued in this age has life long benefits and vice versa, therefore, calcium was given the highest weightage (0 to 10) followed by protein (0 to 8). The scores for all components were summed, resulting in total DQIIC score i.e. 90 (Table 1). As 90 was the maximum possible score for this index, it was subdivided into three categories on the basis of statistically calculated tertiles which are (i) ≤72 points: unhealthy diet, (ii) 73–77 points: moderately healthy, and (iii) ≥78 points: healthy.
Table 1
Diet Quality Index for Indian children scoring criteria
![]()
Reliability and validity of the Diet Quality Index for Indian children
The reliability and validity were evaluated through test retest reliability, split half reliability, Cronbach's alpha, and content validity ratio (CVR), respectively. For the CVR, all the items in the test were reviewed by 30 subject experts on the basis of suitability of all the items for the study. CVR should be 0.8 or higher for a good scale [12]. A scale is considered to have good internal consistency if Cronbach's alpha is 0.5 or greater [13]. Test retest reliability was conducted at one month interim and Pearson's correlation coefficient was utilized to determine it. In order to compute the CVR, the draft index was circulated to 30 subject matter experts of different related disciplines (Food and Nutrition, Human Development, Home Science, Sociology, Management, Humanities and Language, Statistics, Education, Psychology, Pharmacy, Life Science). They were asked to rate each of the 21 questions of the index as ‘essential,’ ‘useful but not essential,’ or ‘not essential.’ After this CVR was calculated [14].
CVR was calculated for 21 items of DQIIC, following which content validity index was calculated for DQIIC by calculating the average of CVR values of the items of this index. The value of ≥7 was considered acceptable [1516]. The data were analyzed by relevant statistical methods using IBM SPSS Statistics for Windows, Version 20.0 (IBM Co., Armonk, NY, USA) and Microsoft Excel 2007 (Microsoft, Redmond, WA, USA). Level of significance was set at 5%. The mean and standard deviation (SD) were used for descriptive purposes.
RESULTS
Characteristics and dietary behavior of children
The sample size of the present study was 100 children of 7–9 years of age, 47% girls and 53% boys. The mean (±SD) age of the school children who participated in the present study for the standardization of DQIIC was 8.01±0.81 years. The mean age of boys and girls was 8.01±0.83 and 8.01±0.81 years, respectively. A majority of the mothers of the participants (83%) were homemakers and few (17%) were working in schools as teachers. The fathers of 21% participants were employed in the private sector whereas 31% were employed in the government sector, and 48% were self-employed. It was observed that there were more highly educated mothers as compared to fathers. Socioe-conomic status of the participant’s family was assessed using Kuppuswamy's socio-economic status scale and it was revealed that most (44%) of the participants belonged to upper middle socioe-conomic class families, whereas 34% participants belonged to upper socioe-conomic class families.
Most of the school children participated in the study were ovovegetarian (48%) followed by nonvegetarian (27%) and lactovegetarian (18%). Only 7% of the participants were vegan. Most of the participants agreed to eating commercial packaged foods due to the influence of advertisements.
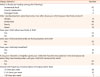
Majority of participants (95%) reported that according to them home made food is healthier than packaged foods. More than half of the participants were refusing new foods at first and consumed fruits once in a day. Most of the participants' parents reported their children have almost everything prepared at home. There were 81% participants who ate breakfast daily. Less than half of the participants reported that they consume their favorite food item when it sent by a relative, even when their stomach was already full. Frequency of consumption of empty calorie foods was high among more than half of the participants which included frequent consumption of candies, chocolates, and pastries. Only 19% participants did not finish their lunchbox daily and less than half of the participants preferred consuming green leafy vegetables in their diet (Table 2).
Table 2
Dietary behaviors of the subjects
![]()
Nutrient intake of children
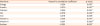
For the assessment of diet quality, dietary intake was assessed using 24-hour recall and the DQIIC as the index developed in the present study also included items related to nutrients. Intake of energy, protein, and fat in children was found to be higher than their respective RDA in most of the subjects (Table 3). The energy intake ranged between 909–2019 kcal per day and the protein intake ranged from 29–65 g/day. The percent intake of RDA for vitamin C was above 200%. On the contrary, their iron intake was lesser than the RDA in more than half of the participants and the lowest daily iron intake observed among the participants was 4 mg. There was no significant difference between the mean consumption of energy and nutrients intake of boys as compared to girls, as reflected by ‘t’ statistics and corresponding p-values. This finding was crucial in maintaining the same diet quality index for both boys and girls. The Karl Pearson's coefficient of correlation was computed between diet quality scores and nutrient intakes. The correlation was positive and significant for energy (r=0.234, p=0.019), protein (r=0.270, p=0.007), calcium (r=0.258, p=0.010), iron (r=0.219, p=0.029), vitamin C (r=0.199, p=0.047), and vitamin A, (r=0.261, p=0.009); while it was negative and significant for visible fat (r=−0.278, p=0.005) and sodium (r=−0.225, p=0.025). This reflects that the diet quality scores decrease when there is a visible increase in fat intake and/or sodium intake as shown in Table 4.
Table 3
Daily energy and nutrient intake by the subjects

Values are presented as number only or mean±standard deviation.
RDA: recommended dietary allowance, NS: non-significant.
The p-values were calculated using t-test between girls and boys.
![]()
Validation of Diet Quality Index for Indian children
DQIIC scores ranged from 51.0 to 88.0 points. Scores did not differ significantly between the two genders. Correlation coefficients for evaluation of test retest reliability for DQIIC and individual items in DQIIC ranged from 0.65 to 0.92. It was found that the correlation coefficient for test retest reliability for the index as well as the split half reliability were acceptable as shown in Table 5. Cronbach's alpha for the DQIIC was also found to be within the acceptable range. As presented in Table 5, the content validity as evaluated by the CVR was also good, suggesting that DQIIC is a reliable tool to screen nutritional disorders. At a glance, the data from DQIIC of a child can reflect a higher contribution of energy from fat, low overall dietary variety, low consumption of fruits. This can indicate a deficiency or predisposition to overweight and related disorders. This screening can suggest the need for further assessment.
Table 5
Reliability and validity statistics of the Indian Diet Quality Index for Indian children

![]()
Diet quality assessment using Diet Quality Index for Indian children
The diet quality of participants was evaluated using the DQIIC and each item of the DQIIC assessed different aspects that were directly or indirectly related to diet quality. The mean total score for the DQIIC was approximately 83% of the maximum possible score. For components related to adequacy in the index, a majority of the children reported that their intake for proteins, vitamin C, energy, fruit, sugar, pulses, and milk was either 50% or more than the 50% recommended intake. Most of the children consumed 50% or greater than 50% of the recommended intake for iron but failed to meet 100% recommended intakes of it. There were 31% participants who had a balanced diet on a regular basis, i.e., they consumed at least one serving from each food group daily, and 42% of the participants' food intake belonged to almost all food groups except for one. The intake of sodium was more than 2 g per 1,000 kcal per day in majority of the participants (91%) and contribution of fat to total energy (90%) in most of the participants was more than the 25%. More than half of the participants (55%) consumed empty calorie foods greater than five times per week and consumed food at home rather than outside seven days prior to the assessment. A majority of them ate meals more than three times a day.
Following the diet quality assessment by the DQIIC, total scores were calculated for each participant, and it was found that more than one third of the participants were in the moderately healthy category. Moreover, more boys as compared to girls were consuming a moderately healthy diet as is depicted in Table 6.
Table 6
Sex-based distribution of subjects according to statistically-calculated tertiles

| Diet quality (score) | All subjects n=100 | Boys n=53 | Girls n=47 |
|---|---|---|---|
| Unhealthy (≤72) | 33 | 16 (30.2) | 17 (36.2) |
| Moderately healthy (73–77) | 41 | 24 (45.3) | 17 (36.2) |
| Healthy (≥78) | 26 | 13 (24.5) | 13 (27.7) |
![]()
One third of the participants had an unhealthy diet and very few participants had a healthy diet.
DISCUSSION
Contrary to general beliefs and trends, the education status of mothers was higher than that of fathers. Frequent consumption of empty calorie foods such as candies, chips, chocolates, pastries, ice creams, etc., resulted in excessive consumption of energy but lack of diversity in diet owing to lesser number of food groups consumed. Breakfast skipping was not a commonly observed behavior in this study, where children were from upper middle socio-economic class. Prior research has indicated that skipping breakfast is positively related to low socio-economic status [1718]. It was also noticed that most of the participants did not consume meals outside of home and had almost everything prepared at home. In a previous study, it was found that children were skipping breakfast as they did not feeling hungry and did not like the food that was served; similar reasons were reported in our study as well [19].
In some areas of Udupi district in India, the prevalence of children who skipped breakfast was 23.5%, [20] which is closer to what was observed in our study. In another study, it was found that 20% children skipped breakfast [21]. Around 20–30% of children and adolescents skip breakfast in the developed world [22]. Younger children more than older children make demands for food products when they go shopping. They come across these products on TV advertisements, and are easily influenced by them [23].
The energy intake of the participants was reported to be higher than the RDA and similar findings were reported in a study on children belonging to two blocks of Lucknow District [24]. Higher consumption of fat rich miscellaneous foods could be a possible cause of this. Most of the participants had higher protein intake than the RDA. Similar results were reported among rural school going children from Hisar District of Haryana [25]. The fat intake among school children was also reported to be more than RDA in some studies [2627] and similar findings were reported in our study as well. This could be due to an increase in the intake of packaged potato chips, toffees, ice creams and chocolates. Mean vitamin C intake was found to be greater than the RDA among both boys and girls. These higher values could be due to sufficient intake of cauliflower, cabbage, mustard leaves, papaya, tomato, and most popularly guava. The intake of vitamin C was also observed to be higher than the RDA among school children of rural and urban blocks of Kangra and Kullu Districts [27]. However, the mean calcium intake was reportedly higher than the RDA for participants in the present study and this could be due to a high consumption of condensed milk based desserts. Similar results were shown in a study on school children of Hisar [25]. Iron intake was lesser than the RDA for all participants except for a few. Similar findings were reported among school children of Hisar District [25]. A low food intake of especially green leafy vegetables could be the main cause of it. This finding also supports the low β carotene intake by the participants of this study.
Participants in general did not skip meals and most of them finished their tiffin daily, which is the reason why most participants fell in the moderately healthy category of DQIIC. Dietary habits of most of the participants were good, with the only drawback being a high consumption of empty calorie foods. The few participants who fell in the unhealthy diet category were also the ones who skipped meals and consumed meals outside of the home. This suggests that the high fat and sodium content of commercial food lowers scores on DQIIC. Children categorized under healthy diet did not consume a high amount of empty calories and definitely had better dietary diversity. The correlation coefficient indicated that children categorized under ‘unhealthy’ had low energy intake. Moreover, their energy intake had a positive and significant correlation with their diet quality score. On the other hand, in the same group of participants, the r of diet quality scores with sodium was negative as well as significant. These results signify that those with low index scores consumed less food and made poor choices by choosing high salt foods. In this tool development endeavor, only content validity was studied, construct validity was not analyzed.
The findings of the present study suggest that the DQIIC has acceptable test retest reliability, split half reliability, and Cronbach's alpha. The CVR was also acceptable for DQIIC to be standardized. A split half reliability of greater than 0.7 is generally considered acceptable [28]. Correlation coefficients should be 0.7 or greater for high correlation [29]. It was Tuckman [13] who asserted that 0.50 or higher is acceptable Cronbach's alpha for scales based on assessment of attitudes. A low value of alpha could be due to a lesser number of questions, poor relation between items or heterogeneous constructs. The length of a test increases its reliability of a test, regardless of whether the test is homogenous or not. A high value of alpha (>0.90) might suggest redundancies and show that the test length should be reduced [30]. Cronbach's alpha coefficient of healthy eating index - 2010 was 0.68 which supported its reliability [31].
In conclusion, dietary behavior is of concern with respect to consumption of empty calorie and sodium-rich foods. The diet of the children who were participants of this study was primarily deficient in iron and β carotene. It was observed that the quality of diet of most of the children was ‘moderately healthy.’ The proposed objective was reached through the analysis of reliability and validity of the Diet quality index for Indian children. It is the first standardized index developed for the diet quality assessment of Indian children. On completion of statistical analysis, it was revealed that this index is reliable. Acceptable values for the reliability of this index were obtained for Cronbach's alpha and split half reliability coefficient. Pearson's correlation coefficient was also strong for test retest reliability. The content validity that was assessed with the help of CVR was also good. The present study provided enough evidence that DQIIC is not only easy to administer but is also reliable and valid tool and can be recommended for use in diet quality assessment studies on children between ages 7–9 in the future.
 XML Download