

 PDF
PDF ePub
ePub Citation
 Print
Print


INTRODUCTION
In the rehabilitation of large bone and gingival defects,12 it is necessary to have a color guide that covers the spectrum of natural gingiva, allowing the correct color to be selected for each individual patient.3 The demand for aesthetics is becoming greater, especially with respect to the premaxilla and in patients with broad smiles. Prosthetically mimicking the gingival color of a gingival area according to the adjacent natural color is difficult45 since the selection of gingival colors is limited. This limitation includes both the number of gingival color guides currently on the market and the number of gingival color tabs available, especially with respect to natural gingival color. The range of natural tooth color is wide, presenting many possibilities when faced with the task of subjectively choosing colors. In addition, there are many scientific articles that have studied the relationship between the color coordinates of natural teeth “in vivo” and the color coordinates of dental color tabs.6789 These authors analyzed the chromatic distribution of dental color tabs in the CIELAB space, which examined the chromatic distribution along the 3 spatial axes of a tooth.6,7,8,9 The color coordinates of a tooth were mathematically calculated according to the gender and age of the patient;101112 however, research regarding this is not as advanced for the gingival chromatic space.131415
In 1973, Sproull16 used the Munsell system for measuring color in dentistry. In order to numerically quantify color, the Standard Commission Internationale de l'Éclairage17 in 1976 defined color space using coordinates on 3 spatial axes: the L* coordinate represents a color's value and is determined by the amount of grey the color contains, which is equivalent to lightness/darkness and ranges from perfect white to full black (L* = 0 black; L* = 100 white); the a* coordinate is the red-green measurement axis (positive a* indicates the amount of red and negative a* indicates the amount of green); and the b* coordinate is the yellow-blue measurement axis (positive b* indicates the amount of yellow and negative b* indicates the amount of blue). The CIE 1976 L* a* b* system identified the components of the cylindrical or polar coordinates CIE L*, C*, h*: lightness, chroma, and hue, respectively. Moreover, it is possible to calculate the difference between 2 colors in a quantitative way using the Euclidian formula ΔE* = [(ΔL*)2 + (Δa*)2 + (Δb*)2]1/2
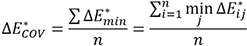
17 and the CIEDE2000 formula. CIEDE2000 has been extensively used in gingival color research181920 and has been shown to correlate better with visual assessments.318202122
where SL, SC, SH are the weighting functions for the lightness, chroma, and hue components, respectively; KL, KC, KH are the parametric factors to be adjusted according to the experimental conditions; and RT is the rotation function that accounts for the interaction between chroma and hue differences in the blue region.25 The CIEDE2000 formula was published by the CIE in 2001 and is considerably more sophisticated and computationally complex than the CIELab formula.2627 In addition, it is currently recommended by the CIE for color difference computation. In order to calculate the CIEDE2000 color difference formula, Sharma28 provides an Excel spreadsheet implementation with the parametric factors set to 1.
The first studies in relation to gingival color were published in the 60's when Ishikawa29 differentiated the color of attached gingiva from the color of marginal gingiva using his own visual guide. Years later, Baumgartner et al.30 differentiated between healthy and diseased gingiva: healthy gingiva had a more pink color and diseased gingiva appeared reddish-blue. In 1980, Dummett et al.31 stated that facial skin color was related to gingival and mucosal color in approximately 85% of cases. Many years later, dental coloring devices (spectroradiometers, colorimeters and spectrophotometers) were made available for quantifying the color coordinates of intraoral tissues. With a colorimeter, 3 chromatically differentiated areas can be distinguished, due to the degree of vascularization: free marginal gingiva, keratinized gingiva and alveolar mucosa.32 In this same year, 2005, Heydecke et al.33 attempted to determine the gingival color space from the Munsell Color System by subjectively identifying 5 color frequency peaks, which could be useful for constructing an intraoral color guide for soft tissues. One of the first studies associated with gingival color guides was published in 2009. The aim of this study was to determine and compare the error coverage of the gingival guide Lucitone 199 (4 shade tabs for denture base resin) and the gingival guide IPS Gingiva (10 shade tabs), as well as the combination of the two. The results showed that the combination of both guides did not significantly improve the coverage error of the Gingiva IPS guide (7.9 vs 8.6). The Lucitone 199 guide gave a worse performance, with a coverage error of 10.8, which was significantly greater than previous ones. In any case, the coverage errors were too large for these guides to be used clinically for assessing gingival color with any guarantee. Consequently, the need for developing new color guides became apparent, including new tabs covering the space of natural gingival color.13
The objective of the present study was to evaluate the use of Lucitone 199 gingival shade guide, IPS Gingiva shade guide, and those gingival shade guides developed by Huang et al.14 and Ito et al.15 on a sample of Spanish adults. In addition, the aim was to propose and evaluate a new gingival color guide valid for the general Spanish population. In this work, the null hypothesis considers that the above-mentioned guides cannot be used reliably for identifying distinct pink lightness. In the event this finding can be confirmed, an alternative gingival color guide would be proposed. The purpose of this study was to propose and assess a shade guide for pink gingival aesthetics using a Spanish population sample.
MATERIALS AND METHODS
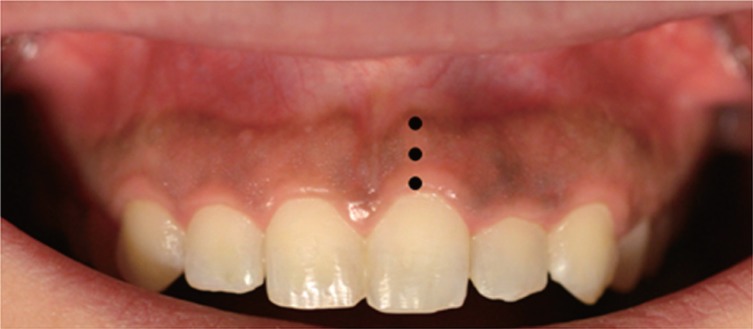
The study population comprised 259 Spanish adults who met the following inclusion criteria: patients older than 18 years of age and younger than 85 years; patients with a plaque index34 less than or equal to 25%3536 and a gingival bleeding index of less than 10%36; no visible melanin stains in the study area; the presence of at least a 2 mm-band of vestibular keratinized gingiva; and the presence of at least 1 tooth adjacent to the right and left of the selected incisor. The present study was satisfactorily evaluated by the Bioethics Committee of the University of Salamanca (USAL_2015-23.11), and after the participants were selected (n = 259), they provided informed consent following the ethical precepts formulated in the Helsinki Declaration of the World Medical Association on ethical principles for medical research in humans. The study was approved by the ethical review board of the authors' institution. All participants signed a consent form, and the color coordinates were measured 3 times (with removal and new replacement of the spectrophotometer measurement system) in the 3 reference areas located in the keratinized gingiva of 1 of the central incisors (Fig. 1).3738
- Reference area 1: 0 – 1 mm corresponding to the free gingival margin (cervical point).
- Middle reference area: (zenith) 2 – 4 mm, attached gingiva superior to the gingival margin (middle point of the attached gingiva).
- Upper reference area: Vestibular, approximately 5 mm of attached gingiva superior to the gingival margin (upper point of the attached gingiva).
Three pictures of each patient were taken and 3 repeated measurements (with the correct framing calibration) were performed on each of the 3 selected points in the gingiva surrounding the central incisor to ensure data reliability.143639 The participants were sitting in a dental chair in the vertical position with their heads supported and their mouths open. The instrument used to capture the images, a Spectroshade (MHT Optic Research, Niederhasli, Switzerland), was calibrated prior to taking the measurements of each patient. All images were taken in a dental cabinet with ambient lighting calibrated with a Philips TLD 95 fluorescent daylight that provided an illumination of 5000 − 5500 °K. In addition, the color temperature corresponded to “daylight” illumination, which is recommended for correct color selection.40 In order to ensure that the captured image was correct, the “Angle Control System”, including a part of the Spectroshade (MHT Optic Research, Niederhasli, Switzerland) spectrophotometer, was used. All images were selected when the image was centered with the green lined frame and icon displayed on the device screen.
Since it was necessary for the soft tissues within the study area to be in relative humidity, air was applied at a distance of 15 centimeters with the water and air equipment syringe over the gingiva of the central incisor being studied for 3 seconds, as described by Huang et al.14 The spectrophotometer was positioned perpendicular to the alveolar process of the patient, with the upper lip retracted,3641 without exerting pressure to avoid changing the color of the more superficial blood vessels.42 The Spectroshade software (version 2.30/2.31) then converted the spectral results obtained by the instrument into the L*, a*, and b* values for each measurement. One examiner, a dentist experienced in assessing gingival color with a Spectroshade spectrophotometer (MHT Optic Research, Niederhasli, Switzerland), performed all of the measurements.
The CIELab and CIEDE2000 coverage errors (ΔE*COV and ΔE'COV, respectively) for 4 gingival shade guides (Lucitone 199, IPS Gingiva, shade guide proposed by Huang et al.,14 and shade guide proposed by Ito et al.,15) were evaluated in the study population, using the mean values of measured gingival colors. For each of the 259 gingival measurements, the shade tab with the smallest color difference was determined for a particular shade guide system, and the average minimum color difference was then computed. The formulas used to calculate the CIELab (ΔE*COV) and CIEDE2000 coverage errors (ΔE'COV) of the evaluated shade guide were as follows13:
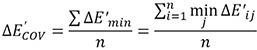
where ΔE*ij and ΔE'ij are the color differences between the gingival measurements of participant i and those of the tab j, calculated using the CIELab and CIEDE2000 formulas, respectively.
A new color guide was developed by obtaining solutions with different numbers of clusters (16, 15, …, 3) using a hierarchical cluster analysis. Color differences between their centroids were calculated for each cluster at the top, the middle, and the lower parts of the gingiva. In the analysis, the 5 coordinates (L*, C*, h, a*, and b*) were used in each of the parts of the gingiva (the clusters were formed using 15 variables), where the values were previously standardized to avoid any influence caused by the measurement scale of the coordinates.
Cluster analysis is a multivariate statistical technique that aims to uncover groups of objects with similar values based on a set of variables.4344 This technique classifies a set of objects in such a way that objects in the same cluster are more similar or “closer” to each other than to those in different clusters.4344 The clustering procedure employed here was the Ward sum of squares method,45 which is an agglomerative method where the fusion of 2 clusters is based on the size of an error sum-of-squares criterion. The objective at each stage was to minimize the increase in the total within-cluster error sum of squares, where an increase is proportional to the squared Euclidean distance between the centroids of the merged clusters.43
Of all the solutions obtained with the cluster analysis, the selection of the study solution involved 2 phases:
1) In the first, the solutions were selected so that the differences in shade between any pair of tabs were perceptible for all of the participants (100% perception) on any part of the gingiva (perception thresholds PT = ΔE* > 3.1 units).3946
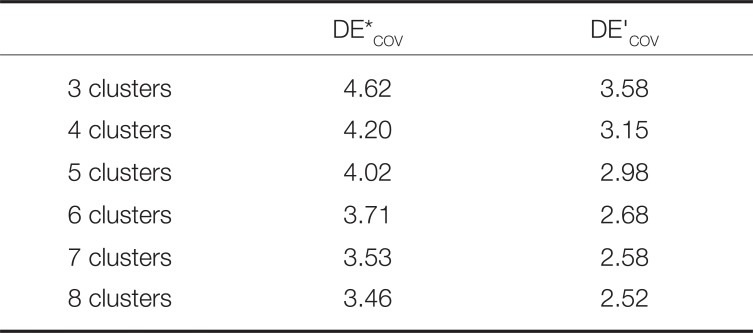
2) In the second, the coverage errors of the solutions selected in the previous phase were calculated. The solution chosen was that with the lowest coverage error (CE minimum) and a statistically significant decrease with respect to the coverage error of the solution with 1 cluster less (Fig. 2).
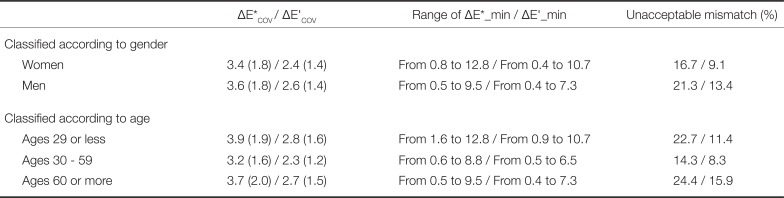
The objective of this study was to evaluate the performance of the chosen solution (in terms of coverage error) using the mean values of measured gingival colors. Furthermore, performance assessment of the proposed shade guide used on the subgroups of participants was accomplished by computing the coverage errors in the gender and age categories. The 50:50 acceptability thresholds (AT) of 4.6 for ΔE* and 4.1 for ΔE' were used to interpret the results.2247
RESULTS
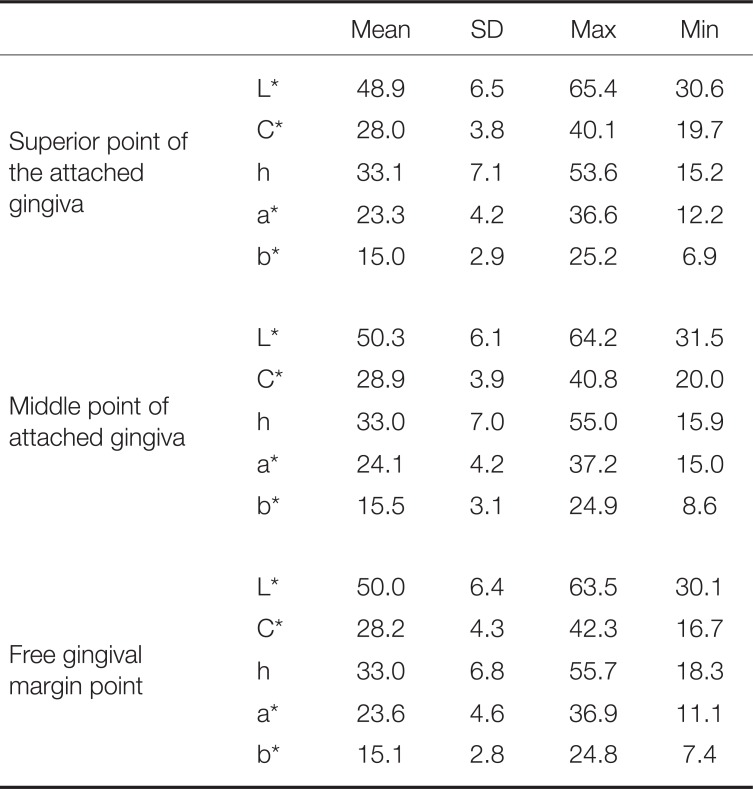
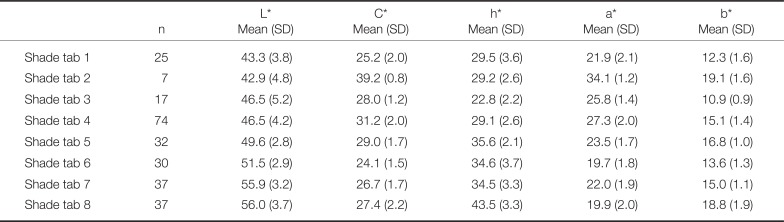
The study population consisted of 132 women and 127 men: patients were divided into 3 groups: those younger than 30 years (n = 44), those between the ages of 30 – 59 (n = 133), and those 60 years or older (n = 82). The descriptive statistics for the measured gingival CIELAB values for all subjects are summarized in Table 1.
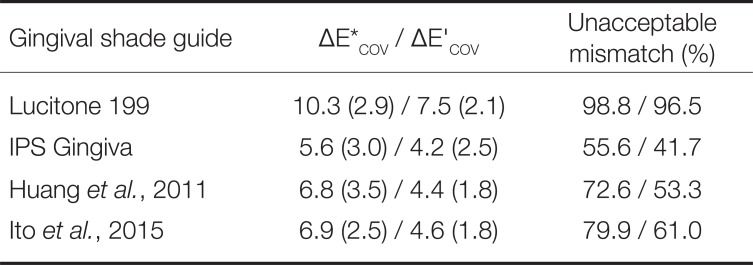
The coverage errors (CE), for the 4 shade guides evaluated using the study population, are listed in Table 2. This table also presents the unacceptable mismatch percentages for each guide. The unacceptable mismatch percentages were calculated as the percentages of individuals of the 50:50 sample with a color difference above the acceptability thresholds (Table 2)(AT* = 4.6 and AT' = 4.1).2247
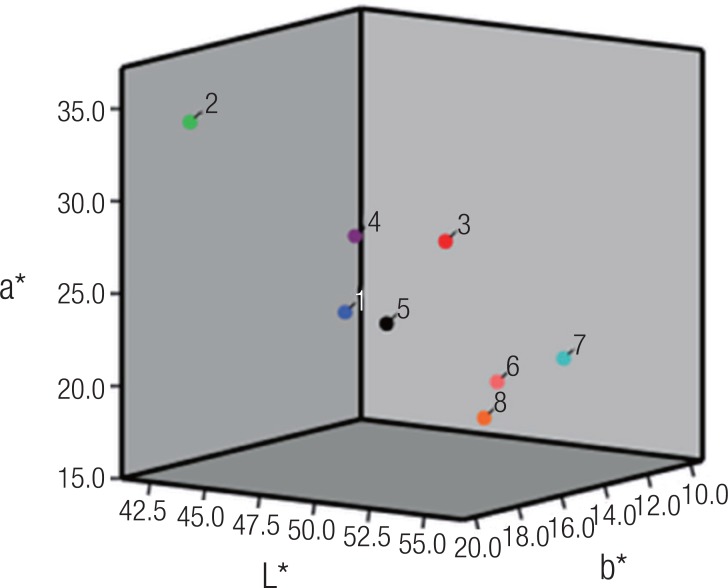
In view of the values obtained, these 4 shade guides did not provide a broad coverage of gingival colors in the Spanish population. It was therefore necessary to develop a shade guide for attached gingiva that represented different shades within this population. After carrying out the cluster analysis using different numbers of clusters (from 3 to 16) according to the methodology described above, the solutions with 3 to 8 clusters were selected in the first phase. In the second phase, the coverage errors were calculated for these solutions and the solution chosen was that with 8 clusters (see Table 3, Fig. 2). The centroids, in terms of mean values of the coordinates taken at the 3 different locations, are shown in Table 4 and Fig. 3.
The 28 color differences, ΔE*, between each pair of centroids ranged from 4.3 to 19.3 and were therefore perceptible to the human eye (from 3.8 to 18.6 in the maxillary part of the gingiva - start of the keratinized gingiva, 4.7 to 20.6 in the middle part - body of the keratinized gingiva, and 3.8 to 22.1 in the part of the free marginal gingiva). For the proposed guide, the CIELab coverage error was 3.5 and the values of ΔE*_min ranged from 0.5 to 12.8 with a standard deviation of 1.8; the CIEDE2000 coverage error was 2.5 and the values of ΔE'_min ranged from 0.4 to 10.7 with a standard deviation of 1.4. On the other hand, the percentages of individuals with a color difference above the acceptability thresholds (ΔE* = 4.6 and ΔE' = 4.1) (unacceptable mismatch percentages) were 18.9% with CIELAB classic formulae (49 out of 259) and 11.2% with CIEDE2000 formulae (29 out of 259). These same values, obtained by classifying the individuals by gender and age, are shown in Table 5.
DISCUSSION
Spectrophotometry was reliable for measuring gingival color5, and the oral spectrophotometer used in this study was one of the most advanced.45 However, we must point out the possible alterations of the color coordinates of the spectrophotometers due to the physical phenomenon “edge loss”42 and metamerism. “Edge loss” appears when measuring color with electronic devices with small window openings, since they are unable to register light scattered in translucent fabrics.42 Metamerism is observed in situations in which 2 color samples coincide under certain conditions (light source, observer, …), but not under other types of conditions. The main difference between the spectrophotometer and the spectroradiometer is that the former has a stable light source.404849 Nevertheless, recent studies used the color coordinates published by Ho et al.,50 who measured a single area of keratinized gingiva (ie, the upper central incisors) in order to collect the color coordinates on which they based their calculations and used spectroradiometry.32047 The exact location of this single data collection point on the keratinized gingiva is unknown. The CIELAB coordinates used in this study4 were collected from 3 parts of the keratinized gingiva (Fig. 1) using spectrophotometry and in a white population. These methodological differences can result from differences in the color coordinates on which the subsequent mathematical calculations are based. Thus, the CIELAB color coordinates published by Ho et al.50 are as follows: L*min 37.2 L*max 64.0, a*min 13.4, a*max 31.7, b*min 9.2, b*max 22.2. The amplitude in all of the coordinates of Gómez Polo et al.4 is greater at the midpoint of the keratinized gingiva than those of Ho et al.,50 except for the b*min coordinate: 13.450 vs. 15.04 (Table 1).
The coverage errors of the gingival shade guides evaluated were outside of an acceptable level; the IPS Gingiva shade guide system (Ivoclar Vivadent) provided the best matches. The results obtained by Bayindir et al.13 corroborated the superiority of the IPS Gingiva guide over the Lucitone 199 shade guide (mean ΔE*COV=8.6 vs ΔE*COV=10.8), although the values obtained by these authors13 were higher than those obtained in this study (5.6 and 10.3, respectively). In contrast, both the IPS d.SIGN gingival shade guide and the IPS e.max yield the greatest coverage errors (ΔE*COV=7.3 and ΔE'COV=5.3 for IPS d.SIGN and ΔE*COV=7.2 and ΔE'COV=5.2 for IPS e.max) when compared with other gingival shade guides such as Gummy Gingiva Indicator (Shofu), Vita VMP (VITA North America), and Eclipse (Dentsply). The Eclipse shade guide yielded the lowest coverage error (ΔE*COV=5.0 and ΔE'COV=3.7)46 when the chromatic compatibility of the 5 guides was compared with the color coordinates of Ho et al.50 The study of Sarmast et al.47 is limited by the fact that it only collects the color coordinates from a single example of the 5 types of guide studies (n = 5), given that it is common to find statistically significant differences between different lots of the same shade guide.4951 The size of these coverage errors (most of which were greater than the 50:50 acceptability thresholds for gingiva) highlights the need for a better design to optimize agreement between the color of the human gingiva and the colors available in commercial gingival shade guides.
The differences observed in the coverage errors described may be due to the fact that the guides were evaluated using a sample of individuals from 4 different ethnic groups (Caucasian, African American, Asian, and others),131550 since statistically significant differences in gingival color coordinates have been found among races.1550 By contrast, the 2 guides in the present study were evaluated in a much more homogeneous sample, comprising Caucasians only, although the sample size was greater. The present study suggested that, at present, there is a lack of suitable shade guides available for matching the color of attached gingiva within the Spanish population.
In 2011, a gingival guide made from the color coordinates (L*, a*, and b*) obtained using a spectrophotometer on a Thai population of 362 individuals, not homogeneously distributed with respect to gender and age, was proposed. 14 The study only included a single measurement on the middle part of the keratinized gingiva. Using the L* coordinate and the Ward Method, the total sample was divided into 4 main categories, which were later subdivided into 10 minor categories (3, 2, 3, and 2) using the values of coordinates a* and b*. The difference of color ΔE* between any of these 10 pairs of gingival colors ranged from 5.8 to 19.5 units (P > .001).14 Also, it is worth noting that the poor results obtained in the present study population using the guide proposed by Huang et al.14 contained 2 additional shade tabs that were not included in this work. This is probably due to the different CIELAB values in the 2 sets of individuals used to develop them; in the work by Huang et al.,14 L* ranges from 30.2 to 62.7, a* from 7.3 to 23.7, and b* from −0.9 to 25.3 and in the present study, L* ranges from 30.7 to 62.8, a* from 15.9 to 35.4, and b* from 9.4 to 23.7.
The Cluster analysis and spectrophotometry on the middle part of the keratinized gingiva were methods also used by Ito et al.,15 which are similar to the ones used in the present study. By contrast, the distribution and sample size is different from those used by Ito et al., since the sample is comprised of 120 patients, 60 of which are men and the rest women, classified into 5 age groups and 4 ethnic groups. Their results revealed 3 cluster centroids with the following mean L* a* b* values: (CLUSTER 1 = 51.0 ± 4.2, 27.7 ± 4.7, 18.3 ± 3.2), (CLUSTER 2 = 61.4 ± 4.5, 24.3 ± 4.3, 17.6 ± 2.3), and (CLUSTER 3 = 36.1 ± 4.1, 21 ± 4.9, 16 ± 5.2), (ΔE* = 6.0 ± 4.8), black (ΔE* = 6.7 ± 3.9), others (ΔE* = 5.8 ± 2.9), and white (ΔE* = 4.6 ± 2.7).14 In comparison, our results showed 8 clusters (Table 3 and Fig. 2) with color differences perceptible to the human eye in all pairs. In 2018, Ghinea et al.3 used a mathematical methodology that differed from that described above in order to design models of gingival shade guides that represent the keratinized human gingiva.50 The method was based on the FCM algorithm and nonlinear optimization. The authors calculated the coverage errors for the CIEDE2000 formula −ΔE'COV= 2.1 for a solution with 6 clusters ΔE'COV=2.8 for a solution with 3 clusters-and also for the CIELab formula-ΔE*COV=3.1 for a solution with 6 clusters and ΔE*COV=3.9 for a solution with 3 clusters.3 The coverage errors in the present study are slightly higher than those described above, despite being calculated with 8 clusters. However, our results are consistent with those for the 3- and 6-cluster models of Ghinea et al.3 in that the coverage error of our solutions decreased as the number of clusters increased. The data interpreted by Ghinea et al.3 followed the 50:50 acceptability threshold (AT) proposed by Perez et al.20 of ΔE'=2.8 and ΔE*=3.7 units, as calculated on calibrated computer screens. It is noteworthy that the solution proposed in this study has significantly lower coverage errors than the ATs reported by Pérez et al.20 (P = .001 and P = .015, respectively). Data analyzed in previous studies1415 were interpreted according to the acceptable tooth color ΔE* of 5.5 units. Another study evaluated color differences within a series of photographs of human gingiva that had been altered by Photoshop, and reported a 100% perceptibility threshold (PT) of ΔE*=3.1 units based on acceptance of all observers.39 The last value was the one considered in this work. The 50:50 ATs of 4.6 for ΔE* and 4.1 for ΔE' were used to interpret the results.2247
Without a suitable shade guide, with a sufficient range of gingival colors, it is difficult to make aesthetically pleasing prosthetics for patients. Hence, the aim of this study was to develop a gingival shade guide using the measured gingival CIELAB values of 259 Spanish adults. Although other studies have used spectrophotometric measurement to develop a shade guide,1415 the present study has also incorporated the use of cluster analysis. The method of using cluster analysis to develop a shade guide for matching pigments with human tissues has also been reported for teeth44 and gingiva,14 and Ward's method has recently been used to propose 2 gingival shade guides.1415 Furthermore, it should be noted that hierarchical clustering methods may give very different results on the same data, and empirical studies are rarely conclusive. What is clear is that no single method can be recommended above all others. However, Ward's method often appears to work well.45
The proposed gingival shade guide, obtained as a result of cluster analysis, consisted of 8 shade tabs, while the other guides evaluated consisted of 4 shade tabs (Lucitone 199), 10 shade tabs (IPS Gingiva), 10 shade tabs (proposed by Huang et al.14), and 3 shade tabs (proposed by Ito et al.15). The gingival guide proposed in this study is improved in comparison to the rest of commercialized gingival guides, since it is calculated mathematically so that the differences in color among its 8 shade tabs is the threshold of 100% chromatic perception on the gingival tissue (ΔE*=3.1 units).39 The results of this study suggested that the proposed color classification can be used as a gingival shade guide reference by dental laboratory technicians and dentists because it was derived from objective color coordinates taken “in vivo”.
No studies published to date have evaluated gingival guides developed specifically for the Spanish population. However, given the coverage errors of the guides evaluated in other populations, we might expect these guides to be of little use in clinical practice in Spain. Gingival shade guides do not provide broad coverage of natural gingival colors.413 In addition, it remains unclear which gingival shade guide is the most effective in producing the best visual shade match.
CONCLUSION
The CIELab and CIEDE2000 coverage errors of the 8 shade tabs of the gingival shade guide proposed were significantly lower than those of the other guides. Consequently, despite the limitations of this study, the proposed guide is more appropriate for matching gingival shade in the Spanish general population.

 XML Download