

 PDF
PDF Citation
 Print
Print


Abbreviations
BC
blue-collar worker
CTS
carpal tunnel syndrome
F
female
FTE
full-time equivalent
DM
diabetes mellitus
KECO
Korean Employment Classification of Occupations
M
male
NEI
National Employment Insurance
NHI
National Health Insurance
NHIS
National Health Insurance Service
NIOSH
National Institute for Occupational Safety and Health
VDT
visual display terminal
WC
white-collar worker
BACKGROUND
Carpal tunnel syndrome (CTS) develops when the median nerve in the carpal tunnel is compressed, and it generally occurs in workers who repeatedly engage in activities where their wrists are bent or pressed, which causes inflammation in the tendon [1]. Studies have reported that the prevalence of CTS ranges from 2.7% to 5.8% in the general population [2] and that CTS is more common in women than in men [3]. CTS is commonly associated with occupation-related causes [4]. According to a California occupational health program conducted as a part of the Centers for Disease Control and Prevention monitoring, a total of 139,336 individuals developed CTS between 2007 and 2014, with an incidence rate of 6.3 per 10,000 full-time equivalent (FTE). The incidence rate was three-fold higher among women than among men, and a high incidence of CTS was observed in textile, fiber processing and coating grinding, apparel accessory and other apparel manufacturing, and animal butchering and processing industries [5].
According to a study conducted in Korea, CTS in 51 (34.7%) of 147 patients diagnosed at a hospital was correlated to occupation-related causes [6]. In a study of 61 workers in an automotive part company, the prevalence of CTS was high among those working in the production and vacuum process [7]. Furthermore, the prevalence of CTS was high among workers in meats and fishery processing (26.1%), timber mills (29.4%) [8], service clerks (18.1%) [9]. Furthermore, 39.5% of 1,447 assemblers and visual display terminal (VDT) workers had wrist pain [10], and 33% of 42 female packaging workers presented with CTS [11]. The trends of CTS incidence were examined using a surveillance system. According to the CTS surveillance system, CTS in 228 (72.6%) of 314 patients evaluated between 2000 and 2003 was suspected to have an occupation-related cause [12]. In Gumi-si, among 144 cases of occupational musculoskeletal disease between 2001 and 2002, 42 (33%) were CTS [13]. Furthermore, an occupation-related musculoskeletal disease monitoring system was operated from 2000 to 2004 generally by receiving reports from hospitals and workplace nurses, and the cases were analyzed according to gender, age, region, and occupation. However, the annual number of cases reported was small (from 235 to 439 cases), and there were limitations in accurately understanding the trend, as the monitoring was solely dependent on hospital reports [12]. In countries other than Korea, most epidemiological studies on CTS, as introduced by the National Institute for Occupational Safety and Health (NIOSH) had a small sample size [14]. As shown in the present study, none of the epidemiological studies on the occupational musculoskeletal disease in Korea have utilized large-scale data, and such studies were not conducted overseas.
To date, the only available data about the incidence of CTS in Korea are the statistical data for approved workers' compensation for musculoskeletal disorders. However, in Korea, there are numerous cases in which companies directly compensate for occupational disorders without going through workers' compensation. Therefore, workers' compensation data are not a reliable dataset to accurately determine the incidence of CTS as an occupational musculoskeletal disorder. By contrast, National Health Insurance (NHI) data provide information about the incidence of CTS according to gender and age, and National Employment Insurance (NEI) data provides occupation-related data. Hence, combining both datasets can facilitate the examination of the distribution of CTS based on gender, age, and occupation; thus, the effects of individual and occupational factors on the onset of CTS can be indirectly examined. Furthermore, how CTS is correlated to variables, such as diabetes mellitus (DM), smoking, and alcohol drinking, can be assessed using the NHI data.
Thus, the present study investigated the number of patients of CTS according to gender, age, and occupation by analyzing both NHI and NEI data. Moreover, this was a pilot study for a subsequent retrospective cohort study.
METHODS
Study data
NHI and NEI data were used. Health insurance distinguishes between workplace and local subscribers. A work subscriber is comprised of workers at the workplace, government employees and educational personnel, and a local subscriber is targeted at those other than work subscribers. Among the health insurance beneficiaries, the dependant means a person who makes a living primarily by the employer and does not have any remuneration or income, including the spouse of the employer, immediate dependencies (including the direct line of the spouse), direct lineage (including the direct line of the spouse), and their spouses, siblings. In the case of the NEI, all workplaces employing one or more workers are required to sign up, but exceptions are those with less than 15 hours of work a week, civil servants and private educational personnels. The 2 datasets were linked using the residents registration numbers, and we obtained the data from the National Health Insurance Service (NHIS) after it was de-identified and coded. From the NHI data, general variables (e.g. gender, age, and eligibility), diagnostic variables (e.g. date of care and diagnosis code), and health examination variables (e.g. smoking and alcohol drinking) were obtained, and variables, such as the classification of occupations and workplace size (number of workers), work period were obtained from the NEI data. The SAS Enterprise Guide 7.1 (SAS Institute, Inc., Cary, NC, USA) software was used to match the NHI and NEI data and extracting data for analysis.
Selection of study participants
From the workers enrolled in the NEI in 2012, the primary NEI holders were selected (men: 5,978,213, women: 3,742,339), and the selected workers were classified according to the size of their workplace and occupation (Fig. 1).
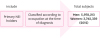
Based on the NHI data from 2008 to 2015, individuals diagnosed with CTS with a main or sub-diagnosis code of G560 and were then treated were selected. Then, the diagnosis codes at dental clinics, traditional Korean medical clinics, and pharmacies were excluded. Patients from the departments of ophthalmology, radio-oncology, nuclear medicine, preventive medicine, and pediatrics, which generally do not diagnose and treat CTS, were excluded. However, in such departments, cases in which CTS was diagnosed through electromyography and nerve conduction study were included in the analysis. Furthermore, only the records for the initial treatment was included to eliminate duplicate treatments (men: 107,518, women: 171,106; Fig. 2).
The NHI data and NEI data were matched. From the matched data, information about occupation was obtained from occupations of individuals at the time of CTS diagnosis, and patients who developed CTS within a month of employment were excluded from the analysis because these individuals and their previous occupations may have had an impact.
We could not include civil servants and faculties of private schools because they are not enrolled in NEI, and fields that are not matched between the two datasets (approximately 15% of NEI data) were also excluded from the analysis. Ultimately, the analysis included general enterprises and businesses with employees.
Information about gender, age, DM, smoking, and alcohol drinking were obtained from the NHI data, and data about the classification of occupation, length of employment, and number of employees according to age and occupation were obtained from the NEI data. Age was divided into seven groups in 10-year units. DM, smoking, and alcohol drinking were classified according to current status, and length of employment was divided into 5-year units. Workplace size was classified into fewer than 5, 5–49, 50–299, 300–999, and ≥ 1,000 employees.
Classification of occupations
Per the 2007 Korea Employment Classification of Occupations (KECO), 240 occupations were classified into blue-collar (BC) and white-collar (WC) jobs. Based on the task of carrying out the jobs described in the KECO, it was classified through the discussion of the researchers. Furthermore, per the NIOSH classification below, occupations were classified into high-risk groups (activity ≥ 2) and low-risk groups (activity < 2) for CTS based on their exposure to activities at risk for CTS [15].
Evidence of work-relatedness: a history of a job involving activities that increase the risk of CTS prior to the development of symptoms.
• Frequent, repetitive use of the same or similar movements of the hand or wrist on the affected side(s).
• Regular tasks requiring the generation of high force by the hand on the affected side(s).
• Regular or sustained tasks requiring awkward hand positions, such as use of a pinch grip (as when holding a pencil), extreme flexion or extension of the wrist, or use of the fingers with the wrist flexed on the affected side(s).
• Regular use of vibrating hand tools.
• Frequent or prolonged pressure over the wrist or base of the palm on the affected side(s).
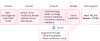
In BC, high-risk groups included those related to construction, manufacturing and assembly, those related to primary industry (farming and fishing), those related to textile manufacturing, and those related to sales, while in WC high-risk groups included those related to management, accounting, finance, legal and social welfare. In BC, the low-risk group included services, cultural, artistic and driving-related jobs, while in WC, the low-risk group included clergymen, high-ranking government officials, business executives, sales-related jobs and education-related jobs.
Analysis
General characteristics were compared using χ2 test. With the number of patients between 2008 and 2015 used as the numerator and the number of enrollees according to occupation, gender, and age as of 2012 used as the denominator, the number of patients per 100,000 individuals were compared. Therefore, the values expressed here are irrelevant to incidence and prevalence and are simply used for gender-, age-, and occupational comparisons. The values were compared according to gender, age, work type, and risk group. Frequency analysis and χ2 test were performed using the SAS version 9.2 (SAS Institute, Inc.) software.
RESULTS
General characteristics
The proportion of patients with CTS increased with age, with the highest number observed in men in their 40s (31,288, 29.2%) and women in their 50s (67,560, 39.5%). Then, the number was more likely to decrease. The number of men and women without DM was 102,716 (95.5%) and 167,047 (97.6%), respectively, and the number of men and women who were nonsmokers was 50,504 (58.6%) and 138,742 (97.4%), respectively. The number of men and women who do not drink alcohol was 24,953 (31.4%) and 92,920 (70.8%), respectively, and the number of men and women who were employed < 5 years was 74,916 (69.7%) and 141,933 (83.0%), respectively. The highest number of individuals in a workplace was 5–49 employees, with 40,273 (37.5%) men and 70,296 (41.1%) women, followed by a workplace with 50–299 (24,689, 23.0% vs. 42,203, 24.7%) and ≥ 1,000 employees (18,592, 17.3% vs. 21,282, 12.4%). Differences were observed between men and women in terms of all variables (Table 1).
Table 1
Number of patients with carpal tunnel syndrome according to age, DM, smoking, alcohol drinking, work period, number of employees

Number of subscribers according to gender and age
We identified the mean number of NEI subscribers in 2012 according to gender and age and the number of patients diagnosed with CTS (Table 2). The total number of NEI subscribers was 9,720,552 (5,978,213 men and 3,742,339 women), and 278,624 individuals were diagnosed with CTS (of which 107,518 were men and 171,106 were women). When these numbers were expressed as the number of patients per 100,000 individuals according to age and gender, the number of patients increased with age in both men and women (Table 2).
Table 2
Number of subscribers (2012) and number of patients with CTS (2008–2015) according to gender and age

Survey about type of work and risk groups
In total, 240 occupations were divided into BC and WC jobs, and each group was divided into high-risk and low-risk groups based on the degree of wrist usage to compare the number of patients per 100,000 individuals. The number of patients was higher in BC workers (3,247.5) than in WC workers (1,824.1). Regarding the degree of wrist burden, the number of patients with CTS was higher in the high-risk group (3,527.8) than in the low-risk group (1,908.2) among BC workers. Similarly, the number of patients with CTS was higher in the high-risk group (1,829.9) than in the low-risk group (1,754.4) among WC workers. Differences between BC and WC, and between men and women in each work type, were statistically significant. Considering gender, the number of patients with CTS was higher in women than in men among both BC workers (men: 1,871.0, women: 5,735.0) and WC workers (men: 1,369.9, women: 2,380.9). When wrist burden was compared according to sex and occupation, the number of patients with CTS was higher in the high-risk group among male BC workers (high-risk group: 1,936.8, low-risk group: 1,566.1) and female BC workers (high-risk group: 6,216.0, low-risk group: 2,556.5) and female WC workers (high-risk group: 2,426.2, low-risk group: 1,833.8). However, the number of patients with CTS was higher in the low-risk group than in the high-risk group among male WC workers (high-risk group: 1,342.8, low-risk group: 1,690.8) (Fig. 2). The difference between high-risk and low-risk in each group was statistically significant (Figs. 3 and 4).
Fig. 3
Number of patients with carpal tunnel syndrome per 100,000 individuals according to type of work and gender (2008–2015).
M: male; F: female; BC: blue-collar worker; WC: white-collar worker.
aThe χ2 test according to each group, p < 0.0001.
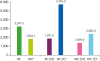
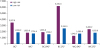
Fig. 4
Number of patients with carpal tunnel syndrome per 100,000 individuals according to gender, type of work, and risk group (2008–2015).
M: male; F: female; BC: blue-collar worker; WC: white-collar worker.
aThe χ2 test according to each groups, p < 0.01.
In addition, we analyzed the number of patients according to the type of occupation for BC and WC workers. In the BC category, the proportion of patients with CTS was highest among food processing-related workers (19,984.5), followed by food, lodging, travel, entertainment, and sports-related managers (18,803.1), cleaning and domestic helpers and other cleaning-related workers (18,226.7), health and medical service-related workers (16,698.6), and cutting and sewing-related workers (15,867.9). In the WC category, the proportion of patients with CTS was highest in social welfare and counseling specialists (7,444.1), followed by production-related clerks (5,764.3), accounting and book-keeping clerks (5,130.4), social service-related managers (education, legal, and health) (4,954.8), and finance and insurance-related clerks (4,866.8). Among the male BC workers, the number of patients with CTS was highest in food processing-related workers (9,216.6), followed by metal casting workers and forge hammersmiths (8,361.9), crop growers, (7,978.8), textile and shoe-related machine operators and assemblers (7,878.8), and automobile and automobile part assemblers (6,969.5). Among the female BC workers, the proportion of patients was highest in agriculture, forestry, and fishery-related elementary workers (33,118.6), crop growers (30,000.0), food, lodging, travel, entertainment, and sports-related managers (29,305.3), food processing-related workers (28,711.5), and automobile and automobile part assemblers (28,331.9). Among the male WC workers, the number of patients was highest in finance and insurance-related clerks (5,088.1), followed by production-related clerks (4,149.2), trades and transportation-related clerks (3,511.8), business administration and office clerks (3,412.6), and finance and insurance-related professionals (3,188.7). Among female WC workers, the proportion of patients was highest in social welfare and counseling specialists (8,395.1), followed by production-related clerks (8,245.5), social service-related managers (education, legal, and health) (6,848.4), business administration and office clerks (5,966.4), and accounting and book-keeping clerks (5,915.1) (Table 3).
Table 3
High number of patients with carpal tunnel syndrome per 100,000 individuals according to work type (2008–2015)

DISCUSSION
The present study used both the NHI and NEI data to analyze the trends of CTS according to sex, age, industry, and occupation among workers enrolled in NEI.
Results showed that the number of patients with CTS was 2.5 times higher in women than in men. In general, CTS is more common in women than in men, and the prevalence is higher among older adults [16]. In a study about the occupation-related features of patients diagnosed with CTS between 2001 and 2004 in the department of rehabilitation medicine of nine university hospitals, the prevalence was 6.2 times higher in women than in men [17], and in a study on the Dutch population in the Netherlands, the male-to-female ratio was 1:3.6 [18]. Although the exact ratio differs, the result showing that the prevalence was higher among women supports previous findings. This result may be attributed to the fact that women have smaller wrists than men [19]. In fact, one study has reported that women have a smaller cross-sectional area of the proximal carpal tunnel than men and that female patients with CTS had a smaller cross-sectional area of the carpal tunnel than the controls [20]. However, another study has shown that gender and the size of carpal tunnel are not significant factors [21]. Pregnancy and oral contraceptives may be risk factors of CTS [222324]. Furthermore, based on our results, the difference between female BC workers (5,735.0) and female WC workers (2,380.9) was more significant than that between male BC workers (1,871.0) and male WC workers (1,369.9). In addition to the anatomical cause mentioned earlier, this may be attributed the fact that women are more vulnerable than men to diseases as their wrist burden increases.
In the present study, the proportion of patients per 100,000 individuals was highest among individuals aged 70 years or older. The age group with a high incidence of CTS differs across studies. In one study, the incidence was highest in the 70–79 years old group for both men and women [25], and the prevalence was the highest among individuals in their 40s–60s in another study [1618]. In the present study, the proportion of patients was the highest among men in their 40s and women in their 50s. When the number of patients is expressed as the number per 100,000 individuals, the value is the highest in people in their 70s or older due to the difference in the denominator. The difference across studies may be due to the different sample sizes and different units of the results.
The number of patients with CTS was 1.8 times higher in BC workers than in WC workers, and the number of patients with CTS was higher in the BC category for both men and women. This result indicates that BC work has a greater wrist burden than WC work. Similarly, previous studies have found that CTS is more common in individuals with BC work than in those with WC work [262728]. The higher incidence of CTS in BC work than in WC work is attributed to the fact that BC work involves more motions with the risk of CTS, such as forceful use, repetitive hand use, constant firm gripping of object, exposure to strong regular vibration, intensive computer, keyboard, or mouse use [16]. One of the wrist-burdening tasks in office work is VDT work, which requires the use of a computer. VDT work in general office work entails document preparation and internet searches using a mouse and keyboard [29]. According to a study, the percentage of individuals using a computer for 8 hours a day was 47.6%. The incidence of musculoskeletal pain on the wrist/finger caused by VDT work was 21.5%, which ranked as the fourth highest, followed by shoulder (57.0%), neck (38.3%), and low back pain (24.9%) [30]. Furthermore, an association was observed between CTS and cumulative exposure to keyboard use [31], and the prevalence was high (13.1%) among computer professionals [32]. In a 1-year prospective cohort study, CTS was not associated with the use of keyboard, but the use of a mouse for more than 20 hours a week was associated with the onset of CTS [33]. However, one study has classified computer work into low-risk CTS work [16], and the results remain controversial [34]. Nevertheless, our results also confirmed the high proportion of individuals with CTS among WC workers; thus, the use of VDT is likely to have an impact on the onset of CTS.
In the BC category, the proportion of patients with CTS was higher in the high-risk group than in the low-risk group for both men and women. In the WC category, the number of patients with CTS was higher in the high-risk group than in the low-risk group among women, but the number of patients with CTS was higher in the low-risk group than in the high-risk group among men. The difference between risk groups was statistically significant. Among the occupations classified as a low-risk group, there was a high number of male patients with work types, such as senior officers and managers (1,317) and senior civil servants and senior corporate officers (395). Occupations in these categories include senior government officials, such as legislators, mayors, governors of the province, and head of a governors, president; and senior corporate officers, such as vice president, CEO, senior managing director, and managing director. One study has reported that CTS is highly prevalent among employees of government and public services [26], but there were no studies that investigated the association between CTS and senior public officials and managers and senior corporate officers. In the present study, we only included individuals who have been working in their current occupations for at least 1 month to eliminate the influence of their previous occupations. However, the effects of previous occupations cannot be completely eliminated, and high number of patients with CTS may be high due to the effects of physical activity (e.g., exercise) and age.
In the BC category, the number of patients with CTS was highest in food processing-related workers (19,984.5), followed by food, lodging, travel, entertainment, and sports-related managers (18,803.1), cleaning and domestic helpers and other cleaning-related workers (18,226.7), health and medical service-related workers (16,698.6), and cutting and sewing-related workers (15,867.9). Previous studies have reported that the prevalence of CTS among workers in the meat and fish processing industry was 26%, and 61 of 434 (14.1%) workers in the meat processing industry were diagnosed with CTS [35]. In total, 70 (48%) of 179 floor cleaners were diagnosed with CTS [36], and the work of cleaners in accommodations require the use of fingers or wrist [37]. Housekeepers and cleaners were at an increased risk for CTS than individuals with other occupations [38]. In a study on the current status of musculoskeletal symptoms among hospital employees, the prevalence of musculoskeletal symptoms was the highest in shoulders (48.7%), followed by lower back (34.6%), legs and feet (32.7%), neck (27.9%), and wrist, hand, and fingers (26.7%) [39]. In another study of care workers, the prevalence of musculoskeletal symptoms in the hand, wrist, and fingers ranked fourth (47.7%), followed by the neck (71.5%), shoulder (70.4%), and lower back (61.4%) [40]. The relative risk for CTS was 3.3 times higher among workers in carpet production than in the control group [41], and CTS accounted for 1.1% of tendinitis-related diseases in textile workers [42]. Moreover, 188 female garment workers complained of wrist pain (rate ratio: 4) and CTS (rate ratio: 3) [43]. Moreover, 8 of 102 workers in the forging industry with musculoskeletal symptoms had wrist pain [44]. In a study on 564 workers in the automobile assembly line, 37% of men and 57% of women had wrist pain, and 6.8% of men and 29% of women tested positive on the Phalen test [45]. Among 100 female workers in the tea-growing industry, 62 (62%) had bilateral CTS, whereas seven (7%) had unilateral CTS, indicating a higher prevalence of bilateral CTS [46]. Furthermore, the prevalence (4%–62%) of CTS was highest in individuals with upper extremity musculoskeletal disorders correlated to the agricultural industry based on studies within the past 5 years [47].
In the WC category, the proportion of patients with CTS was highest in social welfare and counseling specialists (7,444.1), followed by production-related clerks (5,764.3), accounting and book-keeping clerks (5,130.4), social service-related managers (education, legal, and health) (4,954.8), and finance and insurance-related clerks (4,866.8). In foreign studies, the incidence per 10,000 FTE was 13.0 for office and administrative support, 10.0 for community and social service (10.0), and 6.6 for business and finance workers, which were not as high as those in other occupations [5]. In another study, the second highest incidence was observed in the finance and insurance industry sector (1.19), followed by the manufacturing industry (2.53). In terms of occupations, the second highest incidence was noted in the office and administrative support industry (1.66), followed by the production industry (2.52), and the incidence of CTS was also high in the community and social service industry (1.28) [48]. An indirect comparison was possible because these studies examined similar industries and fields as those examined in our study. Particularly, the findings were similar as the incidence was high in the finance and insurance industry sector, office and administrative support, and community and social service industry. However, it was not as high as that for BC workers. However, one difference between these studies and our study is that they grouped all office workers into office and administrative support without further classifying them and that the occupations examined in these studies did not completely match ours.
This study had few limitations. First, the minor classification of the KECO (2007) was used to classify occupations. The KECO classifies occupation using major, sub-major, minor, and sub-minor classifications, and the occupational features of CTS can be examined if the sub-minor classification is used. However, we will use the minor classification to examine the features and conduct subsequent studies using the data because there are too many occupations included in the sub-minor classification. Second, we divided occupations into high-risk group and low-risk group according to their wrist burden. Although we classified the risk groups after several discussions among the investigators to minimize error, there is still a possibility of error. Third, approximately 15% of the NEI data could not be matched with the NHI data; thus, it must be excluded from the analysis. Although civil servants and faculties of private schools were excluded, we believe that our analysis is still significant as most general enterprises and businesses with employees were enrolled in the study.
Previous studies usually had small sample size and examined a single occupation or patients visiting a hospital or clinic. A study has used the monitoring system, but the study also had a small sample size and only used hospital case reports in a specific region. These limitations are evident in foreign studies as well. In contrast, the present study used large-scale data matching the NHI data and NEI data, and the entire nation, as opposed to a specific region in Korea, was analyzed. Moreover, another strength of this study is that it analyzed the indirect effects of musculoskeletal burden of each occupation on disease onset by comparing the number of patients with CTS to different occupations.
CONCLUSIONS
The present study used large-scale data matching the NHI data and NEI data, and the almost entire employed nation was analyzed. So, the results are expected to help identify occupational differences in patterns of CTS and to know more detail characters of CTS in Korea. Also, unlike previous studies, this study analyzed almost every occupation. High number of patients with CTS was seen in new jobs, as well as in previous studies. Further research is then needed through data from detailed occupations.
 XML Download