

 PDF
PDF Citation
 Print
Print


INTRODUCTION
Steady-state visual evoked potential (SSVEP) is a superposition of visual evoked potential (VEP) signals.1 As VEP is the first-order visual response that originates from the primary visual cortex (V1; Brodmann area 17), VEP can be easily acquired using repetitive presentation of visual stimuli. Furthermore, it is relatively easy to detect SSVEP using simple frequency analyses owing to its high signal-to-noise ratio (SNR).23 SSVEP has been reported to indicate various cognitive or illness conditions such as the amount of cognitive fatigue or migraine.45 SSVEP is also used as an important brain response for brain–computer interface (BCI)6 owing to its advantages over other BCI paradigms such as its intuitive nature, fast reaction time, and relatively high information transfer rate.78
Despite the usefulness of SSVEP, some researchers reported that SSVEP is not detectable in a minor segment of the population. These people are referred to as people with “SSVEP illiteracy” or “SSVEP deficit”. The percentage of individuals with SSVEP illiteracy is generally considered to be approximately the same as the number of persons with overall BCI illiteracy, which is 10%–25% of the potential users.91011 There is no clearly identified reason for SSVEP illiteracy, but it is suspected that individual differences in anatomical structure or physiological activation could be a major reason as in the case of other BCI illiteracies.12
Several approaches have been proposed for realizing more accurate SSVEP detection to potentially overcome SSVEP illiteracy. The majority of such studies have been focused on improving the efficiency of the SSVEP stimuli or improving the SSVEP detection algorithms.1013 However, there has been no successful study that addressed the SSVEP illiteracy issue by enhancing the signal itself by changing the underlying physiological activation of the cortex.
Non-invasive electromagnetic brain stimulation is a technology that stimulates certain areas of the brain using electrical or magnetic fields. Transcranial direct current stimulation (tDCS) is a representative stimulation method that applies a small direct current through the scalp into the intracranial brain tissues. According to previous reports, the use of tDCS devices contributes to the modulation of the neuronal activity.14 For instance, the P300 response was increased15 and motor cortex excitability was elevated1617 on applying tDCS. In addition, it has been reported that VEP can be modulated using tDCS. According to a study conducted by Accornero et al.,18 the amplitude of VEP elicited by low-contrast visual stimulation was enhanced by over 60% on stimulating the occipital lobe using tDCS. Another investigation reported that both the anodal and cathodal stimulation over the V1 primary cortex can modulate the VEP response by up to 20%.19
Although an increasing amount of evidence shows the potential of VEP modulation using non-invasive brain stimulation, there has however been no successful study thus far that demonstrated the possibility of enhancing SSVEP using neuromodulation approaches. To the best of our knowledge, only one study attempted to improve the SSVEP response by stimulating the visual cortex using tDCS; however, it reported inconsistent modulation of SSVEP responses on application of tDCS.20
Therefore, in this study, we have further investigated whether it is possible to enhance the SSVEP using tDCS. We first optimized the position of the tDCS electrode to maximize the stimulation current delivered to the primary visual cortex V1.21 The SSVEP signal was acquired before and after applying the tDCS, and the results obtained were compared with those obtained for the sham condition.
METHODS
Participants
A total of 20 subjects (fourteen men and six women, of 23.65 ± 4.09 years of age, and all right-handed) participated in the experiment. All the subjects had normal or corrected-normal vision and no history of psychological or visual diseases, which would otherwise have influenced the experiment. The volunteers were instructed not to drink alcohol-included beverages or perform strenuous activities 24 hours prior to the experiments to eliminate the effect of fatigue-related factors. In addition, the smokers amongst the volunteers were instructed not to smoke 4 hours prior to the experiment to eliminate the effect of the interaction between nicotinic receptors and tDCS.22
The tDCS
In the traditional applications of tDCS, the stimulation electrode is usually attached immediately above the target brain area. However, as recent studies have shown that the amount of stimulating current delivered to the target tissue is highly influenced by the position of the stimulation electrode,23 the electrode configuration was carefully determined in this study. As the electrodes for an electroencephalogram (EEG) recording should be attached near the V1 area, the anode and cathode electrodes were attached to Iz (inion) and Cz, respectively, according to the international 10–20 system. It was visually confirmed that the maximum current density was elicited in the visual cortex using the COMETS toolbox21 (Fig. 1). Therefore, we selected Iz instead of Oz as the anode location to attach EEG electrodes around the Oz location.
 | Fig. 1Electric field simulation result that shows the current density distribution elicited by transcranial direct-current stimulation. The red and blue pads on the cortical surface respectively indicate the anode and cathode attached to the Iz and Cz positions.
|
In this study, the stimulation current was provided by a transcranial stimulation kit (TCT Research Limited, Kowloon, Hong Kong). The sizes of the anode and cathode electrodes were 3 × 3 cm (9 cm2) and 5 × 5 cm (25 cm2), respectively. Each electrode was connected to a sponge pad soaked with 0.9% normal saline to reduce the impedance between the scalp and electrode. The sponge pad was covered with a rubber cover to prevent the leakage of the electric current other than at the contact area. The commercial tDCS device that we used for our experiment was designed not to give any clue about the current operation condition (real or sham stimulation).
The experimental paradigm was designed based on the experimental procedure provided in a study by Thair et al.24 Within a few seconds after the tDCS is applied, some participants may feel mild itching or tingling due to the sudden injection of the current.25 Therefore, in a typical tDCS sham stimulation, the same amount of current is injected for a short duration of time. Such short stimulation is reported not to significantly change the cortical excitability,14 but can effectively prevent the participant from recognizing which condition he or she was involved in.2526
Experimental paradigm
Fig. 2 shows the schematic overview of the entire experimental procedure. On each visit, the participant was sitting on a comfortable armchair, which was placed 80 cm away from a 24-inch LCD monitor. The experiment started immediately after the tDCS and EEG electrodes were attached to the participant's scalp.
 | Fig. 2Schematic overview of the experimental paradigm.tDCS = transcranial direct-current stimulation, SSVEP = steady-state visual evoked potential.
|
The participants visited twice with at least seven days apart for the experiment. The participant was assigned to either simulation or sham condition for each visit, where the order was assigned randomly but counterbalanced. For active tDCS condition, the stimulation current was set to 2 mA with a rising time of 30 seconds and a fall-down time of 3 seconds to prevent the participants from experiencing any pain due to a sudden current delivery. For sham condition, the stimulation was maintained for one minute and was automatically switched off (no current was applied). Both active and sham conditions lasted for 20 minutes including the rising and falling time periods, while the participant was instructed to gaze on the fixation cross displayed on the monitor.
To investigate the SSVEP response change due to tDCS or sham stimulation, we conducted a general SSVEP experiment using a checkerboard stimuli before and after the tDCS/sham condition. The checkerboard stimuli were displayed on a monitor of size 5 × 5 cm (visual angle, 3.58°) at three different frequencies (5, 6, and 7.5 Hz). These low frequencies were selected because they have been widely used for SSVEP-based BCI studies.5101112 Each trial consisted of the presentation of a fixation cross for 2 seconds, that of SSVEP stimuli for 10 seconds, and a resting period of 7 seconds. Each of the three frequencies was applied 15 times in a random order. The post-stimulation SSVEP experiment was conducted right after the tDCS electrodes were removed from the participants’ head.
EEG recording and analysis
In the present study, an EEG was recorded using a commercial EEG amplifier (WEEG-32; Laxtha Inc., Daejeon, Korea). Six gold-plated brass electrodes were attached at the occipital areas according to the 10–20 electrode system (O1, Oz, O2, PO3, POz, and PO4). The reference electrode and ground electrode were attached on the left and right mastoids, respectively. The sampling rate was set as 512 Hz.
The recorded EEG was pre-processed using MATLAB 2015b (MathWorks, Natick, MA, USA). Three subjects were excluded from the analysis due to excessive noise and artifacts. The raw EEG data was filtered using a fifth-order Butterworth high-pass filter with a 1-Hz cut-off frequency to eliminate baseline drifts and other low-frequency artifacts. Then the data was epoched from 0–10 seconds according to the stimulus onset. For each of 10-second epochs, the first and last 1-second data were discarded, thus resulting in an 8-second epoch for each trial. For spectral analysis, the epoch was then divided into 4-second sub-windows with 75% overlapping. If the sub-window contained a value exceeding ± 75 µV, it was discarded from the analysis. The average number of discarded sub-windows was 7.31 ± 16.79 for each participant, which corresponded to 0.54% of the total sub-windows.
First, we calculated the frequency spectrum of each sub-window using fast Fourier transform and then evaluated a mean frequency spectrum for each individual trial. The mean spectrum was then averaged across trials for three target frequencies (5 Hz, 6 Hz, and 7.5 Hz). We evaluated two commonly used features to quantify the SSVEP, amplitude and SNR, using the averaged frequency spectra. The SNR for each target frequency was calculated by dividing the amplitude at the target frequency by the average amplitude at the adjacent frequencies (from −0.5 to +0.5 Hz with respect to the target frequency),272829 resulting in a total of 306 conditions (17 participants × 3 target frequencies × 6 electrodes). Finally, the SNR and amplitude values were averaged across channels, yielding a total of 51 conditions, which were used to statistically evaluate the tDCS effect.
Statistical analysis
In order to investigate the effect of tDCS on SSVEP, we compared the amplitude and SNR values between the pre- and post-stimulation sessions. However, as tDCS is known to have a ceiling effect,3031 statistical comparisons between pre- and post-stimulation conditions were performed using several different subsets. We first gathered all the pre- and post-stimulation features (amplitude and SNR) for every stimulation frequency regardless of the subject and then selected frequency–subject combinations for which the pre-treatment SNR was less than a given threshold (referred to as the pre-SNR threshold). As we tested pre-SNR threshold values ranging from 1.5 to 2.5 with increments of 0.1, a total of 11 subsets were obtained. The initial threshold was set to be 1.5 because the number of conditions being tested showed normal distribution when the threshold value was greater than or equal to 1.5. We used the paired t-test to determine if there were significant changes in the SSVEP amplitude and SNR owing to the tDCS or sham stimulation.
RESULTS
Fig. 3 shows power density spectra at five electrodes with lowest SNRs, five electrodes with SNRs around 1.5, and five electrodes with highest SNRs, which were selected from pre-treatment SSVEP sessions. The electrodes with low SNRs showed no distinct SSVEP peak, whereas those with high SNRs showed clear SSVEP peaks. The electrodes with the SNRs around 1.5 showed small peaks at the stimulation frequencies, but the peaks were not as dominant as in the electrodes with high SNRs. These results suggest that the SNR is a good indicator to evaluate how strong the SSVEP response is. Fig. 4 shows an example of changes in the averaged power density spectra of a subject (participant #7). It can be clearly seen that the overall peak amplitudes were increased in 5 Hz and 6 Hz after tDCS but no meaningful change was observed in the sham condition.
 | Fig. 3Selected power density spectra with different SNR values: (A) Spectra at five electrodes with lowest SNRs, (B) Spectra at five electrodes with SNRs nearest to 1.5, and (C) Spectra at five electrodes with highest SNRs.SNR = signal-to-noise-ratio.
|
 | Fig. 4An example of changes in the averaged power density spectra of a subject (participant #4) after tDCS (left panel) and sham stimulation (right panel). The black lines indicate the SSVEP responses prior to the tDCS/sham treatment, whereas the red lines indicate the post-treatment SSVEP responses. The vertical shaded areas represent the frequency of the target visual stimulus.tDCS = transcranial direct-current stimulation, SSVEP = steady-state visual evoked potential.
|
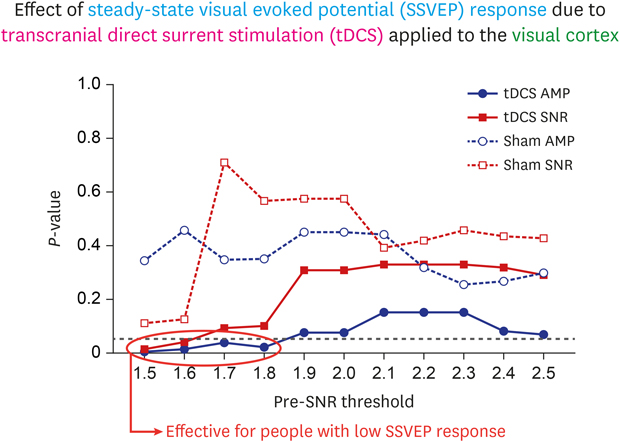
Fig. 5 shows the changes in the statistical probability with respect to the pre-SNR threshold that ranged from 1.5 to 2.5. In the sham condition, the statistical comparisons of the SSVEP amplitude and SNR values between pre-and post-stimulation conditions did not exhibit any significance for the pre-SNR thresholds. However, the SSVEP amplitude and SNR values showed significant differences between pre- and post-tDCS conditions when their pre-SNR values were sufficiently low. Therefore, it can be concluded that tDCS is effective in enhancing SSVEP responses in terms of amplitude and SNR when the SNR of the SSVEP recorded before the tDCS is low. In contrast, tDCS was not significantly effective in increasing SSVEP responses when the SNR before the tDCS was already high, which may be a reflection of the ceiling effect of tDCS. The detailed results are summarized in Table 1.
 | Fig. 5Statistical significance (probability) between pre- and post-stimulation SSVEP responses (amplitude and SNR values) with respect to the pre-SNR threshold. The P values were calculated using a paired t-test between the pre- and post-stimulation conditions. The dotted black horizontal line indicates the significance level of P = 0.05.tDCS = transcranial direct-current stimulation, AMP = amplitude, SSVEP = steady-state visual evoked potential, SNR = signal-to-noise-ratio.
|
Table 1
The average change in each feature value according to the pre-SNR threshold

No. denotes the number of steady-state visual evoked potential amplitudes or SNR features selected based on the pre-SNR threshold. The P values are calculated using a paired t-test between the pre- and post-stimulation conditions. The conditions with significant differences are indicated in bold letters.
SNR = signal-to-noise-ratio, tDCS = transcranial direct-current stimulation, FFT = fast Fourier transform.
![]()
DISCUSSION
In this study, we investigated whether the SSVEP responses can be modulated by tDCS. In contrast to a previous study32 that reported no significant change in SSVEP after tDCS, we found that the SSVEP can be modulated using tDCS in subjects with low SNR of SSVEP before the tDCS. This difference might have originated from the difference in the used layout of tDCS electrodes. In this study, we determined the electrode positions using finite-element-method-based electric field analysis, such that a maximum current density can be formed around the visual cortex. Furthermore, we delivered a larger current density to the target area for a longer duration and used narrower electrode pads to amplify the effect of the tDCS.
One might think that the increment of SSVEP responses after tDCS might be due to the changes in the ratio of the attended and unattended trials. Indeed, SSVEP responses are generally dependent on each participant's mental status, such as mental fatigue33 and vigilance.34 Increment of mental fatigue and decrement of vigilance level are known to reduce the amplitude and SNR of SSVEP responses. However, because decrement of vigilance and increment of mental fatigue are generally expected in a prolonged experiment, SSVEP responses should be lowered in the second (post-treatment) experimental session. However, our results showed increase of SSVEP responses in low pre-SNR participants after the active tDCS, suggesting that the increase of SSVEP responses might originate from the increased excitability of the visual cortex.
SSVEP illiterate individuals can be defined as individuals from whom it is hard to find distinguishable SSVEP patterns elicited by a pattern-reversal or flickering visual stimulus, and thereby showing low BCI performance.111425 Indeed, a few participants of this study showed very low SNR at specific frequencies and thus could be regarded as SSVEP illiterate individuals. For example, Fig. 6 shows an example of averaged frequency spectra obtained from a participant (participant #12). The spectra showed distinguishable peaks for 5 Hz and 6 Hz flickering stimuli, whereas there was no clear peak in the spectra for the 7.5 Hz stimulus.
 | Fig. 6Averaged frequency spectra of participant #12. No distinguishable SSVEP response was observed for the 7.5 Hz visual stimulus.SSVEP = steady-state visual evoked potential.
|
In future studies, to concretely verify that tDCS is effective in addressing the SSVEP illiteracy issue, a greater number of subjects and stimulation frequencies are required to be tested. Furthermore, even though we confirmed that our electrode layout could deliver a maximum current density to the primary visual cortex, it should be noted that the numerical simulation was performed using a single normal head model. As the current density and the effect of tDCS are known to be influenced by individual anatomical structures,4 the use of a greater number of head models for the optimization of the stimulation electrodes would improve the effectiveness of tDCS in enhancing the SSVEP responses.
 XML Download