

 PDF
PDF ePub
ePub Citation
 Print
Print


INTRODUCTION
Peritoneal carcinomatosis is the most common metastatic pattern in patients with advanced gastric cancer (GC). Surgical resection is usually not indicated and the response to conventional systemic therapy is poor [1]. Furthermore, peritoneal carcinomatosis with malignant ascites is associated with poor prognosis and is a major cause of death in patients with advanced GC [12]. Therefore, the accurate diagnosis of peritoneal carcinomatosis is essential for treatment selection and prognosis in patients with GC. Currently, cytological analysis of accumulated peritoneal fluid or ascites is performed to confirm peritoneal carcinomatosis because of its high specificity. However, its sensitivity is low [3], and patients with GC are sometimes required to undergo invasive examinations, such as laparoscopy or laparotomy, for the acquisition of peritoneal tissues. Therefore, a more sensitive and non-invasive method is necessary to detect peritoneal carcinomatosis or malignant ascites.
MicroRNAs (miRNAs) are small, endogenous, non-coding RNAs that repress protein translation by binding to target mRNAs [4]. Numerous miRNAs are aberrantly expressed in virtually all types of human cancers, including GC, and act as either oncogenes or tumor suppressors [5]. One of the remarkable aspects of miRNAs is their high degree of stability in the extracellular environment. MiRNAs can be enclosed in small vesicles, such as exosomes, apoptotic bodies, or microvesicles, which shield them from degradative enzymes [6]. Previous studies have mostly examined circulating extracellular miRNAs in serum or plasma. However, they can also be reproducibly retrieved from non-blood body fluids, including tears, saliva, breast milk, cerebrospinal fluid, urine, feces, pleural fluid, and ascites [6].
A specific peritoneal metastatic tumor-derived miRNA profile is more likely to be detected in malignant ascites than in primary tumor tissue or blood. In the current study, we searched for exosomal miRNAs that were differently expressed between benign liver cirrhosis-associated ascites (LC-ascites) and malignant gastric cancer-associated ascites (GC-ascites). Furthermore, we compared the discriminating abilities of these exosomal miRNA biomarkers with those of carcinoembryonic antigen (CEA), the most commonly used tumor marker, especially used for gastrointestinal cancers [78].
MATERIALS AND METHODS
Study design and ascites samples
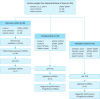
The overall study design and workflow are shown in Fig. 1. The 165 ascites samples (73 LC-ascites, and 92 GC-ascites), originating from 4 different centers, were obtained from the National Biobank of Korea between January 2012 and August 2017. The ascites samples were allocated to 3 cohorts in chronological order: 22 samples in the discovery cohort (10 LC-ascites and 12 GC-ascites), 70 in the training cohort (30 LC-ascites and 40 GC-ascites), and 73 in the validation cohort (33 LC-ascites and 40 GC-ascites).
Fig. 1
Overview of the study design.
LC = liver cirrhosis; GC = gastric cancer; qRT-PCR = quantitative reverse transcription-polymerase chain reaction; miRNA = microRNA.
The LC-ascites samples were obtained from patients with LC and no clinical or radiological evidence of malignancy. These patients were diagnosed on the basis of clinical features and the lack of evidence of malignant cells in the ascites samples. The GC-ascites samples were obtained from patients with a histological diagnosis of primary gastric adenocarcinoma, showing no evidence of other malignant tumors. Ascites samples were collected at the time of diagnostic or therapeutic paracentesis in GC patients with ascites. All GC-ascites samples were analyzed via cytological analysis and were pathologically confirmed as positive for adenocarcinoma. All ascites samples were centrifuged at 3,200×g for 10 minutes to eliminate large cell particles and cell debris. The supernatant from each sample was aliquoted into microcentrifuge tubes and stored at −80°C until further analysis.
The study protocol was reviewed and approved by the Institutional Review Board of the Chungbuk National University Hospital, South Korea (IRB approval number: CBNUH 2017-05-014), and written informed consent was obtained from all study participants.
Exosome isolation
The exosomes from each ascites sample (500 μL of supernatant) were precipitated using the miRCURY Exosome Isolation Kit (Exiqon, Woburn, MA, USA), in accordance with the manufacturer's instructions. This kit is a valuable alternative to ultracentrifugation and has been used as a commercial exosome isolation kit with reliable quality [910]. In brief, 10-mL samples were initially centrifuged at 3,200×g for 5 minutes to eliminate cell debris, and 4 mL precipitation buffer was added. Mixtures were vortexed and incubated at 4°C for 60 minutes and centrifuged at 3,200×g for 30 minutes at 20°C to precipitate exosome pellets. The supernatant was discarded completely and the pellet was re-centrifuged for 5 seconds and the residual supernatant was discarded. All exosomes were stored at −80°C immediately after isolation and prior to miRNA quantification.
Total RNA extraction and analysis
Total RNA was extracted from exosomes using the Trizol LS Reagent (Molecular Research Center, Cincinnati, OH, USA) in accordance with the manufacturer's instructions. Total exosomal RNA was quantified by measuring the absorbance at 260 nm and RNA integrity was confirmed using a Bioanalyzer 2100 (Agilent Technologies, San Carlos, CA, USA).
miRNA microarray
MiRNA profiling was performed using the Agilent Human miRNA Microarray Release 19.0 platform instrument (Agilent Technologies) comprising 2,006 human miRNAs. In brief, cyanine 3-labeled complementary RNA (cRNA) was generated using Agilent's Low RNA Input Linear Amplification kit with 500 ng total RNA. Labeled cRNA was then quantified using Nanodrop spectrophotometer. Labeled cRNA was applied on the microarray (8×60K; Agilent technologies) using Agilent Gene Expression Hybridization Kit. The hybridized microarray was washed using Agilent Gene Expression Wash Buffer Kit. The microarray chip was scanned using Agilent's DNA microarray scanner and the raw signal density was acquired from the feature Extraction software. Data analysis was performed using GeneSpring GX software v.12 (Agilent Technologies) and the DAVID Bioinformatics tool (National Institute of Allergy and Infectious Diseases, National Institutes of Health, Bethesda, MD, USA).
Quantitative reverse transcriptase-polymerase chain reaction (qRT-PCR)
Reverse transcription of 100 ng of isolated exosomal miRNA was carried out using the High-Capacity cDNA Reverse Transcription Kit (Applied Biosystems, Foster City, CA, USA), in accordance with the manufacturer's protocol, and specific miRNA primers provided with the TaqMan MicroRNA Assay (Applied Biosystems). Candidate miRNAs were quantified using qRT-PCR and the Applied Biosystems 7500 Fast Real-Time PCR System along with TaqMan Universal PCR Master Mix (Applied Biosystems). All reactions were carried out in triplicate, and relative miRNA expression levels were calculated using the 2−ΔΔCt method.
The following criteria were applied to identify reference miRNAs for qRT-PCR analyses: the miRNA was detected in all ascites samples, the mean fold-change in the expression levels between the LC-ascites and GC-ascites samples was <1.3, and the expression level did not differ significantly (P>0.05) between the 2 sample sets. Based on these criteria, 3 miRNAs (miR-4270, miR-197-5p, and miR-642a-3p) were identified as reference miRNAs in the discovery cohort (Supplementary Table 1). Of these, miR-642a-3p was the most stably expressed in the LC-ascites and GC-ascites samples in the training and validation sets (Supplementary Fig. 1), and was used as an endogenous control for data normalization.
Immunoassay for CEA in ascites samples
CEA expression levels in ascites samples were quantified using an Architect i4000SR chemiluminescent enzyme immunoassay (Abbott Laboratories, Abbott Park, IL, USA) in accordance with the manufacturer's instructions.
Statistical analysis
Mann-Whitney unpaired tests were performed to assess differences in the expression levels of miRNAs and CEA between LC-ascites and GC-ascites samples. We plotted receiver operating characteristic (ROC) curves and calculated the area under the curve (AUC) of significantly differentially expressed miRNAs and CEA to predict the diagnostic performance. The optimal cut-off points for candidate markers were determined based on the highest combined sensitivity and specificity for detection in the ROC curve analysis (with a specificity of least 0.6). Risk scores were assigned to all patients in accordance with a linear combination between the expression levels of the selected miRNAs and CEA, weighted in accordance with the regression coefficient. Furthermore, we conducted Stepwise Cox regression and stratification analyses. All statistical analyses were performed using the IBM SPSS Statistics software version 21.0 (IBM Corp., Armonk, NY, USA) and MedCalc software version 18.9.1 (MedCalc, Mariakerke, Belgium). All P-values were 2-sided and P-values below 0.05 were considered statistically significant.
RESULTS
Patient characteristics
Table 1 shows the baseline characteristics of the study participants. The median follow-up period was 50.1 months (range: 17.1–76.2 months) in the LC-ascites group, and no malignancies, including GC, were identified during this period. The most common cause of LC in the LC-ascites group was hepatitis B (50.0%–54.5%), followed by alcoholism (30.0%–40.0%). More than half of the patients in the GC-ascites group (52.5%–60.0%) were pathologically diagnosed with poorly differentiated tubular adenocarcinoma or poorly cohesive carcinoma of the stomach.
Table 1
Patient characteristics

Microarray analysis in the discovery cohort and selection of candidate exosomal miRNAs
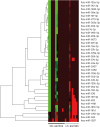
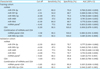
Microarray analysis revealed 36 miRNA variations with a fold-change ≥2.0 and a P<0.05 that could distinguish between LC and GC-ascites (Table 2). These exosomal miRNAs were significantly less expressed in the GC-ascites group than in the LC-ascites group (Fig. 2). Their relative expression levels were then measured via qRT-PCR analysis; 7 miRNAs (miR-574-3p, miR-197-3p, miR-181b-5p, miR-4481, miR-4701-3p, miR-623, and miR-181d) were considered candidate biomarkers and analyzed further (Table 2 and Supplementary Fig. 2).
Table 2
Microarray expression profile in the discovery cohort
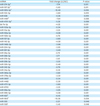
LC = liver cirrhosis; GC = gastric cancer; miRNA = microRNA; qRT-PCR = quantitative reverse transcriptase-polymerase chain reaction; LC-ascites = liver cirrhosis-associated ascites; GC-ascites = gastric cancer-associated ascites.
*The miRNAs with significant differential expression between the LC-ascites and GC-ascites samples in qRT-PCR analysis.
Validation of differentially expressed exosomal miRNAs in the training and validation cohorts
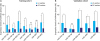
The expression levels of the 7 candidate miRNAs identified in the discovery cohort were examined in the training cohort of 70 ascites samples via qRT-PCR analysis. In the training cohort, 5 of these miRNAs (miR-574-3p, miR-197-3p, miR-181b-5p, miR-4481, and miR-181d) were significantly downregulated in the GC-ascites samples than in the LC-ascites samples (Fig. 3A). The expression levels of these miRNAs were then further examined in the validation cohort of 73 ascites samples. In the validation cohort, 4 of the 5 miRNAs (miR-574-3p, miR-181b-5p, miR-4481, and miR-181d) were significantly downregulated in the GC-ascites than in the LC-ascites samples (Fig. 3B).
Fig. 3
The qRT-PCR analysis of exosomal miRNA expression in the training (A) and validation (B) cohorts. Statistically significant differences were determined using Mann-Whitney tests, and).
SD = standard deviation; LC-ascites = liver cirrhosis-associated ascites; GC-ascites = gastric cancer-associated ascites; ns = not significant; qRT-PCR = quantitative reverse transcriptase-polymerase chain reaction.
*P<0.05; †P<0.001.
Diagnostic performance of exosomal miRNAs and CEA in the training and validation cohorts
The performances of differentially expressed exosomal miRNAs and CEA as individual diagnostic biomarkers of GC-ascites were evaluated via ROC curve analysis in the training and validation cohorts (Table 3).
Table 3
Diagnostic performance of exosomal miRNAs and CEA in the training and validation cohort
The 5 differentially expressed miRNAs in the training cohort exhibited AUC values ranging from 0.688 to 0.798. MiR-181b-5p displayed the highest value (0.798), with a sensitivity of 87.5% and a specificity of 73.3% (Fig. 4A). The AUC for CEA was 0.956, with a sensitivity of 92.5% and a specificity of 100% with a cut-off value of 2.2 ng/mL (Fig. 4B). When the cut-off value of CEA was analyzed at 5.0 ng/mL, which is currently considered the cut-off value for malignancy in clinical practice, the sensitivity and specificity of CEA were 82.5% and 100%, respectively. The AUC values resulting from the combinations of CEA with the 5-miRNA panel and with the sole miR-181b-5p were 0.980 and 0.981, respectively (Fig. 4C and D), and both combinations displayed a sensitivity of 92.5% and a specificity of 100%.
Fig. 4
ROC curve analysis for the diagnosis of GC-ascites in the training (A-D) and validation (E-H) cohorts. Each panel shows the AUC, sensitivity, and specificity values for miR-181b-5p (A, E), CEA (B, F), CEA+miRNA panel (C, G), and CEA+miR-181b-5p (D, H).
ROC = receiver operating characteristic; AUC = area under the curve; GC-ascites = gastric cancer-associated ascites; CEA = carcinoembryonic antigen; miRNA = microRNA.
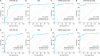
The AUC values for the 4 differentially expressed miRNAs identified in the validation cohort ranged from 0.777 to 0.846, and the AUC of miR-181b-5p was the highest at 0.846, with a sensitivity of 87.5% and a specificity of 78.8% (Fig. 4E). The AUC for CEA was 0.885, with a sensitivity of 87.5% and a specificity of 81.8% with a cut-off value of 1.0 ng/mL (Fig. 4F). When the cut-off value of CEA was analyzed at 5.0 ng/mL, the sensitivity and specificity of CEA were 60% and 100%, respectively. The AUC value for the combination of the 4-miRNA panel and CEA was 0.901, with a sensitivity of 85.0% and a specificity of 90.9% (Fig. 4G); the performance was improved (AUC=0.946) when miR-181b-5p was combined with CEA, with a sensitivity of 82.5% and a specificity of 96.7% (Fig. 4H).
DISCUSSION
To our knowledge, this study is the first comprehensive and large-scale evaluation of exosomal miRNAs isolated from malignant ascites in GC. Our results showed that specific exosomal miRNAs in ascites potentially distinguished benign ascites from malignant GC-ascites. The expression levels of miR-574-3p, miR-181b-5p, miR-4481, and miR-181d were significantly lower in GC-ascites than in LC-ascites. Among these miRNAs, miR-181b-5p displayed the best diagnostic performance. Compared with that of the most commonly used tumor marker in the ascites samples, CEA, the diagnostic performance of miR-181b-5p was lower in the training cohort but comparable in the validation set. However, the sensitivity of miR-181b-5p was superior to that of CEA, using the CEA cut-off value of 5.0 ng/mL, which is the general clinical cut-off value for malignancy. Finally, the diagnostic performance of CEA for GC-ascites was improved when this marker was analyzed with miR-181b-5p.
Peritoneal carcinomatosis is associated with poor prognosis in almost all cancers. Hence, accurate diagnosis of this condition is crucial. Furthermore, when cancer patients develop ascites, several comorbid diseases other than malignant ascites, including benign liver disease, heart failure, renal disease, or infections should be considered, although the incidences of these conditions are very low. It is also important to accurately diagnose microscopic peritoneal metastasis. Cytological examination of intraoperatively collected peritoneal lavage fluid is performed to diagnose microscopic peritoneal metastasis [1112]. Ascites or peritoneal lavage fluid samples are more suitable for evaluation of peritoneal carcinomatosis than primary tumor tissues or blood samples because of their closer proximity and direct contact with tumors within the peritoneum and omentum. Several recent studies have described miRNAs in ascites or peritoneal lavage fluid as putative diagnostic biomarkers of malignant ascites in ovarian cancer or GC [131415161718] (Supplementary Table 2). Recently, Tokuhisa et al. [15] examined exosomal miRNA expression in peritoneal lavage fluid and ascites from GC patients with peritoneal metastasis and reported significant upregulation of miR-21 and miR-1225-5p in the peritoneal lavage fluid of patients with serosa-invasive GC (T4) than in those of patients with non-serosa-invasive disease (T1–3). Furthermore, Schindler et al. [18] reported that not only patients with GC but also, in general, patients with peritoneal carcinomatosis displayed significantly higher levels of miR-21 and miR-186 in ascites samples in comparison with patients with portal hypertension. However, most studies examining peritoneal lavage fluid or ascites analyzed relatively small numbers of miRNAs and few ascites samples for a comprehensive and systematic validation of diagnostic biomarkers of peritoneal carcinomatosis with malignant ascites. In the current study, we used microarrays to screen a large number of miRNAs in ascites samples and validated differentially expressed exosomal miRNAs, using relatively large, independent cohorts obtained from 4 different medical centers. Furthermore, we compared the exosomal miRNA profiles of GC-ascites samples containing adenocarcinoma cells with those of tumor-free benign LC-ascites to evaluate potential diagnostic biomarkers for GC-ascites.
Furthermore, we compared the distinguishing potential of exosomal miRNA biomarkers with that of CEA, the most commonly used tumor marker. The AUC value of CEA of the GC-ascites was 0.956 in the training cohort and 0.885 in the validation cohort, indicating a relatively high diagnostic value for diagnosing GC-ascites. In particular, the sensitivity of CEA in the ascites was 92.5% in the training cohort and 87.5% in the validation cohort, greater than 30%–70% of previously reported values [7192021]; thus, the sensitivity of CEA for malignant ascites may have been overestimated. This facilitated the analysis of only GC-ascites samples, confirmed with adenocarcinoma, to clarify the diagnostic value of exosomal miRNA for GC-ascites. Malignant ascites display a positive result on cytological analysis only 40%–60% of the time [3]; CEA levels in malignant ascites with negative results on cytological analysis were lower than those with positive results on cytological analysis [22]. In addition, the optimal diagnostic cut-off value of CEA for GC-ascites was determined using ROC curve analysis with the highest sensitivity and specificity to diagnose GC-ascites; consequently, the cut-off value of CEA was 2.2 ng/mL in the training cohort and 1.0 ng/mL in the validation cohort. These cut-off values were lower than 5.0 ng/mL, which is currently considered a clinical cut-off value for malignancy. When the cut-off value of CEA was analyzed at 5.0 ng/mL in our cohort, the sensitivity of CEA for GC-ascites was decreased. Thus, the cut-off value of CEA contributed to the high sensitivity of CEA in the present ascites samples. The cut-off value of CEA of the ascites is reportedly less than 5.0 ng/mL in diagnosing malignant ascites [192223]; therefore, a lower cut-off than 5.0 ng/mL (for serum CEA) should be considered in ascites samples, and further studies on appropriate diagnostic cut-offs for malignant ascites in ascites samples are warranted.
The levels of miR-574-3p, miR-181b-5p, miR-4481, and miR-181d were significantly lower in the GC-ascites samples than in LC-ascites samples. Among these miRNAs, miR-181b-5p displayed the best diagnostic performance for GC-ascites. MiR-181b expression has been analyzed in many types of human cancer, and contrasting effects were apparently observed in different cancer types. For example, miR-181b is upregulated in lung, colon, and breast tumors but downregulated in gliomas [24252627]. Regarding GC, some studies have reported oncogenic properties for miR-181b, whereas others report its role as a tumor suppressor. Several studies have reported that miR-181b is significantly overexpressed in GCs compared to normal gastric tissue [2829]. In addition, in vitro studies revealed that miR-181b can inhibit tumor suppressing genes such as caudal-type homeobox 2 (CDX2) or tissue inhibitor of metalloproteinase 3 (TIMP3) [3031]. However, other studies have reported that miR-181b is downregulated in the serum of patients with GC compared to normal gastric tissue and control serum, respectively [3233]. Furthermore, in vitro studies have reported that miR-181b overexpression suppresses proliferation and induces apoptosis in GC cells through negative regulation of the oncogene cAMP responsive element binding protein 1 (CREB1) [34]. In addition, miR-181b can inhibit aerobic glycolysis of tumor cells, termed the “Warburg effect,” suggesting that it may play a novel role in metabolic reprogramming in GC cells [35]. Previous functional studies in gliomas reported that miR-181b suppresses tumor growth by targeting the insulin-like growth factor 1 receptor (IGF-1R) oncogene [27]. These apparently discordant findings potentially reflect the differences in miR-181b target genes in various cancers or even in different microenvironments associated with the same cancer type.
In the current study, we could not compare miRNA expression profiles of GC-ascites samples with those of normal peritoneal fluids because paracentesis is an invasive method that cannot be performed for healthy volunteers. Therefore, we harvested LC-ascites samples as a control because LC is the most common cause of benign ascites. Several recent studies have reported that miR-181b, miR-574-3p, and miR-181d were upregulated in patients with LC compared to healthy controls [363738]. Therefore, it is unclear whether downregulation of these identified exosomal miRNAs in GC-ascites, compared to the LC-ascites, reflects their role as tumor suppressors or, on the contrary, is a consequence of abnormal regulation of these miRNAs in LC-ascites. It would be ideal to compare benign and malignant ascites samples in the same peritoneal cavity within the peritoneum, which comprises serous membranes and a network of mesothelial cells and collagen.
In conclusion, we identified several exosomal miRNAs in ascites with clinical significance in diagnosing GC-ascites and our results show that the combination of miR-181b-5p and CEA profiling displayed an optimal diagnostic performance. However, false-positive findings are a serious concern with respect to the type of diagnostic biomarkers, especially malignancy. Therefore, miR-181b-5p expression in ascites should not be considered an alternative to cytological analysis (the latter being a reliable confirmative diagnostic method with high specificity for malignant ascites). As a single biomarker, its diagnostic value is not as adequate owing to its lower specificity than CEA, a commonly used biomarker. However, the combination of CEA and miR-181b-5p may serve as a potential diagnostic biomarker to distinguish between non-malignant and GC-ascites, especially when diagnosing ascites with negative or inconclusive cytological findings. Further functional analyses are required to determine the relevant functional targets of the identified candidate miRNA biomarkers and the biological significance of their differential expression in GC-ascites.
 XML Download