

 PDF
PDF ePub
ePub Citation
 Print
Print


Abstract
Purpose
The purpose of this study was to develop predictive models for pressure ulcer incidence using electronic health record (EHR) data and to compare their predictive validity performance indicators with that of the Braden Scale used in the study hospital.
Methods
A retrospective case-control study was conducted in a tertiary teaching hospital in Korea. Data of 202 pressure ulcer patients and 14,705 non-pressure ulcer patients admitted between January 2015 and May 2016 were extracted from the EHRs. Three predictive models for pressure ulcer incidence were developed using logistic regression, Cox proportional hazards regression, and decision tree modeling. The predictive validity performance indicators of the three models were compared with those of the Braden Scale.
Results
The logistic regression model was most efficient with a high area under the receiver operating characteristics curve (AUC) estimate of 0.97, followed by the decision tree model (AUC 0.95), Cox proportional hazards regression model (AUC 0.95), and the Braden Scale (AUC 0.82). Decreased mobility was the most significant factor in the logistic regression and Cox proportional hazards models, and the endotracheal tube was the most important factor in the decision tree model.
Conclusion
Predictive validity performance indicators of the Braden Scale were lower than those of the logistic regression, Cox proportional hazards regression, and decision tree models. The models developed in this study can be used to develop a clinical decision support system that automatically assesses risk for pressure ulcers to aid nurses.
Go to : 
References
1. Lyder CH. Pressure ulcer prevention and management. Journal of the American Medical Association. 2003; 289(2):223–226. https://doi.org/10.1001/jama.289.2.223.

2. Lyder CH, Wang Y, Metersky M, Curry M, Kliman R, Verzier NR, et al. Hospital‐acquired pressure ulcers: Results from the national medicare patient safety monitoring system study. Journal of the American Geriatrics Society. 2012; 60(9):1603–1608. https://doi.org/10.1111/j.1532-5415.2012.04106.x.
3. Agency for Healthcare Research and Quality. 1. Are we ready for this change? [Internet]. Rockville (MD): Agency for Healthcare Research and Quality;c2014. [cited 2018 May 17]. Available from:. https://www.ahrq.gov/professionals/systems/hospital/pressureulcertoolkit/putool1.html.
4. Kim KN, Kang KJ, Lee HS, Shin YH, Kim SK, Park KH, et al. Survey on pressure ulcers and influencing factors of stage change in acute university hospital inpatients. Journal of Korean Clinical Nursing Research. 2011; 17(3):433–442.
5. Lee HN, Park JS. Nutrition-related factors predicted pressure ulcers in intensive care unit patients. Journal of Korean Academy of Fundamentals of Nursing. 2014; 21(4):413–422. https://doi.org/10.7739/jkafn.2014.21.4.413.
6. Shin KR, Kim M, Kang Y, Jung D, Eom JY, Kweon YR. Pressure ulcers in long-term care hospitals in Korea: Prevalence and risk factors. Journal of the Korean Gerontological Society. 2012; 32(1):115–127.
7. Alderden J, Rondinelli J, Pepper G, Cummins M, Whitney J. Risk factors for pressure injuries among critical care patients: A systematic review. International Journal of Nursing Studies. 2017; 71:97–114. https://doi.org/10.1016/j.ijnurstu.2017.03.012.
8. Benoit R, Mion L. Risk factors for pressure ulcer development in critically ill patients: A conceptual model to guide research. Research in Nursing & Health. 2012; 35(4):340–362. https://doi.org/10.1002/nur.21481.
9. Anthony D, Papanikolaou P, Parboteeah S, Saleh M. Do risk assessment scales for pressure ulcers work? Journal of Tissue Viability. 2010; 19(4):132–136. https://doi.org/10.1016/j.jtv.2009.11.006.
10. Schoonhoven L, Haalboom JR, Bousema MT, Algra A, Grob-bee DE, Grypdonck MH, et al. Prospective cohort study of routine use of risk assessment scales for prediction of pressure ulcers. British Medical Journal. 2002; 325(7368):797. https://doi.org/10.1136/bmj.325.7368.797.
11. Serpa LF, Santos VLCG. Validity of the Braden nutrition subscale in predicting pressure ulcer development. Journal of Wound, Ostomy and Continence Nursing. 2014; 41(5):436–443. https://doi.org/10.1097/WON.0000000000000059.
12. Skogestad IJ, Martinsen L, B⊘rsting TE, Granheim TI, Lud-vigsen ES, Gay CL, et al. Supplementing the Braden scale for pressure ulcer risk among medical inpatients: The contribution of self‐reported symptoms and standard laboratory tests. Journal of Clinical Nursing. 2017; 26(1-2):202–214. https://doi.org/10.1111/jocn.13438.
13. Wang LH, Chen HL, Yan HY, Gao JH, Wang F, Ming Y, et al. Inter‐rater reliability of three most commonly used pressure ulcer risk assessment scales in clinical practice. International Wound Journal. 2015; 12(5):590–594. https://doi.org/10.1111/iwj.12376.
14. Huston CJ. Professional issues in nursing: Challenges and opportunities. 3rd ed. Philadelphia (PA): Lippincott Williams & Wilkins;2013. p. 1–433.
15. Hatanaka N, Yamamoto Y, Ichihara K, Mastuo S, Nakamura Y, Watanabe M, et al. A new predictive indicator for development of pressure ulcers in bedridden patients based on common laboratory tests results. Journal of Clinical Pathology. 2008; 61(4):514–518. https://doi.org/10.1136/jcp.2007.050195.
16. Cho IS, Chung E. Predictive bayesian network model using electronic patient records for prevention of hospital-acquired pressure ulcers. Journal of Korean Academy of Nursing. 2011; 41(3):423–431. https://doi.org/10.4040/jkan.2011.41.3.423.
17. Kim H, Choi J, Thompson S, Meeker L, Dykes P, Goldsmith D, et al. Automating pressure ulcer risk assessment using documented patient data. International Journal of Medical Informatics. 2010; 79(12):840–848. https://doi.org/10.1016/j.ijmedinf.2010.08.005.
18. Tetrault JM, Sauler M, Wells CK, Concato J. Reporting of multivariable methods in the medical literature. Journal of Investigative Medicine. 2008; 56(7):954–957. https://doi.org/10.2310/JIM.0b013e31818914ff.
19. Cai Q, Salmon JW, Rodgers ME. Factors associated with long-stay nursing home admissions among the U.S. elderly population: Comparison of logistic regression and the Cox proportional hazards model with policy implications for social work. Social Work in Health Care. 2009; 48(2):154–168. https://doi.org/10.1080/00981380802580588.
20. Bae HS, Cho DH, Suk KH, Kim BS, Choi KL, Lee JY, et al. Data mining using SAS enterprise miner. Seoul: Kyowoosa;2004. p. 1–315.
21. Park SK, Park HA. Factors affecting the time to occurrence of hospital-acquired pressure ulcers using EHR data. Studies in Health Technology and Informatics. 2017; 245:1113–1117. https://doi.org/10.3233/978-1-61499-830-3-1113.
22. Pak GD, Shin KI. Non-response imputation for panel data. Communications for Statistical Applications and Methods. 2010; 17(6):899–907. https://doi.org/10.5351/CKSS.2010.17.6.899.
23. Lee YH, Bang H, Kim DJ. How to establish clinical prediction models. Endocrinology and Metabolism. 2016; 31(1):38–44. https://doi.org/10.3803/EnM.2016.31.1.38.
24. Bragagnolo R, Perrone F, de Siqueira Paese MC, de Aguilar-Nascimento JE, Dock-Nascimento DB. Risk factors associated with pressure ulcers. Brazilian Journal of Clinical Nutrition. 2013; 28(4):311–315.
25. Walton‐Geer PS. Prevention of pressure ulcers in the surgical patient. AORN Journal. 2009; 89(3):538–552. https://doi.org/10.1016/j.aorn.2008.12.022.
26. Lindgren M, Unosson M, Fredrikson M, Ek AC. Immobility–a major risk factor for development of pressure ulcers among adult hospitalized patients: A prospective study. Scandinavian Journal of Caring Sciences. 2004; 18(1):57–64. https://doi.org/10.1046/j.0283-9318.2003.00250.x.
27. Gallagher P, Barry P, Hartigan I, McCluskey P, O'Connor K, O'Connor M. Prevalence of pressure ulcers in three university teaching hospitals in Ireland. Journal of Tissue Viability. 2008; 17(4):103–109. https://doi.org/10.1016/j.jtv.2007.12.001.
28. Cooper KL. Evidence-based prevention of pressure ulcers in the intensive care unit. Critical Care Nurse. 2013; 33(6):57–66. https://doi.org/10.4037/ccn2013985.
29. Reed RL, Hepburn K, Adelson R, Center B, McKnight P. Low serum albumin levels, confusion, and fecal incontinence: Are these risk factors for pressure ulcers in mobility-impaired hospitalized adults? Gerontology. 2003; 49(4):255–259. https://doi.org/10.1159/000070407.
30. Ahtiala MH, Soppi E, Kivimäki R. Critical evaluation of the Jackson/Cubbin pressure ulcer risk scale - a secondary analysis of a retrospective cohort study population of intensive care patients. Ostomy Wound Management. 2016; 62(2):24–33.
31. Fisher AR, Wells G, Harrison MB. Factors associated with pressure ulcers in adults in acute care hospitals. Advances in Skin & Wound Care. 2004; 17(2):80–90.
32. Pender LR, Frazier SK. The relationship between dermal pressure ulcers, oxygenation and perfusion in mechanically ventilated patients. Intensive and Critical Care Nursing. 2005; 21(1):29–38. https://doi.org/10.1016/j.iccn.2004.07.005.
33. Bursac Z, Gauss CH, Williams DK, Hosmer DW. Purposeful selection of variables in logistic regression. Source Code for Biology and Medicine. 2008; 3:17. https://doi.org/10.1186/1751-0473-3-17.
34. Berry MJA, Linoff GS. Data mining techniques: For marketing, sales, and customer relationship management. 2nd ed. Indianapolis (IN): Wiley;2004. p. 1–643.
Go to :
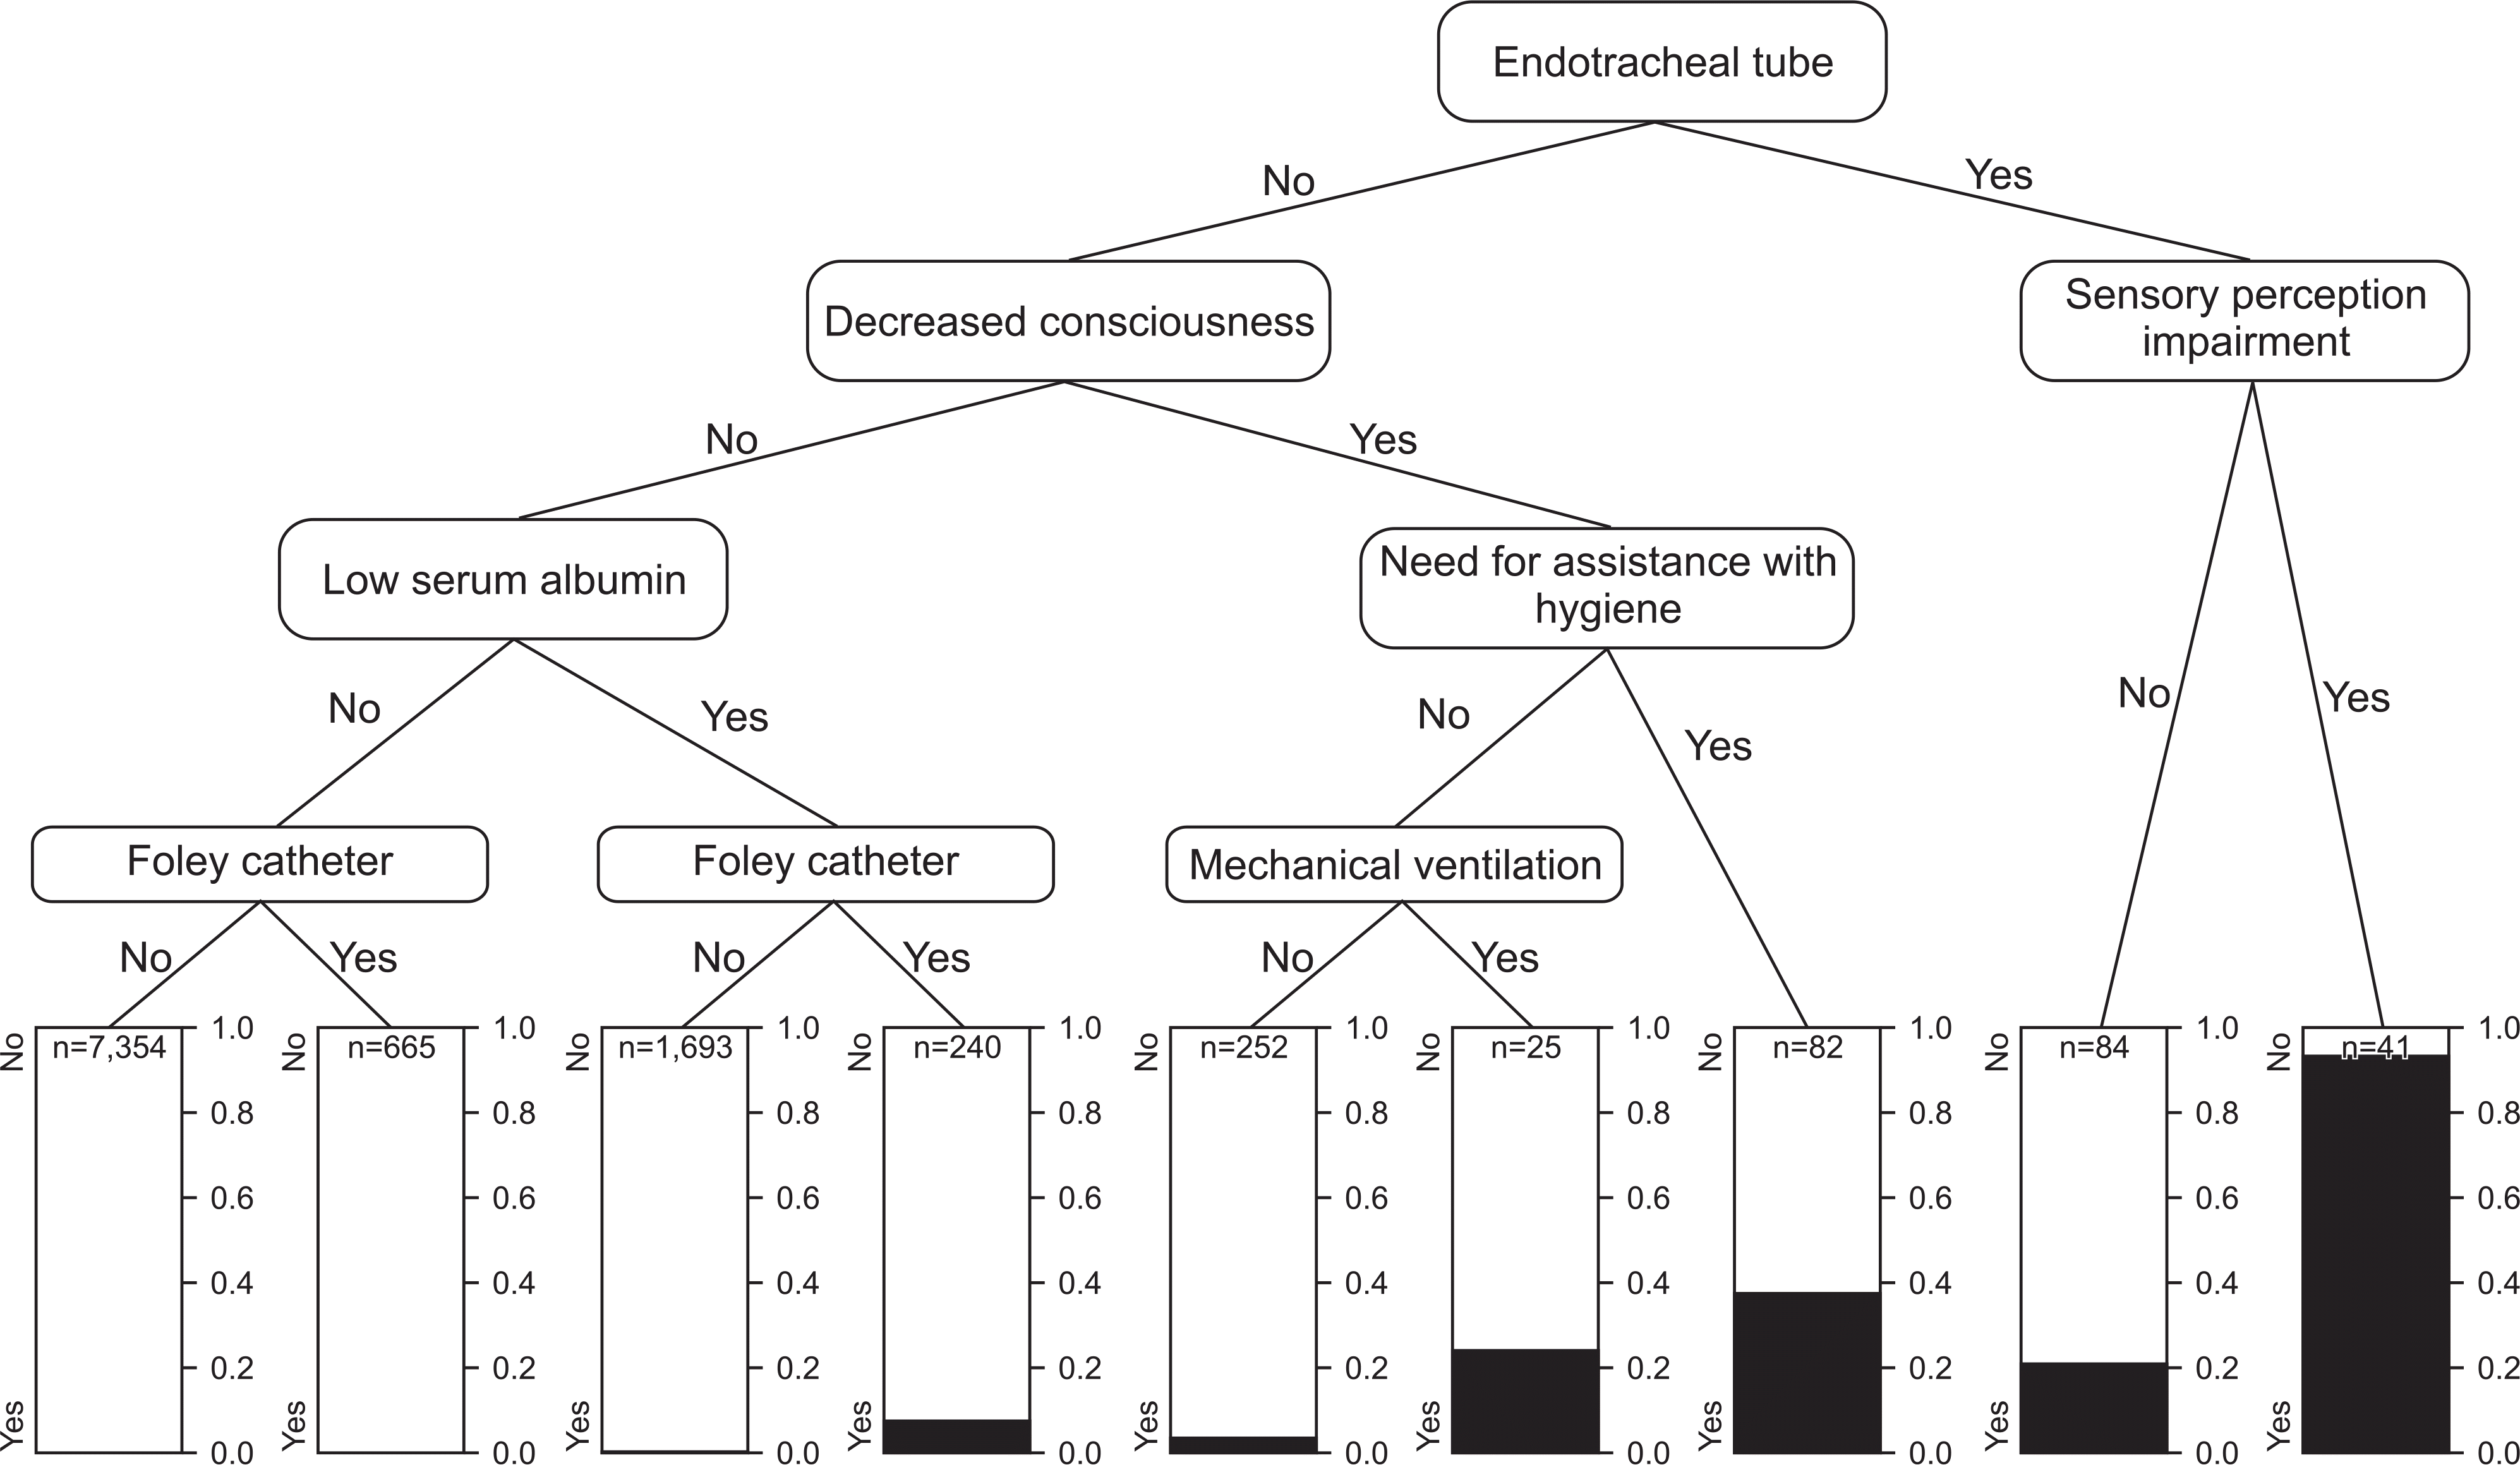
Table 1.
General Characteristics and Braden Scale Scores of Study Subjects and Characteristics of Pressure Ulcers (N=14,907)
| Characteristic | PU (n=202) | No PU (n=14,705) | t or χ2 (p) |
|---|---|---|---|
| n (%) or M±SD | n (%) or M±SD | ||
| Age (yr) | 17.03 (.001) | ||
| 18~49 | 42 (20.8) | 3,913 (26.6) | |
| 50~59 | 48 (23.8) | 3,536 (24.1) | |
| 60~69 | 37 (18.3) | 3,573 (24.3) | |
| ≥70 | 75 (37.1) | 3,683 (25.0) | |
| 61.71±15.81 | 58.04±15.18 | ||
| Sex | 2.30 (.129) | ||
| Male | 119 (58.9) | 7,875 (53.6) | |
| Female | 83 (41.1) | 6,830 (46.4) | |
| LOS in hospital (days) | 37.08±31.99 | 8.29±10.71 | 12.79 (<.001) |
| Route of admission | 26.28 (<.001) | ||
| Emergency room | 97 (48.0) | 4,583(31.2) | |
| Outpatient clinic | 105 (52.0) | 10,122 (68.8) | |
| Braden scale scores | 16.31±3.82 | 20.70±2.18 | -16.30 (<.001) |
| Sensory perception | 3.31±0.81 | 3.88±0.40 | -10.13 (<.001) |
| Moisture | 3.29±0.70 | 3.85±0.39 | -11.26 (<.001) |
| Activity | 2.17±1.23 | 3.54±0.77 | -15.84 (<.001) |
| Mobility | 2.78±0.87 | 3.64±0.57 | -14.05 (<.001) |
| Nutrition | 2.53±0.64 | 2.90±0.54 | -8.19 (<.001) |
| Friction and shear | 2.23±0.66 | 2.89±0.33 | -13.99 (<.001) |
| Time to pressure ulcer occurrence (days) | |||
| 0~3 | 70 (34.7) | ||
| 4~15 | 70 (34.7) | ||
| ≥16 | 62 (30.6) | ||
| 15.21±18.64 | |||
| Place where pressure ulcer developed | |||
| Operating room | 73 (36.1) | ||
| Ward or ICU | 129 (63.9) | ||
| Body site of pressure ulcer† | |||
| Back of head | 5 (2.1) | ||
| Cheek | 11 (4.6) | ||
| Chest | 28 (11.6) | ||
| Vertebra | 16 (6.6) | ||
| Coccyx | 91 (37.7) | ||
| Hip | 38 (15.8) | ||
| Thigh | 15 (6.2) | ||
| Lower leg | 12 (5.0) | ||
| Ankle | 14 (5.8) | ||
| Heel | 11 (4.6) |
Table 2.
Logistic Regression Model: Factors Associated with Pressure Ulcers (N=14,907)
Table 3.
Cox Proportional Hazards Regression Model: Factors Associated with Pressure Ulcers (N=14,907)
Table 4.
Comparison of Predictive Validity Performance Indicators
 XML Download