

 PDF
PDF Citation
 Print
Print


Abbreviations
2-DG
2-deoxy-D-glucose
BMDM
bone marrow-derived macrophage
ChIP
chromatin immunoprecipitation
ECAR
extracellular acidification rate
GLUT1
glucose transporter 1
IRAK1
IL-1 receptor associated kinase 1
IRF5
IFN regulatory factor 5
M1
classically activated macrophages
M2
alternatively activated macrophages
M-MDSC
monocytic myeloid-derived suppressor cell
MDSC
myeloid-derived suppressor cell
OCR
oxygen consumption rate
OVA
ovalbumin
OXPHOS
oxidative phosphorylation
Peli1-mKO
Peli1fl/fl LysMCre
Pellino-1-mKO
myeloid-specific Pellino-1 knockout
PMN-MDSC
polymorphonuclear myeloid-derived suppressor cell
TAM
tumor associated macrophage
TME
tumor microenvironment
Tyk2
tyrosine kinase 2
Ub
ubiquitin
WT
wild-type
INTRODUCTION
Macrophages are categorized into distinct subsets, depending on the polarization status (123), such as classically activated macrophages (M1) and alternatively activated macrophages (M2). Moreover, M2-polarized macrophages are further divided into M2a, M2b, and M2c, depending on polarizing stimuli. Pro-inflammatory signals (LPS and IFN-γ) and Th2 cytokines (IL-4 and IL-13) polarize macrophages into M1 and M2a types, respectively. LPS with immune complex and IL-10, potent anti-inflammatory cytokine, polarize macrophages into M2b and M2c type, respectively. During M2c polarization, IL-10 binds to IL-10 receptor complex and induces phosphorylation of tyrosine kinases Jak1 and tyrosine kinase 2 (Tyk2) (4), which phosphorylates IL-10 receptor and lead to activation of STAT3. Consequently, STAT3 forms homodimer and translocates to nucleus where it binds to the STAT-binding sites of IL-10 responsive genes and drives expression of genes that repress various inflammation pathways (5). In addition to STAT3, STAT1 and STAT5 are also activated by IL-10 in some cell types including macrophages (67). However, little is known about the fuctions of STAT1 and STAT5 in IL-10-mediated M2c polarization. Moreover, the mechanism by which IL-10 induces M2c polarization of macrophages remains elusive.
The Pellino protein was reported as a protein that interacts with the kinase domain of Pelle, the orthologue of the IL-1R-associated kinase in the Toll signaling pathway in Drosophila melanogaster (8). Functionally, Pellino proteins have been reported to act as ubiquitin (Ub) E3 ligases (910). Several studies have shown that Pellino-1 exerts critical functions on various innate and adaptive immune cells (111213). Pellino-1 inhibits TCR signaling via K48-linked ubiquitination of c-Rel (11), thereby inducing autoimmunity in Pellino-1-deficient mice. In macrophages, Pellino-1 promotes TLR3- and 4-mediated signals by interacting with IL-1 receptor associated kinase 1 (IRAK1) and receptor-interacting protein 1 (1213). Moreover, Pellino-1 enhances M1 macrophage polarization via K63-linked ubiquitination of IFN regulatory factor 5 (IRF5), thereby regulating obesity-induced glucose intolerance (3131415). In contrast to M1 macrophage polarization, Pellino-1 did not affect M2a polarization of macrophages in vitro and in vivo (15). However, it has not been studied whether Pellino-1 regulates M2c polarization of macrophages in the anti-inflammatory stimulus in vitro and tumor microenvironment in vivo.
To address this issue, we generated Lysm-CrePellino-1fl/fl mice by crossing Lysm-Cre and Pellino-1fl/fl mice. Lysm-CrePellino-1fl/fl mice showed defects in M2c polarization of macrophages and more tumor progression compared with Pellino-1fl/fl mice. Therefore, our results demonstrate that Pellino-1 inhibits IL-10-induced M2c macrophage polarization via K63-linked ubiquitination of IRAK1 and activation of STAT1. Furthermore, Pellino-1 plays a critical role in tumor progression via M2c polarization in tumor-associated macrophages (TAMs).
MATERIALS AND METHODS
Mouse experiments
Peli1tm1a(EUCOMM)Wtsi mice were obtained from the International Knockout Mouse Consortium (Knockout Mouse Project Repository, University of California, Davis, CA, USA). Flp-recombinase transgenic mice and LysM-Cre mice were purchased from the Jackson Laboratory (Bar Harbor, ME, USA). To obtain myeloid-specific Peli1 knockout mice, Peli1tm1a(EUCOMM)Wtsi mice were crossed with Flp transgenic mice to generate Peli1-floxed mice, then sequentially crossed with LysM-Cre mice. These mice were bred and maintained under specific pathogen-free conditions at the Biomedical Research Institute (Seoul National University Hospital, Seoul, Korea). All experiments were approved by the Institutional Animal Care and Use Committee in Seoul National University Hospital (SNUH-IACUC, approval number; 16-0231) and were conducted in accordance with relevant guidelines and regulations. Eight to 12 wk-old mice were used for all experiments. Sex- and age- matched littermate Peli1fl/+ LysMCre or Peli1fl/fl mice were used as control wild type with Peli1fl/fl LysMCre mice (Peli1-mKO). For subcutaneous tumor model, B16F10 cells (3.0×10⁵) or EL-4 cells (2.0×10⁵) were subcutaneously injected into the flank and tumor sizes were measured with a digital caliper 3 times a week. Tumor volumes were calculated as: Length×Width×{(Length+Width)/2}. For macrophage depletion in tumor model, 0.5 mg of anti-mouse CSF1 Ab (BioXcell, 5A1) was injected intraperitoneally 1 day before tumor injection. Ab was further injected weekly in same dose during tumor model experiments, and isotype Ab (BioXcell, HRPN) was used as control.
Reagent
Recombinant murine M-CSF, IFN-γ, IL-4, IL-13, and IL-10 were purchased from Peprotech and used for differentiation and polarization of macrophages. LPS (O111:B4), ovalbumin (A5503), anti-ovalbumin Ab (C6534), glucose (G8270), 2-deoxy-D-glucose (2-DG; D6134), carbonyl cyanide 4-(trifluoromethoxy) phenylhydrazone (FCCP; C2920), antimycin A (A8674), dispase II (D4693), and IRAK inhibitor (I5409) were purchased from Sigma (St. Louis, MO, USA). Collagenase I (4196) was obtained from Worthington (Columbus, OH, USA), and 2-NBDG (N13195) was purchased from Invitrogen (Carlsbad, CA, USA). Abs used for flow cytometry were as follows; CD45 (30-F11), CD4 (RM4-5), CD8a (53-6.7), CD11b (M1/70), CD11c (N418), CD206 (CD68C2), F4/80 (BM8), Ly6G (1A8), Ly6C (HK1.4), MHCII (M5/114.15.2), and NK1.1 (PK136) from BioLegend (San Diego, CA, USA); Foxp3 (NRRF-30), TCRβ (H57-597), IFN-γ (XMG1.2), IL-10 (JES5-16E3) from eBioscience (San Diego, CA, USA); glucose transporter 1 (GLUT1; EPR3915) from Abcam (Cambridge, UK). Abs used for immunoblotting were as follows; STAT1 (9172), p-STAT1 (Tyr701, 9167), p-STAT1 (Ser727, 8826), STAT3 (9139), p-STAT3 (Tyr705, 9145), and p-STAT3 (Ser727, 9134) were purchased from Cell Signaling Technology (Danvers, MA, USA). Peli1 (F-7), IRAK1 (F-4) and Ub (P4D1) were purchased from Santa Cruz Biotechnology (Dallas, TX, USA). K63-specific Ub (HWA4C4, eBioscience) was also used for immunoblot assay.
Preparation and polarization of macrophages
For preparation of murine bone marrow-derived macrophage (BMDM), mice were sacrificed and the femurs and tibias were flushed with sterile 1× PBS and red blood cells (RBC) were lysed with an RBC lysis solution (Qiagen, Hilden, Germany). The collected bone marrow cells were cultured on sterile, non-coated Petri dishes in DMEM supplemented with 10% FBS, penicillin-streptomycin (Gibco™, Fisher Scientific, Hampton, NH, USA), and 20 ng/ml of mouse recombinant M-CSF. The 3 ml of growth media with M-CSF were added every 2–3 days. After 7 days of incubation, the adherent BMDMs were detached by incubation with accutase (Merck, Kenilworth, NJ, USA) at 37°C for 10 min and re-plated in plates overnight for further analysis. For preparation of peritoneal macrophages, peritoneal exudates were harvested 3 days after intraperitoneal injection of mice with 3% thioglycollate mediun. The collected peritoneal cells were incubated with DMEM supplemented with 10% FBS and antibiotics overnight, and adherent cells were used for further analysis. For polarization of macrophages, following materials were used for treatment: LPS (100 ng/ml) and IFN-γ (20 ng/ml) for M1, IL-4 (20 ng/ml), and IL-13 (20 ng/ml) for M2a, LPS (10 ng/ml) and Immune complex (100 µg/ml of anti- OVA Ab and 10 µg/ml of OVA) for M2b, and IL-10 (20 ng/ml) for M2c. Immune complex was prepared freshly before treatment as described previously(16). Briefly, OVA and anti-OVA Ab were mixed in PBS and incubated at 37°C for 30 min and treated at indicated concentrations.
Extracellular acidification rate (ECAR) and oxygen consumption rate (OCR) assays
Approximately 1.5×10⁵ BMDMs were plated in XF24 cell culture microplates (Seahorse Bioscience, North Billerica, MA, USA) and treated with IL-10 for 6 h to analyze ECAR and OCR. After IL-10 stimulation, the media were changed to XF assay media, according to the manufacturer's instructions. For ECAR measurement, glucose (10 mM), oligomycin (1 µM) and 2-DG (50 mM) were sequentially treated. For OCR measurement, oligomycin (1 µM), FCCP (1 µM), and antimycin A (1 µM) were used. ECAR and OCR were assessed using an XF24 analyzer (Seahorse Bioscience). Glucose uptake was assessed using 2-NBDG as following method. Before 2-NBDG treatment, BMDMs were pre-incubated with media containing no glucose and serum at 37°C for 30 min. After that, 2-NBDG (100 µM) was treated for 20 min and BMDMs were detached as described above for flow cytometry.
Immunoprecipitation and immunoblotting
For immunoprecipitations, BMDMs were lysed with lysis buffer containing 20 mM Tris-Cl (pH 7.9), NaCl (120 mM), Glycerol (10%), Triton X-100 (0.5%), EDTA (2 mM), and DTT (2 mM) with protease and phosphatase inhibitor cocktails, incubated with an anti-IRAK1 Ab overnight, and subsequently incubated with Protein A/G agarose beads (Santa Cruz Biotechnology) for 6 h at 4°C. The immunoprecipitates were eluted from the beads by boiling for 10 min in 2× Laemmli Sample buffer after washing the beads with lysis buffer 3 times and lysis buffer without detergent 2 times. The eluted samples were loaded on 8% SDS-PAGE gels and transferred onto a polyvinylidene fluoride membrane (Millipore, Billerica, MA, USA) for Western Blotting. In some data, ImageJ program was used for quantitative analysis of western blot data.
Chromatin immunoprecipitation (ChIP)
The Pierce Agarose ChIP Kit (Thermo Fisher Scientific, Waltham, MA, USA) was used according to the manufacturer's protocols. Briefly, BMDMs were stimulated with IL-10 for 6 h and fixed with 1% formaldehyde. Nuclear fractions were used for immunoprecipitation with the STAT1 and STAT3 Abs at recommended dilution ratio, and the precipitated DNAs were quantified by quantitative PCR using primers to detect the Il10, Socs3, or Bcl3 promoter regions specific for STAT family proteins. The primers used for experiments were as follows; Il10-promoter CGA CCA GTT CTT TAG CGC TTA (Forward), TGT TCT TGG TCC CCC TTT TA (Reverse); Socs3-promoter AGG CAG TAG CAT TTA GAA GGG AGA C (Forward), CAC ATA GGA GAG ACA AAG CAG AAC C (Reverse); Bcl3-promoter TCG GGT GGA TGA GGA TGG AGA C (Forward), AGT ATT CGG TAG ACA GCG GCT ATG (Reverse). The data were normalized to the IgG control at time zero.
Quantitative RT-PCR
Total RNA, which was isolated from cells using TRIzol (Life Technologies, Carlsbad, CA, USA), was reverse transcribed to cDNA using M-MLV reverse transcriptase (Promega, Madison, WI, USA) according to the manufacturer's protocol. Quantitative RT-PCR reactions were performed using SensiFAST™ SYBR Master Mix (Bioline, London, UK). Gene-specific PCR products were measured using an Applied Biosystems 7500 Sequence Detection System (Perkin-Elmer Biosystems, Foster City, CA, USA). The relative quantification of gene expressions was assessed using 2−ΔΔCT method.
Flow cytometry
The mononuclear cells isolated from tumor tissues were prepared as previously described (15). Briefly, tumor tissues were chopped and incubated in buffer containing collagenase type I (1 g/L), dispase II (1 g/L) and DNase I (20 mg/L) for 30 min at 37°C with shaking. After incubation, the digested tissues were filtered through a 100-µm nylon mesh and centrifuged. The pelleted cells were used for further experiments after RBC lysis. For cultured BMDMs, cells were washed with 1× PBS twice and incubated for 10 min at 37°C with accutase (Biowest, Nuaillé, France), then harvested suspended cells were washed once with 1× PBS and used for flow cytometry. Single-cell suspensions were pre-incubated with mouse anti-Fc receptor Abs (BD Biosciences, San Jose, CA, USA) for 15 min at 4°C, followed by surface protein staining or intracellular cytokine staining. Samples were analyzed with an LSRFortessa cell analyzer (BD Biosciences).
Statistical analysis
The data were presented as the means±SEMs. Student's t-tests (2 groups) and one-way ANOVA (more than 2 groups) with Tukey's post hoc test were performed to compare the groups. All data were statistically analyzed using GraphPad Prism 5 software. The p values <0.05 were considered significant.
RESULTS
Pellino-1 negatively regulates IL-10-induced M2c polarization of macrophages
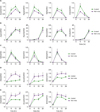
To investigate whether Pellino-1 regulates various types of M2 polarization of macrophages, thioglycollate-elicited peritoneal macrophages and murine BMDMs were treated with M1 (LPS+IFN-γ), M2a (IL-4+IL-13), M2b (LPS+immune complex) or M2c (IL-10) stimulus. Consitent with previous study, upon LPS and IFN-γ treatment, the expression levels of M1 marker genes were lower in peritoneal macrohpages from myeloid-specific Pellino-1 knockout (Lysm-CrePellino-1fl/fl, hereafter named Pellino-1-mKO) mice than those from control mice (Fig. 1A). Among M2 stimuli, IL-10 highly increased the expression levels of M2c-polarization markers such as Il10, Socs3, and Bcl3 in Pellino-1-deficient macrophages. However, M2a and M2b stimuli minimally altered the expression levels of M2 markers in peritoneal macrophages from Pellino-1-mKO (Fig. 1B-D). Upregulation of M2c genes were also consistently observed in BMDMs from Pellino-1-mKO mice (Fig. 1E). Taken together, these findings indicate that Pellino-1 negatively regulates IL-10-indcued M2c polarization in macrophages
Figure 1
Pellino-1 regulates M1 and M2c, but not M2a and M2b macrophage polarization. Peritoneal macrophages from control or Peli1-mKO mice were polarized to M1 via treatment of LPS and IFN-γ (A), M2a via IL-4 and IL-13 treatment (B) and M2b via LPS and immune complexes (C) for indicated time. Expressions of each polarization markers were measured by quantitative RT-PCR. (D) Peritoneal macrophages from control or Peli1-mKO mice were treated with IL-10 for indicated time, and expressions of M2c-polarized macrophage-specific markers including Il10, Socs3, and Bcl3 were measured. (E) BMDMs from control or Peli1-mKO mice were prepared and treated with IL-10 for indicated time. IL-10-mediated gene expression of Il10, Socs3, and Bcl3 was evaluated by quantitative RT-PCR. All data were representative of 3 independent experiments and presented as means±SEMs (n=4).
*p<0.05, **p<0.01, ***p<0.001.
Pellino-1-deficient macrophages exhibit a defect in mitochondria respiration, but enhancement of glycolysis during M2c polarization
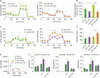
Recently, it has been well established that metabolic reprograming in macrophages is closely linked with macrpophage polarization (17). Moreover, M1 macrophages utilize glycolysis for their energy source, whereas M2a macrophages use oxydative phosphorylation (18). To explore metabolic reprograming of Pellino-1-mediated M2c macrophages, we measured OCR and ECAR in Pellino-1-deficient and WT BMDMs upon IL-10 stimulation. IL-10 increased OCR in WT BMDMs, but not Pellino-1-deficient BMDMs (Fig. 2A and B, Supplementary Fig. 1A and B). In contrast, Pellino-1-deficient BMDMs exhibited higher ECAR than WT BMDMs upon M2c polarization (Fig. 2C-E and Supplementary Fig. 1C). Furthermore, inhibition of glycolysis pathway using 2-DG reduced expression levels of M2c markers in Pellino-1-deficient BMDMs (Fig. 2F), suggesting that increased M2c marker expressions might be dependent on glycolysis. However, glucose uptake and the expression levels of GLUT1 were similar between WT and Pellino-1-deficient BMDMs, indicating that the difference in ECAR values between 2 types of macrophages is not due to different expression levels of GLUT1 and glucose uptake (Supplementary Fig. 1D and 1E). These data suggest that Pellino-1-deficient M2c macrophages show different metabolic reprograming from that of WT M2c macrophages.
Figure 2
Pellino-1-deficient macrophages show increase of glycolysis during M2c polarization. Control or Peli1-mKO BMDMs (1.5×10⁵ cells/well) were treated with IL-10 for 6 h for M2c macrophage polarization. (A) OCR in control BMDMs (left panel) and WT versus Peli1-mKO BMDMs (right panel) in the presence or absence of IL-10. Dashed lines indicate treatment of oligomycin (left), carbonyl cyanide 4-(trifluoromethoxy) phenylhydrazone (FCCP, middle), and antimycin A (right). (B) Maximal respiratory capacity of BMDMs was measured by estimating AUC of OCR graphs and analyzed statistically. (C) ECAR in control BMDMs (left panel) and WT versus Peli1-mKO BMDMs (right panel) in the presence or absence of IL-10. Dashed lines indicate treatment of glucose (left), oligomycin (middle), and 2-DG (right). (D) Glycolysis of BMDMs was measured by estimating AUC of ECAR graphs and analyzed statistically. (E) ECAR (glycolysis) and OCR (maximal respiratory capacity) values were plotted. Arrows indicate metabolic changes from unstimulated BMDMs to M2c-polarized BMDMs. (F) To induce M2c polarization, BMDMs were treated with IL-10 for 6 h after pretreatment of 2-DG (1 mM) for 1 h. The expression of M2c polarization markers was measured. All data were representative of 2 independent experiments (A-E) and 3 independent experiments (F) and presented as means±SEMs (n=6 in A-E and n=4 in F).
AUC, area under curve.
*p<0.05, **p<0.01, ***p<0.001.
Upon IL-10 stimulation, Pellino-1 promotes STAT1 phosphorylation via K63-linked ubiquitination of IRAK1 in macrophages
Mechanistically, IL-10 regulates expression of IL-10-responsive genes via phosphorylation and activation of STAT3, thereby establishing IL-10-STAT3 axis (1920). Moreover, STAT1 and STAT3 counteract each other in myeloid cells, suggesting that the balance between STAT1 and STAT3 activation status might determine pro-inflammatory or anti-inflammatory responses by macropahges (212223). Thus, we explored whether Pellino-1-mediated IL-10 response in macrophages is functionally linked wtih STAT1 and STAT3 activation status. Upon IL-10 treatment, tyrosine phosphorylation of STAT1 was significantly attenuated in Pellino-1-deficient BMDMs compared with WT BMDMs, whereas serine and tyrosine phosphorylation of STAT3 were minimally altered (Fig. 3A and B). ChIP assay revealed that the expression levels of promotor regions of IL-10-response genes that bind to STAT1 were lower in Pellino-1-deficient BMDMs than WT BMDMs (Fig. 3C). These findings suggest that Pellino-1-mediated reduction in IL-10-responsive gene expression might be associated with phosphorylation status of STAT1 during IL-10-mediated M2c macrophage polarization.
Figure 3
Pellino-1 regulates phosphorylation of STAT1 by K63-linked ubiquitination of IRAK1, during M2c macrophage polarization. (A) Control or Peli1-mKO BMDMs were treated with IL-10 for indicated time periods. Phosphorylation of STAT1 and STAT3 were measured by blotting. (B) Quantitative analysis of tyrosine phosphorylation of STAT1. (C) Chromatin immunoprecipitation assay was performed using control or Peli1-mKO BMDMs treated with IL-10 for 6 h. The promoter regions of M2c polarization markers including Il10, Socs3, and Bcl3 were estimated in immunoprecipitated STAT1. (D) Lysates from control or Peli1-mKO BMDMs treated with IL-10 for 10 min were immunoprecipitated using anti-IRAK1 Ab, and then blotted with Ab specific for Ub, K63-specific Ub, PELI1 and IRAK1. (E) Control or Peli1-mKO BMDMs were pre-treated with IRAK inhibitor for 1 h and followed by IL-10 treatment for 30 min. Blotting was performed to detect phosphorylation of STAT1 and STAT3. (F) Control or Peli1-mKO BMDMs were pre-treated with IRAK inhibitor for 1 h, followed by IL-10 treatment for 6 h. The expression of M2c markers was measured by quantitative RT-PCR. All data were representative of 3 independent experiments and presented as means±SEMs (n=3 in B and C, n=4 in F).
*p<0.05, **p<0.1.
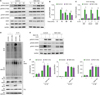
IRAK1, which plays an essential role in phosphorylation of STAT1 upon several stimulations, can be ubiquitinated on K63 by Pellino-1 (12242526) and by IL-10 stimulation in dendritic cells (27). Based on these findings, we hypothesized that Pellino-1 might regulate STAT1 phosphorylation via K63-linked ubiquitination of IRAK1. To address this, we estimated ubiquitination status of IRAK1 in Pellino-1-deficient and WT BMDMs. Upon IL-10 stimulation, the levels of total Ub and K63-linked Ub in IRAK1 were significantly reduced in Pellino-1-deficient BMDMs compared with WT BMDMs. Consitently, Pellino-1 directly bound to IRAK1 in WT BMDMs, but not Pellino-1-deficient BMDMs (Fig. 3D). Moreover, IRAK inhibitor decreased tyrosine phosphorylation of STAT1, but increased expression levels of M2c markers in WT BMDMs, whereas it minimally affected those in Pellino-1-deficient BMDMs (Fig. 3E and F). These findings indicate that Pellino-1-mediated inhibition of M2c polarization is dependent on IRAK1 and STAT1 phosphorylation. Taken together, these data suggest that Pellino-1 regulates IL-10-induced M2c differentiation of macrophages via IRAK1-STAT1 axis.
Pellino-1-mKO mice increase tumor grwoth via regulating M2c polarization in tumor microenvironment compared with WT mice
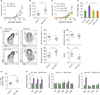
Tumor-associated macrophages (TAMs) regulate tumor progression by regulating tumor microenvironment (TME). Thus, to investigate whether Pellino-1 in TAM affects tumor growth, we injected mouse melanoma (B16F10) cells subcutaneously into WT and Pellino-1-mKO mice. Tumor sizes and weights were higher in Pellino-1-mKO mice than in WT mice (Fig. 4A and B), which was abolished by depleting macrophages via anti-CSF1 Ab injection (Fig. 4C and D). In immune subset analysis in TME, the percentages of macrophages, T cells, NK cells, myeloid-derived suppressor cell (MDSC), and eosinophils were similar between Pellino-1-mKO and WT mice (Supplementary Fig. 2, 3A and B). Pellino-1-mKO mice exhibited higher percentages of M2 macrophages, but similar percentages of M1 macrophages in TME compared with WT mice, resulting in low M1/M2 ratio in Pellino-1-mKO mice (Fig. 4E and F). IL-10 production in TAM was elevated in Pellino1-mKO mice, but not in other IL-10 producing immune cells, including Treg or MDSC (Fig 4G and Supplementary Fig. 3C). In gene expression analysis, the levels of M2c markers were higher in TAMs from Pellino1-mKO mice than WT mice, whereas expression levels of M1 or M2a markers were simiar in 2 groups of mice (Fig. 4H). Moreover, Pellino-1-mKO mice showed reduction in the percentages of IFN-γ+ CD4+ and CD8+ T cells in TME compared with WT mice (Supplementary Fig. 3D). Furthermore, tumor model with diffrent tumor cell lines (T cell-lineage tumor EL4) also confirmed increased tumor size, weight (Supplementary Fig. 3E and F) and higher pencentage of M2 macrophages in Pellino-1-mKO mice compared with WT mice (Supplementary Fig. 3G). Combined, these data indicate that Pellino-1-deficient TAMs contribute to tumor growth via regulating M2c polarization.
Figure 4
Peli1-mKO mice show enhancement of tumor growth. (A-B) Control or Peli1-mKO mice were subcutaneously injected with B16F10 cells and tumor growth was measured every 2–3 days (A). Sixteen days after tumor inoculation, tumor was excised and weighed (B). Control of Peli1-mKO mice were injected with either isotype control IgG or anti-CSF1 Ab. One day after Ab injection, B16F10 melanoma cells were injected subcutaneously, and tumor size (C) and tumor weight were measured (D). (E-H) Tumor-associated macrophages (TAM, CD45+ CD11b+ F4/80+), M1 TAM (CD45+ CD11b+ F4/80+ MHC-IIhigh CD206low), M2 TAM (CD45+ CD11b+ F4/80+ MHC-IIlow CD206high) populations in tumors from control or Peli1-mKO mice were analyzed by flow cytometry (E) and statistically analyzed (F). (G) IL-10-producing TAMs were analyzed by intracellular staining of IL-10. (H) M1 markers (middle), and M2a markers (right) were measured in sorted TAM by quantitative RT-PCR. All data were representative of 3 independent experiments and presented as means±SEMs (n=8).
*p<0.05, **p<0.01.
DISCUSSION
It has been reported that M2c polarization of macrophages is promoted by glucocorticoids, TGF-β, or IL-10, and negatively regulates the production of proinflammatory cytokines in the microenvironment (28). Among them, IL-10 is a potent inducer for M2c macrophage polarization. In our experiments, Pellino-1 inhibited IL-10-mediated M2c macrophage polarization, but did not affect M2a and M2b polarization in vitro. These findings suggest that Pellino-1 negatively regulates IL-10-induced M2c macrophage polarization. Upon engagement of IL-10RA by IL-10, IL-10RB is recruited and forms tetrameric receptor with 2 α and β chains, in turn, leads to the association of Jak1 and Tyk2 with 2 chains, and followed by IL-10RA phosphorylation. The phosphorylated IL-10RA provides docking site for STAT3 (29), indicating that STAT3 plays a critical role in regulation of IL-10R-mediated signal pathway. However, our experiments demonstrated that phosphorylation of STAT3 was not affected in Pellino-1-deficient BMDMs, whereas that of STAT1 was reduced. These findings suggest that Pellino-1-mediated regulation of IL-10R signal might be attributable to STAT1 rather than STAT3. Zheng et al. reported that gain-of-function of STAT1 mutation impaired STAT3 activity in patients with chronic mucocutaneous candiasis, indicating that acitvation of STAT1 inhibits STAT3 activity (29). Based on these findings, it is likely that Pellino-1-mediated K63 ubiquitination of IRAK1 indirectly regulates STAT3 activity via increasing STAT1 activity, thereby inhibiting IL-10R-mediated signal during M2c polarization of macrohages. Although the mechanism by which K63 ubiquitination of IRAK affects phosphorylation in tyrosine residue of STAT1 remains unclear, it is reasonable to consider that IRAK1 regulates STAT1 phosphorylation indirectly rather than directly since IRAK1 acts as Ser/Thr kinase rather than tyrosine kinase. Thus, it has been hypothesized that K63 ubiquitination-mediated activation of IRAK1 might increase tyrosine phosphorylation of STAT1 indirectly via activating tyrosine kinase including PI3K, which has been known to be dependent on IRAK1 (30). Furthermore, PI3K has been reported to exert anti-inflammatory effect upon IL-10 stimulation (31). It is feasible that Pellino-2 also exerts some functional activity during IL-10-mediated M2c polarization via regulating IRAK since Pellino-2 has been known to regulate IRAK1 (32), which need to be investigated further.
M1 and M2a macrophages use differential metabolisms of glycolysis versus oxidative phosphorylation (OXPHOS) (1733). However, IL-10-mediated metabolic reprograming in the absence of LPS stimulation is unclear in macrophages. Our experiments clearly demonstrated that M2c macrophages exhibited enhancement of OXPHOS, but not ECAR, indicating that M2c polarization induces OXPHOS-mediated metabolic reprograming in macrophages. Furthermore, Pellino-1-deficient M2c macrophages increased ECAR compared with WT M2c macrophages, whereas there was no difference in OCR between 2 group of macrophages. These findings indicate that Pellino-1-deficient macrophages induce metabolic reprograming via regualting glycolysis rather than OXPHOS during IL-10-mediated M2c macrophage polarization. Consistently, recent studies have demonstrated that glycolysis may also be critical for M2a polarization (34), although M2a macrophages are characterized by enhancement of OXPHOS and fatty acid oxidation (35). Moreover, M2a macrophages utilize glycolysis as a backup mechanism when oxidative phosphorylation is defected (36). These findings indicate that Pellino-1-deficient macrophages induce metabolic reprograming via regulating glycolysis rather than OXPHOS during IL-10-mediated M2c macrophage polarization. However, the mechanism by which Pellino-1 regulates metabolic reprograming in macrophages during M2c polarization remains elusive.
Pellino-1 has been reported to play a critical role in the regulation of central nervous system inflammation and obesity-induced glucose intolerance by regulating functions of microglia and macrophage polarization in adipose tissue, respectively (1537). Our experiments demonstrated that Pellino-1 of macrophages inhibited tumor growth by regulating TME. Moreover, Pellino-1-mKO mice showed enhancement in percentages of M2 and IL-10+ TAM, but similar percentages of M1 macrophages in TME compared with WT mice. In previous report, we demonstrated that decreased M1 polarization was detected in Pellino-1-deficient macrophages in vitro and in adipose tissue macrophages of obese mice in vivo. However, M1 macrophage polarization in TME of Pellino-1-mKO mice was similar to that of WT mcie, which might be attributable to different microenvironment of tumor and adipose tissue, which differentially affects macrophage polarization. It has been generally established that TAM drives M2 rather than M1 macrophage polarization, whereas obese adipose tissues induce M1 macrophage polarization (38). Combined, these findings indicate that Pellino-1 in macrophages inhibits tumor growth by attenuating M2c polarization in TME. Meanwhile, Pellino-1 deficiency might affect function of MDSCs in LysM-Cre system. Although the function of MDSC in Pellino-1-mKO has not been investigated in vitro experiments, no difference in population and IL-10 secretion of MDSCs from WT and Pellino-1-mKO in tumor model (Supplementary Fig. 3). Based on these results, it is less likely that MDSCs play critical role in regulation of tumor growth in Pellino-1-mKO.
In conclusion, our results demonstrate that Pellino-1 inhibits IL-10-induced M2c macrophage polarization via K63-linked ubiquitination of IRAK1 and activation of STAT1, thereby inhibiting tumor growth in vivo.
 XML Download