

 PDF
PDF ePub
ePub Citation
 Print
Print


INTRODUCTION
Atrophy is a word suggesting degeneration and decline of function, regardless if it is used for an anatomical structure or as a metaphor of the speech. It also affects the brain, disrupting its structural balance and performance. Plenty of diseases, external factors and genetic predispositions are suggested as cause of the condition.
Meanwhile, brain herniation is a fatal result after an acute increase of the intracranial pressure (ICP), more often due to traumatic brain injury (TBI) or acute brain bleed. In normal condition a person has 75 mL entrant cerebrospinal fluid (CSF) at every 5 seconds and 100–130 mL entrant blood flow. The 14% of the cardiac output reaches the brain. In normal conditions (no bleed, tumor or other cause of increased brain volume [BV]) a person has ICP at about 5–10 mmHg. Every cause of increased brain pressure according to the Monro-Kellie doctrine leads to compensatory mechanisms, where the entrant fluids are reduced in order to maintain normal ICP. When the extra BV extends the 100–120 mL, the compensatory mechanisms do not work, leading to increased ICP and brain herniation.
At first sight, the aforementioned processes seem unrelated. Reviewing them, however, one understands that BV, pericerebral space (PICS) and intracranial volume (ICV) are related to brain herniation, because of their close relation and interaction. Hence, this raises a question. If these parameters are related, are they equal? And if this relation between them exists, how does this affect us? The aim of the current study is to try to answer this question.
Go to : 
MATERIALS AND METHODS
In order to describe the relation between atrophy and herniation, 2 independent authors collected studies reporting brain atrophy caused by alcoholic and schizophrenic factors, all of which were found on Medline, Embase, Cochraine, Willey, Google Scholar and from the references of the articles found, between 1996 and 2018. The main reason those specific entities were chosen was that atrophy in schizophrenia is considered to be regional, allowing the examination of more than one type of atrophy, and that alcohol is the most common cause of atrophy due to substance abuse.
MeSH terms used for the search were: brain atrophy, alcohol, schizophrenia, BV, ICV and foramen magnum (FM).
Two independent authors collected the studies, while a third author analyzed the data.
Inclusion criteria were: i) human studies; ii) English language studies; iii) clinical studies; and iv) articles reporting BV and ICV or ICV and Grey and white matter, all of which are reported in mL or cm3 and demographics of the patients.
On the other hand, exclusion criteria were: i) non-human studies; ii) non-English studies; iii) case reports; iv) comments; v) letters to editor; vi) reviews; vii) meta-analyses; viii) studies reporting only partial data of the brain capacity or brain capacity in Liters; ix) articles with no demographic data; x) articles with mean age of the participants under 19 or over 60 years; and xi) other causes of brain atrophy, except of the aforementioned (FIGURE 1).
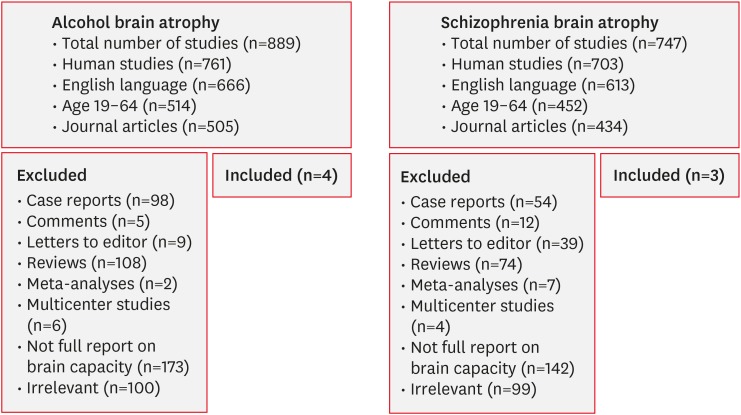
The attached studies were strictly selected based on the criteria and afterwards the data extracted from each study was divided into 3 categories—controls, alcoholic patients, and schizophrenic patients. Data collected from the studies included age, BV, ICV, FM's surface area (FMSA), and PICS.
In the case of only grey matter (GM) and white matter (WM) volume, the authors used the formula below to calculate the BV.
The PICS and FMSA were not reported, and we calculated them as it follows1):

Thereafter, the data was analyzed with Bayesian paired t-test and correlation analysis on Jeffreys's Amazing Statistics Program (JASP) statistical program. The Bayesian paired t-test is equal to the paired student t-test, estimating the mean of 2 groups.
Go to :
RESULTS
For the final results, the authors included 11 studies with a total number of 849 patients (TABLE 1 & FIGURE 1).245610222425313234) The studies were divided into 3 groups: controls, alcoholic and schizophrenic patients. The mean age of the controls, the patients with alcohol abuse, and the patients with schizophrenia were 38.61, 47.5, and 33.65, respectively.
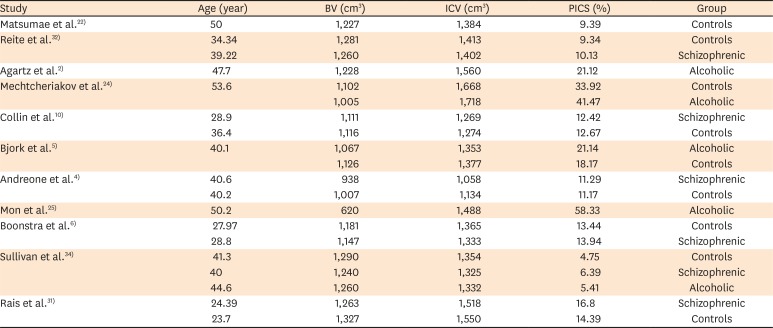
TABLE 1
List of included studies
| Study | Age (year) | BV (cm3) | ICV (cm3) | PICS (%) | Group |
|---|---|---|---|---|---|
| Matsumae et al.22) | 50 | 1,227 | 1,384 | 9.39 | Controls |
| Reite et al.32) | 34.34 | 1,281 | 1,413 | 9.34 | Controls |
| 39.22 | 1,260 | 1,402 | 10.13 | Schizophrenic | |
| Agartz et al.2) | 47.7 | 1,228 | 1,560 | 21.12 | Alcoholic |
| Mechtcheriakov et al.24) | 53.6 | 1,102 | 1,668 | 33.92 | Controls |
| 1,005 | 1,718 | 41.47 | Alcoholic | ||
| Collin et al.10) | 28.9 | 1,111 | 1,269 | 12.42 | Schizophrenic |
| 36.4 | 1,116 | 1,274 | 12.67 | Controls | |
| Bjork et al.5) | 40.1 | 1,067 | 1,353 | 21.14 | Alcoholic |
| 1,126 | 1,377 | 18.17 | Controls | ||
| Andreone et al.4) | 40.6 | 938 | 1,058 | 11.29 | Schizophrenic |
| 40.2 | 1,007 | 1,134 | 11.17 | Controls | |
| Mon et al.25) | 50.2 | 620 | 1,488 | 58.33 | Alcoholic |
| Boonstra et al.6) | 27.97 | 1,181 | 1,365 | 13.44 | Controls |
| 28.8 | 1,147 | 1,333 | 13.94 | Schizophrenic | |
| Sullivan et al.34) | 41.3 | 1,290 | 1,354 | 4.75 | Controls |
| 40 | 1,240 | 1,325 | 6.39 | Schizophrenic | |
| 44.6 | 1,260 | 1,332 | 5.41 | Alcoholic | |
| Rais et al.31) | 24.39 | 1,263 | 1,518 | 16.8 | Schizophrenic |
| 23.7 | 1,327 | 1,550 | 14.39 | Controls |
![]()
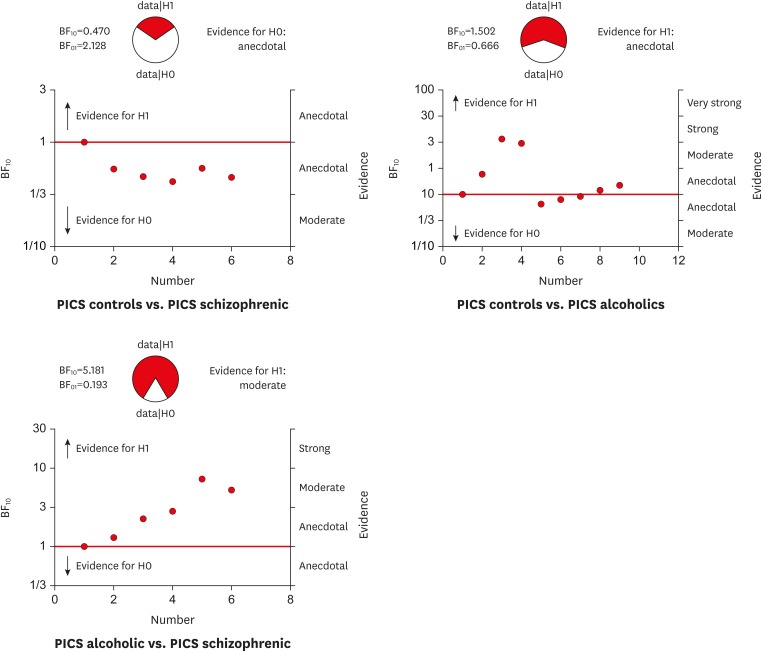
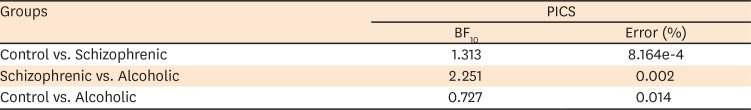
Afterwards, Bayesian paired t-test was performed with Bayes factor linking to the alternative hypothesis (BF10) (alternative hypothesis is A≠B).
The results reveal very interesting facts (TABLE 2). Pericerebral space appeared to be equal among controls and schizophrenic patients, unequal between controls and alcoholic patients and unequal between schizophrenic and alcoholic patients. The Bayesian plot, FIGURE 2, shows that the alternative hypothesis (H1) or the inequality between A and B is accepted in the cases of alcoholic atrophy, while the null hypothesis (H0) is accepted only between the normal subjects and schizophrenics. The outcome suggests that the pericerebral space in the case of schizophrenia-related atrophy (regional) is the same as the one in normal individuals, while PICS in alcohol-related atrophy (diffuse atrophy) is unequal.
After the correlation analysis FMSA and ICV were found to be correlated with strong, positive correlation in all of the groups. (TABLES 3, 4, 5). This means that by increasing the ICV the space between the bony tissue of the FM and the nerve tissue will thicken, since the FM' opening could not grow bigger.
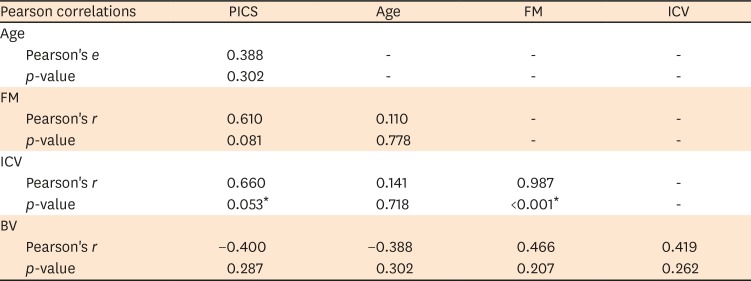
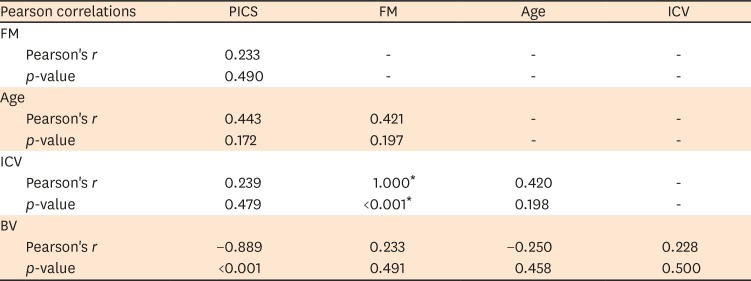
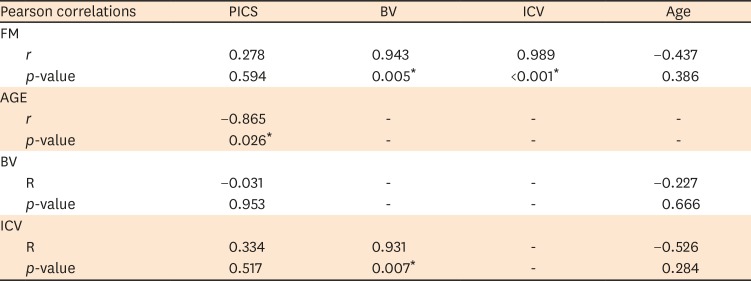
TABLE 3
Correlation matrix controls
PICS: pericerebral space, FM: foramen magnum, ICV: intracranial volume, BV: brain volume.
*Significant p-value.
![]()
TABLE 4
Correlation matrix of alcohol atrophy
PICS: pericerebral space, FM: foramen magnum, ICV: intracranial volume, BV: brain volume.
*Significant p-value.
![]()
TABLE 5
Correlation matrix of schizophrenic atrophy
PICS: pericerebral space, FM: foramen magnum, ICV: intracranial volume, BV: brain volume.
*Significant p-value.
![]()
No matter which group has smaller or greater volumes, the result is that there is inequality between the groups, in different analogues. Also, the FM, as an anatomical structure, has specific size, diameter and surface area.92728) In normal patient the ICV is occupied from brain tissue, blood and CSF, as the FM and has ICP between 5 and 10 mmHg.
In case of epidural/ subdural hematoma, brain trauma or other cause of increased intracranial brain pressure, according to the Monroe-Kellie dogma, CSF and blood would be first released in order ICP to be balanced. Approximately every 5 seconds the entrant CSF is 75 mL, while the entrant blood flow 100–130 mL (1/5 arterial, 2/3 venous, and 2/3 in the microcirculation).
The mechanism of Monroe-Kellie cannot maintain normal pressure when the increase of volume extends 120–130 mL. As a result, the ICV would increase, as well as the ICP. Since the cranium is a closed “box,” except of the single opening of FM, the increase of the ICV and ICP will cause the brain to prolapse with final stage of herniation—through the FM.
In case of brain atrophy, the balance of the ICV is maintained with increased CSF, while the PICS appears bigger. Clinically, because of the differences among the PICS and BVs, and the standard size of the FM, some of those patients would have more space between the brain tissue and bone's edge, and they would theoretically develop brain herniation and probably the symptomatology of ICP and ischemia with a time-delay. Something similar is observed among elderly patients with chronic subdural hematoma, where the age-related atrophy makes space for the hematoma, and many do not show any symptoms of it, until a recurrent bleed occurs.
This states an important probability fact, requiring more investigation, but also an issue that should be considered for the first hours of management of the traumatic brain injuries and preventive measures for the general population.
Go to :
DISCUSSION
The human cranial skeleton is a complex structure made up of bones and cartilages that derive from the neural crest and mesoderm.15) It consists of 2 main parts, the neurocranium and the viscerocranium, encircling the brain, and shaping the face, respectively. As far as the neurocranium is concerned, it can be further sub classified into skull base, chondrocranium and calvaria.1536) According to Raam et al.30) the adult cranial vault is made of eight separate bones. The “joints” of the cranial vault play also a major role to the separate bones of the last, holding them tight together and allowing the growth of the skull.1530)
The skull cavity encloses brain tissue, including meninges, cerebrospinal fluid, vessels and nerves. The final size of the ICV is reached at the age of 16–20 years old and it is believed that it remains constant thereafter.1737) The average BV of a well-nourished European is about 1,260 cm3 for males and 1,130 cm3 for females. There are differences between the sexes due to differences in height and size.311)
According to Zdilla et.al.38) the mean FMSA is about 864 mm2. Moreover, between the FM area and dimensions there are major dissimilarities among the ethnicities and sexes. Generally, males have a considerably bigger transverse and sagittal lengths than female individuals. As a result, an important distinction is observed in the FM area between the both sexes (98.78 mm2), but no such distinction in the foramen's perimeters (t=1.785).
Finally, according to Acer et al.1) the ICV's mean was estimated at 1,311 cm3. A positive association (r=0.271, p=0.005) was established between ICV and FMSA. These results are the same as the ones of the current study. Furthermore, the p-value of this analysis is <0.001, while the R2=1, indicating even stronger relation between ICV and FMSA.
Atrophy, in this respect, is an end-stage status for many diseases, including substances' abuse, dementia, infections, neurological, systematic, psychiatric, and posttraumatic conditions.713142021262935) Furthermore, there is a normal age-related loss of BV evaluated at 0.1–0.3% per year.12) Moderate to severe brain atrophy specifically protects from the development of malignant middle cerebral artery infarction.23) This happens, because cerebral atrophy provides a compensatory intracranial space for the increase in volume and protects from regionally increase of the ICP, thus, protects patients with atrophy from herniation and death after a large cerebral infarct.19) Apart from the general protection from fatal brain herniation in patients with intracerebral hemorrhage, brain atrophy also protects patients with basal ganglia hemorrhage, and after such, it is used as a prognostic factor for the final functional outcome.1618)
Brain herniation, as stated above, is a fatal condition, where the brain tissue and nerves are compressed, the vessels are obstructed and the ICP is highly increased. The management of the herniation, however, is suggested to be as rapid as possible. The recommendations833) suggest that neurosurgical procedure is equal to a “gold standard.” Mannitol is used in the beginning, but a quite high percentage of the individuals with severe traumatic brain injury will require surgery to prevent brain herniation. There are four types of brain herniation based on the anatomical region that is injured. Final stage, however, is the central herniation through the FM.
According to this analysis, the PICS' are different among the studied groups. The main idea is that, in case of brain injury, where the capacity of the “box” containing blood, CSF and the normal brain tissue is suppressed, the ICV could not grow independently, but a brain herniation would develop. In those cases, people with brain atrophy, because of the differences in the volumes, would have more space, thereafter a delayed fatal result. And in those cases, the “rapid management” could prevent death.
Go to :
CONCLUSION
In conclusion, the study presents a theoretical suggestion that brain atrophy could be a protector of brain herniation. Since the condition itself is due to other pathological processes, it requires further investigation and high attention from the health care personnel, not only because it would require reevaluation of the brain trauma guidelines, but also different therapeutical approaches.
Go to :
 XML Download