

 PDF
PDF ePub
ePub Citation
 Print
Print


INTRODUCTION
Undernutrition in children is considered as an important factor for illness and death, attributable to more than half of the deaths of children worldwide [12]. It also risks their physical and mental development, resulting not only in poorer educational achievements but also higher chronic disease development. Many national and international goals thus have emphasized the importance of nutritional status and growth of children under 5 years of age and its equity across socioeconomic groups [1]. Globally, almost half of all deaths among children under 5 are still attributable to undernutrition, and 22.2% of children under 5 were stunted in 2017 [2]. Myanmar is a country with a high burden of stunting amongst Association of Southeast Asian Nations (ASEAN) countries [3]. As the prevalence of stunting declined from 35% in 2010 [3] to 29% in 2016 [4], according to the World Health Organization (WHO)'s cut-off values of public health significance for stunting [5], Myanmar is considered to have a medium prevalence of stunting (20%–29%).
Kayin State in eastern Myanmar has experienced the conflict during the last 6 decades. The conflict has had severe impacts on the civilian population despite of low-intensity conflict. Due to the manmade and armed conflict, many families have been displaced. The family's displacement deteriorates the nutritional status of children [6]. As an impact, approximately 6,000 people from 28 villages have displaced to Myaing-Gyi-Ngu internally displaced persons (IDPs) camp in Hlaingbwe township. Food insecurity remains a major challenge in the IDP camp. Furthermore, as the camp has been supported by Myanmar monks and local authorities since 2016 [7], meat consumption is banned and all villagers have adopted to a vegetarian diet. It is assumed that low family income and the vegetarian diet in the camp result in the poor quality and low diversity of diet [8], which lead to poor nutritional outcomes particularly among children. Meanwhile, social support is considered as a strategy to increase nutritional status of young children through a positive effect on nutritional care, healthcare and psychosocial practices [9]. A study in Brazil showed the lack of social support has an adverse effect on child nutritional status, and that this effect is more significant among low-income children [10]. Thus, this study aimed to assess the prevalence of stunting and the associated factors, particularly dietary diversity and social support among children aged 6–59 months at Myaing-Gyi-Ngu IDP camp in Kayin state, Myanmar. This study's findings have notable implications for health professionals and policymakers in terms of the extent of dietary diversity and undernutrition and provide a targeted point for interventions to address stunting specific to children in IDP camps, so as to reach the Sustainable Development Goals in Myanmar and neighboring countries facing the similar challenges.
MATERIALS AND METHODS
Study population
The cross-sectional study was carried out from April to May 2019 at Myaing-Gyi-Ngu IDP camp in Hlaingbwe township, Kayin State, Myanmar. The camp population was around 6,000 and children under 5 years of age comprise 20% of the total population (n = 1,244). The inclusion criteria was children aged 6–59 months living at the IDP camp and being the youngest child in a selected household. The sample size was estimated using a confidence interval (CI) of 95%, an acceptance error of 5%, and stunting prevalence of 47.6% in an IDP camp in Shan state [11]. The required sample size was 293. The sample size was increased to 322 to account for 10% probable non-response.
As a first step, children aged 6–59 months based on the information from rural health center were listed up and selected using simple random sampling. As a second step, where there are several children aged 6-59 months in a family, the younger child was invited . In addition, children who were sick and whose mother or any caregiver were not available on the day of data collection were excluded. Finally, a total of 320 children and their mothers or caregivers participated in this study. Ethical approval was obtained from the Mahidol University Social Science Institutional Review Board (2019/050.1303) and Defence Services Medical Research Centre (IRB/2019/17) in Myanmar. Written informed consent was obtained from mothers or caregivers who participated in the survey before interviewing.
Data collection and measurement
The questionnaire was developed based on the review of related literature and structured by predisposing, reinforcing and enabling factors based on the phase 3 of PRECEDE-PROCEED model [12]. Predisposing factors include age of mother, marital status of mother, maternal education, monthly family income in Myanmar Kyats (MMK), size of family, numbers of children under 5, age of child, sex of child, birth order, completion of expanded program on immunization (EPI), feeding patterns during the first 6 months of age, timing of introduction of complementary foods, and dietary diversity score (DDS). In addition, reinforcing factor includes social supports and enabling factors are ways to get to the primary health care unit, time taken to reach primary health care unit, having child health care services from health provider, antenatal care services, consumption of iron-folic acid tablets, and postnatal care services utilization within 42 days after delivery. The structured questionnaire was constructed in English and was translated into Myanmar language and then translated it back into English to compare the 2 versions of questionnaire. The validity of the questionnaires was tested by advisory team.
Anthropometric data
Data were collected from 320 mothers using standardized structured questionnaires in face to face interviews in the camp. Length/height and weight of the children were measured using Portable baby/child/adult length-height measuring board (S0114540, Portable baby/chd/adt L-H mea.syst/SET-2) and weight scale (MODEL 235 6S; Salter England, West Bromwich, UK) according to FANTA-Anthropometric-Guide-May 2018 [13]. The values of measurements took up to one decimal in accuracy, for example, 0.1 kg in weight and 0.1 cm in height. According to the WHO Child Growth Standards [14], children with a height-for-age Z-scores below −2 standard deviation of the corresponding reference median (HAZ < −2) were classified as stunted [14].
Dietary diversity
Qualitative recall of the child's food consumption during the previous 24-hour was used to calculate individual DDS using the FAO guidelines for measuring household and individual dietary diversity [15]. Child's food consumption was asked to mothers and were categorized into 12 food groups. When at least 2 food items in a group were consumed, one point was scored. When less than 2, half point was given, and when no items were consumed, zero (0) point was given (the total score ranged from 0 to 12 scores). Accordingly, minimum dietary diversity was defined as the proportion of children who received at least 4 or more varieties of foods in a 24-hour time period according to a threshold of 4 foods out of 7 for children aged between 6–23 months [16], due to no national and international guidelines on which to base cut-offs for children under age 5.
Social support
The questions developed by de B L Carvalhaes et al. [10] were adopted. The social support encompasses 3 dimensions of the social support, namely support availability, presumed support, and received support. Presumed support was measured by interviewing mothers about how sure they were of receiving help from these individuals, such as friends, neighbors, and relatives, in face of the daily life problems presented. Received support (social support network efficiency) was measured by questions about the type of aid received in a number of different scenarios at the latest episode: 1) housekeeping or childcare immediately after birth; 2) complete lack of money and urgent financial needs; no water and fire woods due to lack of payment; 3) no food for the child; 4) no prescription medication for the child. The questions on support availability indicated the number of individuals, such as friends, neighbors, and relatives, on whom to rely in case of necessity.
Data analysis
Descriptive statistics were used to analyze proportions of participants' general characteristics. Bivariate associations between dependent variables, such as stunting, and other independent variables were calculated using χ2 test and statistical significance was considered with p value < 0.05. Covariates with p value < 0.1 in bivariate analyses were entered into the final multiple logistic regression model using stepwise method to identify predictors to the dependent variables. SPSS software version 23.0 (IBM Corp., Armonk, NY, USA) was used for data analyses.
RESULTS
Two-thirds of children aged from 6 to11 months ate cereals (e.g., rice) and around half of them consumed milk, oils and spices. Also, one-third of them received sweet and white tube in the past week (Figure 1). Most children aged 13–24, 25–36 and 37–59 months consumed rice, oils and spices at least once in the past week. Intake of high-protein foods, such as fish or sea foods, egg, and meat was not consumed at all, although consumption of legumes gradually increased as age increased from 16%to 43% in children aged from 6 to12 months and aged from 37to 59 months, respectively. Those having milk at 6–12 months were about 60% but decreased continuously (by 7.4% for 37–59 months of age). On average, children aged 6–12 months consumed about 2 food groups per day and in the past 13 months of age, they had about 3 food groups (Figure 2).
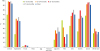 | Figure 1Proportion of children who consumed at least one food item from each food group during previous week by age group.
|
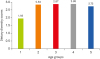 | Figure 2Mean of DDSs of children aged 6–59 months in the IDP camp.DDS, dietary diversity score; IDP, Internally displaced person.
|
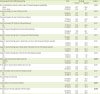
Prevalence of stunting among a total of 320 children aged 6–59 months in the IDP camp are very high (59.4%) (Table 1). A majority of children lived with mothers aged more than 20 years and illiterate, and in a big family (5 or more persons). More than two-thirds of family earned monthly less than 4,000 kyats (approximately 2.6 USD; 1 USD = approximately 1,510 MMK). Only one-third of the children completed EPI and only one-fourth responded more than 3.5 out of twelve points of dietary diversity (Table 2).
Table 1
Association between predisposing factors and child stunting

Values are presented as number (%).
Bold values indicate statistical significance (p < 0.05).
EPI, expanded program on immunization; DDS, dietary diversity score; SD, standard deviation.
![]()
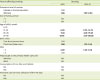
Table 2
Association of social support and healthcare service with child stunting
![]()
The bivariate associations between independent factors and stunting by chi-square test were presented in Tables 1 and 2. This study showed that illiterate mother, large family size, older children, third or later born child and low DDS among predisposing factors were significantly associated with the stunting status (Table 1). With respect to reinforcing factors (Table 2), around 20% of mothers reported they had no one on whom to rely on in case of necessity, while the others had one or 2 people on whom to rely on. Only half of mothers reported they had presumed supports in case of financial crisis, emotional problems and for childcare following delivery. About one third of mothers had received support for financial crisis during lack of cooking woods, during lack of payment, during lack of medical prescription and food for child. However, the bivariate analyses showed any types of social supports were not significantly associated with stunting of children. Among enabling factors (Table 3), only 3 independent variables, such as ways to get to primary health care units, taking iron/folic acid tablets and PNC services utilization within 42 days after delivery were significantly associated with stunting of children.
Table 3
Logistic regression analysis for predictors of stunting
AOR, adjusted odds ratio; CI, confidence interval; DDS, dietary diversity score; NA, not available.
Bold values indicate statistical significance (p < 0.05).
![]()
Based on the results of χ2 tests, all the variables with p value < 0.1 were comprised into the full model. Table 3 shows significant predictors of stunting of children aged 6–59 months. Illiterate mothers were more likely to have the stunting child than who was literate (odds ratio [OR], 1.86; 95% CI, 1.07–3.24). The third or later born children are nearly 2 times more likely to be stunted than firstborn and second-born children (OR, 1.88; 95% CI, 1.13–3.14). Older children were more likely stunted compared to those aged 6–12 months (OR, 6.36, 95% CI, 2.74–14.74 for 13–24 months; OR, 7.45, 95% CI, 3.21–17.25 for 25–36 months; OR, 12.75, 95% CI, 5.51–29.52 for 37–59 months). Children who consumed 3.5 or more food groups are more likely to be stunted than who consumed 4 or higher food groups (OR, 4.22; 95% CI, 1.94–9.16).
DISCUSSION
To our knowledge, this is the first study to assess the prevalence of stunting among children aged 6–59 months in the IDP camp in Kayin State, Myanmar. This current study showed higher prevalence (59.4%) of stunting compared to that at national level (29%) [4]. Furthermore, this is higher than global prevalence of children under 5 years (22%) and prevalence of Southeast Asia region (25%) in 2018 [17]. The high prevalence rate (over 40%) indicates this community is in a nutritionally critical situation [5]. Compare to other IDP camps in Myanmar, it was also higher than an IDP camp in Kachin (36%) and Shan State (40%) and IDP camps in Rakhine State (27.5%–47.6%) [7]. High prevalence of stunting in the studied camp may be partly explained by low DDS in the camp. The camp is run and supported by Buddhist monks, whose diet includes no meat. The people in the camp are restricted to consume meat, which resulted in low protein diet. Thus, our study in the IDP camp shows that the diet of children lacked diversity, and none of children reported the intake of foods from high-protein foods (i.e., meat, poultry, eggs, and fish). Most children consumed less than 4 food groups on the day prior to the survey and the foods consumed were mainly cereals, sweets, oils and spices, which are mostly high-carbohydrate foods and may be associated with later obesity among stunted children. Our study showed that children who achieved minimum dietary diversity (a DDS of 4 or higher) was only 11.5%, which is lower than that in children aged 12–23 months in Ayeyawady region of Myanmar (29.2%). In accordance with our study's finding, the study in Ayeyawady region of Myanmar also showed the inverse association between DDS and stunting [18]. Children with a DDS of less than 4 were associated with higher prevalence of stunting (42.7%) compared to those with a DDS of 4 or above (16.1%) (p = 0.013) [18], in consistent with previous studies in Bangladesh [19] and India [20]. A study in India showed that desfite of no significant difference in stunting prevalence between children with medium and low food diversity, there was significantly different after comparing children with high and low food diversity [20]. Promotion of home gardens and community farms can be implemented to promote dietary diversity, and to reduce food insecurity in the camp. From a policy perspective, one of the researches held in other 3 regions of Myanmar showed that dietary diversity can be improved by promoting home gardens among vulnerable households. It also pointed out that a household with home gardens had less possibility of being in the lowermost dietary diversity, and there was positive association between having home garden and being high DDS [21]. In addition, our study showed about 45% of children were introduced to complementary foods before 6 months of age, although a majority of children were mainly breast-fed during the first 6 months of age. Overall infant and young child feeding (IYCF) practices among the studied children were not at a satisfactory level, which may contributes to higher stunting rate in the IDP camp. Further education on IYCF should be followed.
Two third of the families had earned less than 4,000 MMK (approximately 2.6 USD) per month because of a lack of job opportunities near the camp. Although this study showed no association between monthly family income and stunting of the child, low family income may have an indirect association with nutritional status of children by influencing the low quality and less diversity of a child's diet and the low ability to access food [22]. Our study also showed that the majority of mothers were illiterate (71.9%) and children with illiterate mothers had higher prevalence than those with literate or formal education, in consistent with previous studies [823]. It may be due to the fact that mother's ability of child care and education level were associated with undernutrition. The mother's education and access to information can be an essential determinant of child growth development [2425] and education might enhance mother's autonomy, hence increasing ability of decision making of mothers regarding their own health.
The study's finding showed that the birth order was associated with the nutritional status of children. This could be because the high prevalence of stunting in the children with greater birth order (third or later born child) is associated to the other children due to lack of attention, care and resource to elder children when they give birth to new children [26]. Assuming that the birth order greater than 2, there might be more chance to get undernutrition among many siblings compared to the first child [2627]. In addition, stunting is more prevalence in the older children than younger children in our study, in accordance with other studies [28]. In terms of social support, this study did not show a significant association in the bivariate and multivariate models. However, the levels of support availability, presumed support and support received of mothers were generally low. A study in Nicaragua reported that women with the lowest social support had infants with the highest risk of stunting in Nicaragua [29]. Similarly, a study in Brazil showed the lack of economic support during adverse situations accounted for a very high risk of malnutrition, particularly among low-income children [10]. Further studies should be followed to how to increase social support and if social support can contribute to the reduction of malnutrition and dietary diversity particularly in the IDP camps.
There are several limitations in our analysis. First, the use of cross-sectional data and the analysis cannot provide evidence of a causal relationship between stunting and the determinants. Second, the data were obtained from an IDP camp in one township, which are not necessarily representative of the township as a whole. Lastly, data on personal and household characteristics were based on the mother's recall, which may have been subject to bias, although immunization cards were checked before interviewing. Despite these limitations, this study has assessed dietary diversity and social support in children living at the camp and explored the associations with stunting that have previously not been reported in Myanmar. The promotion of strategies to improve children's food consumption and dietary diversity is needed in the study area. Nutrition education to mothers regarding proper child feeding practices and efforts to increase agricultural productivity in collaboration with the respective religious leaders in the camp is highly recommended.
In conclusion, this study highlighted high prevalence of stunting (59.4%) in the IDP camp, Kayin State in Myanmar, which is above the WHO's cut-off values of public health significance for stunting, requires urgent action. In addition, high-protein foods were not consumed and a majority of children did not meet the recommended minimum dietary diversity. Local governments and non-governments organizations involved in providing of care for those in IDP camps should pay special efforts to improve the dietary diversity and nutritional status of children. Nutrition education to mothers regarding proper IYCF practices and higher agricultural productivity in collaboration with the respective religious leaders is highly recommended.
 XML Download