

 PDF
PDF ePub
ePub Citation
 Print
Print


INTRODUCTION
Childhood obesity is a serious public health concern in the United States [1]. According to the 2015–2016 National Health and Nutrition Examination Survey, over 13 million children (19%) aged 2–19 years had obesity [2]. The American Academy of Pediatrics (AAP) 2007 expert recommendations on childhood obesity care advise screening children aged 2 years and older for obesity at each well-child visit by measuring height and weight, calculating body mass index (BMI) for age, and plotting those measures on age- and sex-specific growth charts [3]. In 2009, childhood weight assessment (which includes BMI percentile documentation) was added as a health care performance measure to the Healthcare Effectiveness Data and Information Set and is currently a Medicaid Child Core Quality Measure [45]. In addition, the US Preventive Service Task Force (USPSTF) provided a grade B recommendation that clinicians screen for obesity in children and adolescents aged 6 years and older and offer or refer them to comprehensive, intensive behavioral interventions to improve weight [6]. Despite efforts to improve uptake of the AAP and USPSTF recommendations, a recent quality report from the National Committee for Quality Assurance indicates only 57%–73% of children aged 3–17 years had BMI percentile documented at their last outpatient visit [7].
Multiple studies have demonstrated that obesity-related electronic health record (EHR) functions, such as clinical decision support (CDS) tools, can aid providers to increase screening and diagnosis of obesity in children and adolescents [89]. In 2009, the Health Information Technology for Economic and Clinical Health (HITECH) Act was passed with the aim of fostering meaningful use (MU) of certified EHR technologies. The HITECH Act established an incentive payment program for healthcare providers to adopt EHRs that met specific criteria known as MU [10]. Stage 1 MU criteria required EHR systems to automatically calculate and display BMI percentile, with the option to plot and display BMI on growth charts [11]. The HITECH Act also established certification criteria for EHR technology capacity, functionality, and security in order to support MU. While adoption of EHRs has increased among outpatient providers since the introduction of the HITECH Act [12], a 2013 survey of physicians suggested that EHRs offer limited functionality to support obesity-related care among children and adults [13].
Despite current clinical practice recommendations, incentives for EHR adoption that meet Stage 1 MU, and a growing body of scientific evidence on CDS tools, little is known about EHR obesity-related functions available to healthcare providers caring for children. This study aims to describe, among healthcare providers who see children, the prevalence of EHR use and specific childhood obesity-related EHR functions by provider and practice characteristics. Furthermore, we aim to identify characteristics associated with having core EHR functions for childhood obesity screening.
MATERIALS AND METHODS
Survey administration & sample
We analyzed 2015 data from DocStyles, a web-based survey of primary care providers and other healthcare professionals conducted annually by Porter Novelli Public Services. DocStyles survey samples are drawn from SERMO's Global Medical Panel of over 157,000 healthcare providers [14]. A double opt-in sign up process with telephone confirmation is used to verify participants' place of work. E-mail invitations are sent to participants with active links to the web-based survey. Respondents are paid an honorarium ($35–$80), which varies in accordance with the number of questions they were asked to complete.
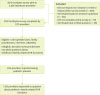
A total of 2,281 health professionals were invited to participate in the 2015 DocStyles survey (Figure 1). Quotas were set to reach 1,000 primary care physicians, 250 pediatricians, 250 obstetrician/gynecologists (OB/GYNs), and 250 nurse practitioners. Respondents were screened for eligibility and invited to participate if they practiced in the United States, actively saw patients, worked in an individual, group, or hospital practice, and had been practicing for at least three years. Of those invited to participate, 73 respondents did not complete the entire survey; 152 were ineligible to participate based on screening criteria; 49 were eliminated due to filled quotas; and 256 did not respond or tried to respond after the survey closed [15]. For the purpose of our study, nurse practitioners were ineligible (n = 250) because they were not asked to complete the EHR survey questions. The present analysis included providers of various specialties who saw pediatric patients; 344 were excluded because they did not provide pediatric care resulting in a final analytic sample of 1,156.
Measures
The 2015 DocStyles survey contained 3 questions inquiring about EHR functionality specific to childhood obesity-related care. Obesity-specific EHR questions were preceded by the statement, “Does your EHR provide the following supports for obesity-related care for children? If you use more than one EHR, answer based on your primary outpatient EHR.” Providers' EHR functionality was assessed with the questions, 1) “Automatically calculate BMI percentile from height and weight for pediatric patients;” 2) “Display pediatric BMI trajectory (e.g., store calculated BMI and graph BMI over time);” and 3) “Flag pediatric patients with abnormal BMI values (e.g., overweight and obese).” Response options included “Yes,” “No,” and “Do not have an EHR.”
The DocStyles survey also measured demographic and practice characteristics for all respondents, including gender, age group (< 40 years, 40–45 years, 46–54 years, and > 54 years), race/ethnicity (non-Hispanic white, non-Hispanic black, Hispanic, non-Hispanic Asian, and non-Hispanic other), provider height and weight (used to calculate BMI as kg/m2), specialty (family practitioner, internist, pediatrician, and OB/GYN), years in practice (< 10 years, 10–15 years, 16–24 years, and > 24 years), practice type (individual outpatient, group outpatient, inpatient), number of patients per week (< 80, 80–100, 101–125, and > 125), number of pediatric patients per week (< 10, 10–25, 26–50, and > 50), number of practitioners in the group (< 3, 3–5, 6–10, and > 10), region (Midwest, South, Northeast, and West), and the approximate household income of the majority of their patients (poor, < $25,000; lower middle, $25,000–$49,999; middle, $50,000–$99,999; upper middle, $100,000–$249,999; and affluent, ≥ $250,000).
Statistical analysis
We examined four outcomes: 1) providers that had an EHR; and among those with an EHR, providers that report that their EHRs 2) automatically calculate BMI percentile (AUTO), 3) display BMI trajectory (DISPLAY), and 4) flag abnormal BMI values (FLAG). We estimate the prevalence of these outcomes, overall and by provider and practice characteristics. The χ2 tests were used to examine differences in these outcomes across provider and practice characteristics (significant at p < 0.05).
We imputed 13.0% of missing values for BMI using chained equations. A random seed of 53,421 was used and 5 imputations were performed. Using the imputed data set, three separate multivariate logistic regression models were fit to determine adjusted odds ratios (aORs) and 95% confidence intervals (CIs) for each of the 3 obesity-related EHR functions by provider and practice characteristics. Due to collinearity with other variables, we excluded certain provider and practice characteristics from the model: number of patients seen per week, years in practice, and number of practitioners in group. All statistical analyses were unweighted and were performed with the Statistical Analysis Software (version 9.3; SAS Institute, Cary, NC, USA) and STATA (version 13.0; StataCorp, College Station, TX, USA).
RESULTS
The majority of respondents were male (67.7%), non-Hispanic white (61.3%), saw ≤ 100 patients per week (56.4%) and were in group outpatient practices (72.0%); 50.5% were ≤ 45 years of age and 38.2% were family practitioners (Table 1). The majority reported seeing patients in the lower-middle (23.6%), middle (34.3%), and upper-middle income brackets (23.6%). Approximately 88% of surveyed providers reported having an EHR. Prevalence of having an EHR differed significantly by provider age, provider specialty, years in practice, practice type, number of pediatric patients seen per week, and number of practitioners in group (all p < 0.05).
Table 1
Characteristics of healthcare providers and their practices, and their association with EHR use for childhood obesity care (DocStyles, 2015)
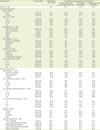
Values are presented as number (%).
BMI, body mass index; EHR, electronic health record.
*EHR functionality: 3 screener questions on EHR capacity to automatically calculate BMI, display BMI trajectories, and flag abnormal BMIs; †Based on sample size of n = 1,023 for those who have an EHR; ‡Implausible variables removed; §p < 0.05 χ2 or Fishers exact test.
Of providers with an EHR, approximately 90.1% reported having AUTO, 61.62% DISPLAY, and 54.2% FLAG. Providers reporting having EHR with AUTO differed by provider gender, age, years in practice, and practice type (all p < 0.05), with the highest proportion among females (93.2%), providers aged < 40 years (93.3%), those < 10 years in practice (93.9%), and those in group outpatient practices (91.5%). Providers reporting having an EHR with DISPLAY differed by provider gender, age, race/ethnicity, provider specialty, years in practice, and number of children seen per week (all p < 0.05), with the highest proportion among females (67.6%), providers aged < 40 years (70.8%), black, non-Hispanic providers (80.0%), pediatricians (81.1%), those with < 10 years in practice (70.8%), and those who saw an average of >50 children per week (77.8%). Providers reporting having an EHR with FLAG differed by provider age, race/ethnicity, provider specialty, years in practice, number of patients seen per week, and number of children seen per week (all p < 0.05), with the highest proportions among providers aged < 40 years (62.8%), Hispanic providers (68.0%), family practitioners and internists (57.6%), those with < 10 years in practice (59.6%), those who saw > 125 patients per week (59.8%), and those who saw 26–50 children per week (60.6%).
Among respondents with an EHR, those aged < 40 years had significantly greater odds of reporting having an EHR with 1) AUTO (aOR, 3.0; 95% CI, 1.58–5.70), 2) DISPLAY (aOR, 2.07; 95% CI, 1.38–3.12), or 3) FLAG functionalities (aOR, 1.67; 95% CI, 1.14–2.44), compared to providers aged > 54 years (Table 2). In analyses of the prevalence of EHR functions by provider specialty, the odds of having an EHR with DISPLAY were lower among OB/GYNs (aOR, 0.36; 95% CI, 0.23–0.55) and internists (aOR, 0.50; 95% CI, 0.34–0.74) compared to family practitioners. Pediatricians had lower odds of having an EHR with FLAG (aOR, 0.51; 95% CI, 0.31–0.85) compared to family practitioners. Providers working in inpatient practices had 65% lower odds of having an EHR with AUTO compared to providers working in individual outpatient practices (aOR, 0.35; 95% CI, 0.15–0.80). Compared to providers who saw < 10 children per week, those seeing > 10 children per week had higher odds of having an EHR with DISPLAY (aOR, 1.64–2.25) and FLAG (aOR, 1.64–3.09). No association was found between patient volume and having AUTO. The odds of having an EHR with FLAG was higher among providers who practiced in the Northeast (aOR, 1.53; 95% CI, 1.06–2.19) compared to the South, or saw primarily upper middle income-level patients (aOR, 1.93; 95% CI, 1.10–3.40) compared to patients in the lowest income bracket.
Table 2
Multivariable association between medical provider and practice characteristics and EHR functionality for childhood obesity care (DocStyles, 2015)
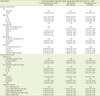
Values are presented as aOR (95% CI)‖.
EHR, electronic health record; BMI, body mass index; Ref, reference group; aOR, adjusted odds ratio; CI, confidence interval.
*Multivariate logistic regression model predicts EHR functionality based on medical provider and practice characteristics; †Imputed 155 (13%) missing values for BMI using chained equations; ‡Considered statistically significant based on 95% CI; §30 observations dropped in STATA due to no variation in outcome for this group; ‖Models controlled for provider gender, age, race/ethnicity, BMI category, specialty, practice type, number of pediatric patients seen per week, region, and finances of patients.
DISCUSSION
Overall, we found that 88.5% of providers surveyed had an EHR, which is consistent with recent studies reporting EHR adoption rates around 78%–88% [131617]. Of those, most reported having an EHR with AUTO. It was previously reported in a 2013 DocStyles study using similar questions that 61% of primary care providers who saw children had an EHR with AUTO [13]. These differences may be explained by the continued federal financial incentives under MU requirements. Few providers had an EHR with the core functions of DISPLAY (61.5%) or FLAG (54.2%). Though DISPLAY and FLAG are relatively basic functions, the lower prevalence of these CDS tools may be due to lack of MU incentives for these core functions, or poor optimization of EHR platforms for many aspects of pediatric care [1819]. A 2012 national survey by the AAP found that only 3% of pediatricians reported that their EHRs were “fully functional and pediatric-supportive [20].” It remains unknown if the same conditions remain true today.
We found that younger providers had greater odds of having EHRs that supported obesity-related care across all three functionalities. These findings are consistent with other studies suggesting that younger providers may be more likely to adopt EHRs [131621]. While internists and OB/GYNs, who in this study had lower odds of having an EHRs with DISPLAY, may serve as primary care providers for children and adolescents, national trends indicate that most pediatric primary care is delivered through family physicians and pediatric generalists [22]. Selecting an EHR with the capacity for DISPLAY may be less of a priority for providers with a majority adult practice population. However, in this study pediatricians had lower odds than family practitioners of having an EHR with FLAG (aOR, 0.51; 95% CI, 0.31–0.85). Data from the 2003–2010 National Ambulatory Medicare Care Survey suggest that general and family practices had the highest frequency of EHR use compared to other specialties, which may help explain the difference in core EHR functionalities seen in our study [23].
In our study, providers working in inpatient settings had significantly lower odds of having an EHR with AUTO compared to individual outpatient practice providers. Multiple studies have demonstrated that childhood obesity is rarely identified or addressed by providers in hospitalized children [2425]. Inpatient EHRs with AUTO capabilities may help to increase opportunities to identify and address obesity among hospitalized children. National survey data suggest that US hospitals have made substantial progress in the adoption of certified EHRs, with 96% of non-federal acute care hospitals utilizing certified EHRs in 2015 (up from reported 71.9% in 2011) [26]. Despite the high uptake of certified EHRs, a 2012 American Hospital Association annual survey found that only 42% of US hospitals had an EHR that met all 14 core criteria for Stage 1 MU [27]. While hospitals may possess certified EHR systems, variations in MU achievement across these systems persist [28]. Furthermore, many hospital EHR systems are designed with adult patients in mind and lack safety and functional features for pediatric care [19].
We found that providers who saw a higher volume of pediatric patients per week had greater odds of having an EHR with DISPLAY and FLAG capabilities, perhaps because providers who see more pediatric patients per week may be able to justify the cost of investing in an EHR with childhood obesity-related care functions due to patient volume or practice size [29]. Cost has repeatedly been found to be a primary barrier in the adoption of EHRs by healthcare providers, along with lack of customizability, interoperability, and utility [29]. Large variations also exist in the availability of CDS tools across both commercial and internally-developed EHRs [30]. Open-source technologies are emerging as one solution to overcome the cost and interoperability barriers associated with proprietary EHRs. Efforts to create open source, vendor neutral computer assisted decision tools may aid adoption of better CDS tools to support higher quality of healthcare delivery.
Our study found that Northeast practices had greater odds of having an EHR with FLAG capabilities. This finding may be related to a higher concentration of academic, free standing children's hospitals in the Northeast. Major children's teaching hospitals are more likely to adopt EHRs than non-teaching children's hospitals [31]. Additionally, free-standing children's hospitals are more likely to adopt EHRs that support growth charts for children than associate children's hospitals [32].
This study is subject to several limitations. First, data on EHR functionality are self-reported by providers and may be subject to recall and social desirability bias. Childhood obesity-related care functions may exist within the provider's EHR system without their knowledge. The present study does not differentiate between perceived and actual limitations of EHR functionality. Secondly, DocStyles is not nationally representative and is a convenience sample of US healthcare providers therefore the results may not be generalizable. However, provider age, gender, years in practice, and regional distribution were similar to the American Medical Association master file [15]. Finally, DocStyles is a web-based survey, which may be biased towards select providers willing to use this format.
CONCLUSION
Though the majority of providers that see children have EHRs, there is substantial room for improvement in EHR function related to childhood obesity across all provider and practice types. Most providers had EHRs with AUTO, but fewer had EHRs with DISPLAY or FLAG capabilities. All three functions provide CDS to facilitate high quality care for children with obesity. Further assessment is needed to identify barriers to the adoption of more advanced EHR capabilities that can improve obesity-related care for the millions of US children and families struggling with obesity.
 XML Download