

 PDF
PDF ePub
ePub Citation
 Print
Print


INTRODUCTION
Body fluid (BF) cellular analysis provides physicians with extensive and substantial information regarding patient medical conditions, including inflammatory diseases, infection, hemorrhage, and malignancy [123]. BF analysis has been performed by manual counting using hemocytometer chamber methods [14], which has long been regarded as the gold standard [5678]. However, manual counting is time-consuming, labor intensive, and subject to high inter-observer variability and potential poor reproducibility [1238910]. Automated analyzers are expected to improve precision and accuracy, reduce inter-observer variability, and shorten turn-around time [611]. They have also shown acceptable performance and a good correlation with manual counting [3567811121314]. However, their limitations include poor precision at lower cell counts, lack of morphological differentiation, especially for malignant or clustered cells, and incomplete validation according to international standards [6891115]. Hence, there remains an ongoing debate regarding the use of automated cellular analyzers versus manual counting [2]. Therefore, different laboratories might set up their own rules for BF analysis, combining automated cellular analyzer and manual counting [5].
In this study, we evaluated the analytical performance of three automated cellular analyzers for BF analysis: the UniCel DxH 800 (Beckman Coulter, Brea, CA, USA), XN-350 (Sysmex, Kobe, Japan), and UF-5000 (Sysmex). To the best of our knowledge, this is the first study to compare the analytical performance of these three analyzers.
Beckman Coulter UniCel DxH 800 is a fully automated hematology analyzer, which identifies cells using the Coulter technique based on the principle of impedance technology and light scatter analysis. For BF mode, the manufacturer recommends that a rinse cycle be performed using a diluent prior to analyze BF samples in order to ensure that the background total nucleated cells (TNCs) and red blood cell (RBCs) counts are within acceptable limits [16].
Sysmex XN-350 is also an automated hematology analyzer. It aspirates only 70 µL of BF and uses fluorescence flow cytometry for TNCs and flow impedance technology for RBCs. TNCs include high-fluorescence BF cells (HF-BFs) that fall outside the white blood cell (WBC) differential fluorescence scattergram [10]. HF-BFs include macrophages, lining cells, such as mesothelial cells, atypical cells, and malignant cells. Moreover, it is a part of the Sysmex XN series that has been validated for BF analysis [514].
Sysmex UF-5000 is a third-generation urine sediment analyzer that uses flow cytometry [17]. Each cell is stained with fluorescent dyes and passed through the flow lamina. The instrument enumerates cells using the forward and side scatters and side fluorescent light [18]. The UF series has been validated for BF cellular analysis, including cerebrospinal fluid (CSF) [61819].
Our aims were the followings: (1) to investigate the basic performance characteristics, including precision, linearity, and detection capabilities, of the three automated analyzers; (2) to compare TNCs, WBCs, RBCs, and differential cell counts obtained using the automated analyzers with the results obtained by manual counting as a reference method; and (3) to establish a workflow for BF analysis in our laboratory.
METHODS
Study samples
A total of 542 BF samples were collected prospectively from April to June 2016 from in- and outpatient samples submitted for routine BF analysis to the clinical laboratory of the Severance Hospital, Yonsei University, Seoul, Korea. These comprised 88 CSF and 454 non-CSF samples, including 183 peritoneal, 130 pleural, 104 continuous ambulatory peritoneal dialysis (CAPD), 20 bronchoalveolar lavage (BAL), 10 pericardial, five synovial, and two cystic fluid samples. Immediately after receiving the sample for routine BF analysis, each sample was aliquoted into two tubes: 1.0 mL for manual counting and differential counting by microscopy and at least 1.4 mL for analysis using the three automated analyzers. CSF and non-CSF samples were collected in plain tubes and K2-EDTA anticoagulated tubes, respectively. All samples were analyzed within two hours once they were received.
Manual microscopy
Manual microscopic counting was performed using a Neubauer hemocytometer. For non-CSF samples, TNCs and RBCs were counted from unstained and undiluted samples. For CSF samples, RBCs were counted in the same way; however, TNCs were counted using samples diluted 1:10 (50 µL CSF+450 µL of solution) in Turk's solution (crystal violet and glacial acetic acid dissolved in distilled water). Cell counting was performed at 200× magnification using a standard light microscope. Two well-trained laboratory technologists performed the counting independently, and the average number was converted into cells/µL according to the following formula provided in the CLSI H56-A guidelines [4]:
For differential WBC counting, slides were prepared by cytocentrifugation of the samples followed by Wright-Giemsa staining. At least 100 cells were counted at 400× magnification. Neutrophils, eosinophils, and basophils were classified together as polymorphonuclear cells (PMNs). Lymphocytes, plasma cells, and monocytes were classified together as mononuclear cells (MNs). Macrophages, lining cells, such as mesothelial cells, atypical cells, and malignant cells were counted as “other cells.”
Precision and linearity analysis
Using high and low cell number (TNCs and RBCs) QC samples provided by each vendor, precision analysis was carried out each day for 20 working days as two runs performed in duplicate, separated by a minimum of two hours, according to the CLSI EP15-A2 [20]. The imprecision was calculated as mean±SD and CV (%).
To verify the TNC and RBC linear ranges for the three analyzers, we performed linearity analyses with high (H) cell-count patient samples. Each sample was serially diluted with a recommended diluent (D) to produce a total of five low-range concentrations: 0.75D+0.25H, 0.5D+0.5H, 0.25D+0.75H, 0.125D+0.875H, and H. The five dilution concentrations were analyzed in duplicate. The decision criterion for acceptance was defined as a % residual (distance from each data point to the calculated linear fit target) for each concentration <10% except for the lowest concentration, according to the CLSI EP06-A guidelines [21].
Detection capabilities: limit of blank (LoB), limit of detection (LoD), and limit of quantification (LoQ) verification
The LoB was determined with blank samples (UniCel DxH 800, vendor-provided diluent; XN-350, Cellpack; UF-5000, Cellsheath) measured at the beginning of the daily runs for 20 working days. The LoB was calculated as the mean value of the blank samples+(1.645×SD of blank samples) and the LoD was calculated according to the CLSI EP17-A2 [22]. The TNC LoQ was also assessed for the three analyzers, allowing a 15.49% total error, which was calculated as a root mean square of the intra-assay CVs estimated by quadruplet analysis of 20 low-count samples; 15.49% is the within-patient variation for WBC counts based on the Westgard database of the desired specifications of biological variation [23].
Method comparison
A total of 542 BF samples were first measured by manual counting using a Neubauer hemocytometer. Next, they were analyzed using the UniCel DxH 800, XN-350, and UF-5000 automated analyzers. Passing-Bablok regression and Bland-Altman analysis were used to compare the TNC counts, RBC counts, MNs, and PMNs obtained using the automated analyzers with those obtained by manual counting, following the CLSI EP09-A2 guidelines [24]. The bias within±20% at the slope of the Passing-Bablok equation was considered “acceptable.”
Establishment of reflex analysis guidelines using XN-350
Following an evaluation of the three automated cellular analyzers, we developed reflex analysis guidelines for our laboratory. We examined each sample using both the manual method and XN-350, and the results obtained from the manual method were reported to the patient via the laboratory information system (LIS). The WBC differential count results obtained from XN-350 were not reported to the patient but were stored in the LIS as research parameters so that we could collect and confirm them. The WBC differential counts obtained using XN-350 were compared with those obtained by manual differential counting. The HF–BFs results obtained using XN-350 were compared with the BF cytology results. Data were collected retrospectively between September and November 2017 from the LIS and electronic medical records of Severance Hospital.
During that period, a total of 2,779 BF analysis results were reviewed retrospectively. In total, 803 BF results had corresponding BF cytology results, including 369 peritoneal fluid, 362 pleural fluid, 35 pericardial fluid, 17 BAL fluid, 10 cyst aspirate, three CAPD fluid, two CSF, one synovial fluid, and four other BF samples. The HF-BF results were compared with the cytology results using ROC curve analysis and the optimal cut-off values were assessed for discriminating malignancy-positive or negative samples. We defined true malignancy as a cytology report indicating “positive or suspected malignancy.” If a cytology report showed only “atypical cells,” we considered it negative.
Ethical approval
In this study, we received two ethical approvals for two subsections separately. For the first subsection that was carried out from April to June 2016 using 542 BF samples, approval was obtained from the Institutional Review Board (IRB) of Severance Hospital (No. 1-2016-0011). For the second subsection that was carried out between September and November 2017 using our LIS data, another approval was obtained from the IRB (No. 1-2018-0080). For both subsections, the requirement for informed consent from patients was waived on condition that the samples were not individually identifiable and that patient privacy was thoroughly protected.
Statistics
Statistical analysis was performed using IBM SPSS Statistics for Windows, version 23.0 (IBM Corp., Armonk, NY, USA) and Microsoft Excel 2010 (Microsoft Corp., Redmond, Washington, USA) with Analyse-it version 5.11 (Analyse-it Software Ltd., Leeds, UK). Detection capabilities were calculated according to the CLSI guidelines [22]. Passing-Bablok regression and Bland-Altman analysis were used for method comparison. Diagnostic agreement of the XN-350 and manual microscopy compared to BF cytology was evaluated using receiver operating characteristics (ROC) curves, and the area under curve (AUC) values were compared for the determination of the presence of malignant cells. For the establishment of reflex analysis guidelines using XN-350, the sensitivity, specificity, positive predictive value (PPV), negative predictive value (NPV), agreement rate (%), and kappa values were calculated according to various cut-off values. Additionally, the 95% confidence intervals (CIs) of each item were also calculated. P<0.05 was considered significant.
RESULTS
Analytical performance
The precision, linearity, and detection capability results are shown in Table 1. The within-device imprecision for TNC was 5.6–9.3% for the low concentration control and 1.2–2.4% for the high concentration control. The within-device imprecision for RBC was 4.3–8.0% for the low concentration and 2.4–3.3% for the high concentration. TNC and RBC concentration linearities were verified using patient samples. The TNC and RBC detection capabilities (LoB, LoD, and LOQ) using the three automated analyzers were verified (Supplemental Data Figure S1).
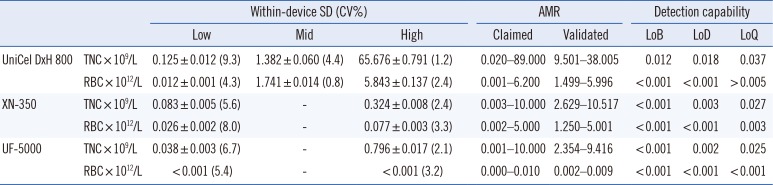
Table 1
TNC and RBC precision, linearity, and detection capabilities using three automated analyzers
![]()
Method comparison
The results of method comparisons are summarized in Table 2. All three automated analyzers showed acceptable performances (%bias within±20% at the slope of the Passing-Bablok equation) with manual counting, except for the RBC count in CSF samples using the UniCel DxH 800. The biases obtained by Bland-Altman analysis are also summarized in Table 2. For the PMN (%) and MN (%) differential count, the three automated analyzers showed different performances compared with manual counting (Table 2).
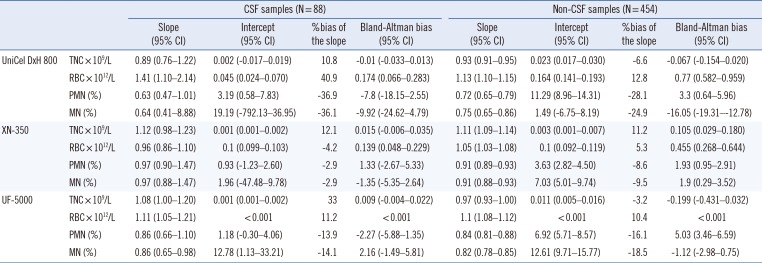
Table 2
Passing-Bablok regression and Bland-Altman analysis for TNC and RBC counts, PMN (%), and MN (%) in CSF (N=88) and non-CSF (N=454) samples compared with the manual method
![]()
Establishment of reflex analysis guidelines using the XN-350
In an additional retrospective study, the Sysmex XN-350 showed acceptable performances with manual counting in terms of PMN, MN, neutrophil, lymphocyte, and monocyte percentages (Table 3).
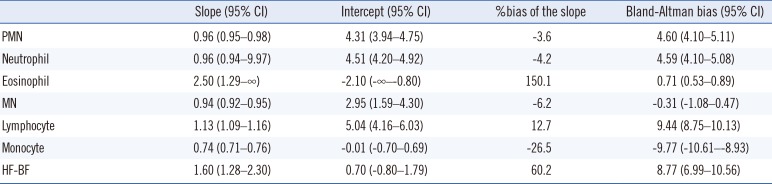
Table 3
Passing-Bablok regression and Bland-Altman analysis for differential cell counts using XN-350 compared with manual differential counting (N=803)
![]()
Although the slope was 2.50 (95% CI, 1.29–∞) for eosinophils and 1.60 (95% CI, 1.28–2.30) for HF-BFs, when we divided the samples according to whether the eosinophil (%) counted by the manual method was >or <10% (used as a cut-off point or an indicator of hypereosinophilia [25]), the XN-350 ROC curve showed an AUC of 0.98 (95% CI, 0.96–0.99). At an eosinophil cut-off of 3.8%, XN-350 showed 95.9% sensitivity (95% CI, 89.9–98.4%) and 92.5% specificity (95% CI, 90.9–93.8%) for hypereosinophilia (>10% eosinophils; Table 4) with 99.7% NPV (95% CI, 99.1–99.9%) and 50.0% PPV (95% CI, 45.0–55.0%).
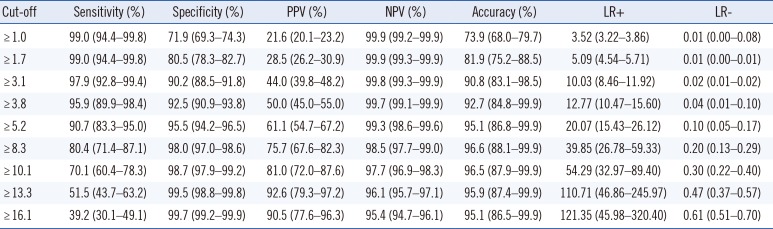
Table 4
Diagnostic performance of high eosinophil (>10%) using XN-350 at various eosinophil (%) cut-off values (mean and 95% confidence intervals)
![]()
Additionally, we compared the HF-BFs obtained by XN-350 according to the presence of malignant cells determined by cytology. The ROC curve of XN-350 showed an AUC of 0.63 (95% CI, 0.58–0.66; Fig. 1), a lower value than that of manual microscopy (0.76; 95% CI, 0.70–0.77; P<0.001). We also evaluated the diagnostic performance depending on various HF-BF cut-off values for detecting potential malignancy. Although the Youden index showed a maximum sensitivity and specificity of 67.0% (95% CI, 60.3–73.1%) and 52.7% (95% CI, 48.4–56.9%), respectively, at a cut-off point of 5.9 HF-BFs/100 WBCs, the accuracy was not sufficiently good (Table 5); therefore, lowered or elevated cut-off values may be useful to rule-out or rule-in purposes, respectively.
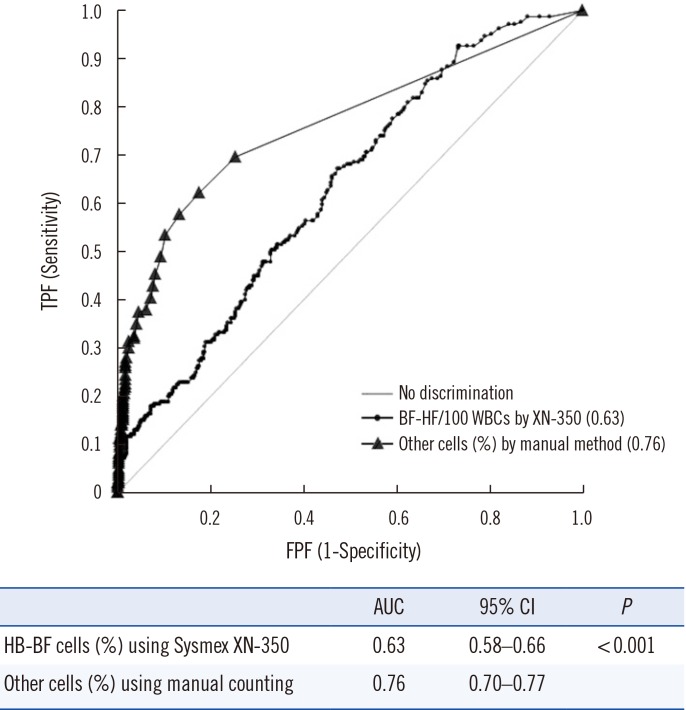
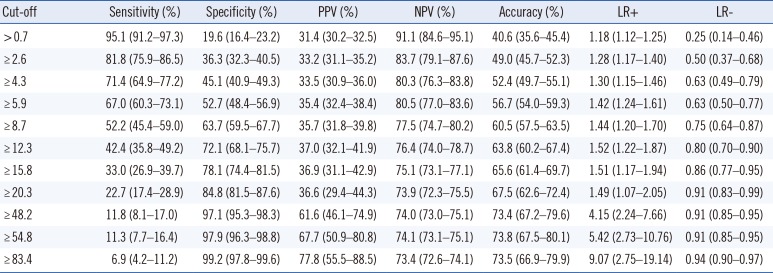
Fig. 1
ROC curve analysis of HF-BFs obtained using the Sysmex XN-350 and other cells obtained by manual counting compared with positive results (positive for malignancy and atypical cells) determined by cytology. Lining cells and monocytes/histiocytes were classified together as MNs. Macrophages, lining cells, such as mesothelial cells, atypical cells, and malignant cells were counted as “other cells.”
Abbreviations: HF-BFs, high fluorescence-body fluid cells; TPF, true positive fraction; FPF, false positive fraction; AUC, area under the curve; CI, confidence interval; MNs, mononuclear cells.
![]()
Table 5
Diagnostic performance according to various HF-BFs/100 WBCs cut-off values obtained using XN-350 for detection of potential malignancy (mean and 95% confidence intervals)
Abbreviations: see Table 4.
![]()
Based on these findings, we developed the reflex analysis guidelines for our laboratory. The HF-BF cut-off point with 95% sensitivity was set at 0.7 HF-BFs/100 WBCs with 91.1% NPV (95% CI, 84.6–95.1%) and the HF-BF cut-off point with 95% specificity was set at 83.4 HF-BFs/100 WBCs with 77.8% PPV (95% CI, 55.5–88.5%). As mentioned above, an eosinophil cut-off of 3.8% showed both high sensitivity and specificity. Based on these results, the following criteria were developed for establishing malignant cell positivity or the presence of significant eosinophilia (>10% eosinophils):
Rule 1 (HF-BFs <0.7/100 WBCs): the criterion for quick scans at 100× magnification microscopic examination as a rule-out cut-off without any confirmation from the clinical pathologist.
Rule 2 (HF-BFs >83.4/100 WBCs): the criterion for 1,000× magnification microscopic examination with mandatory clinical pathologist confirmation.
Rule 3 (Eosinophils >3.8%): the criterion for 1,000× magnification manual counting.
When the HF-BFs were between 0.7 and 83.4/100 WBCs, slide scanning at 1,000× magnification microscopic examination with clinical pathologist confirmation is indicated for cases of suspected malignant cells. The proportion of positive samples for each rule was as follows: 85.9% (N=690) for rule 1, 11.5% (N=92) for rule 2, 15.1% (N=121) for rule 3, 87.9% (N=706) for both rules 1 and 3, and 17.1% (N=137) for both rules 2 and 3.
DISCUSSION
We evaluated the analytical performance of three automated cellular analyzers: the Beckman Coulter UniCel DxH 800, the Sysmex XN-350, and the Sysmex UF-5000. These automated analyzers showed good within-device precision. The lower limit of analytical measurement range of the UniCel DxH 800 was relatively higher than that of the other two analyzers, but their linearity was satisfactory compared with the manufacturer-provided analytical measurement range. The UniCel DxH 800 showed relatively higher LoB and LoD values for TNC, at 0.012×10⁹/L and 0.018×10⁹/L, respectively; however, both were within the limit claimed by the manufacturer. The TNC LoQ values were comparable across instruments, at 0.037×10⁹/L for the UniCel DxH 800, 0.027×10⁹/L for the XN-350, and 0.025×10⁹/L for the UF-5000. These results were similar to previous findings [31118], and the LoQ has been reported to range from 0.010 to 0.030 TNCs×109/L [1]. As the LOQ was >0.024×10⁹/L using both XN-350 and UF-5000, we could not use these analyzers for screening TNC counts in CSF because the standard reference cut-off for CSF is 5/µL [1119].
The results of method comparisons for TNC and RBC counts were satisfactory in terms of the slopes of the Passing-Bablok equations, except for the RBC count in CSF samples using the UniCel DxH 800 (slope of 1.41 [95% CI, 1.10–2.14]). However, in cases of non-CSF samples, the UniCel DxH 800 showed satisfactory and similar results compared with the other analyzers. For PMN (%) and MN (%) differential counts, XN-350 showed the most comparable results to those of manual differential counting in both CSF and non-CSF samples; the UniCel DxH 800 and UF-5000 showed negative bias compared with manual counting (Table 2). Prior to the launch of a new automated BF analysis mode for the XN series or UF-5000, the UniCel DxH 800 BF analysis mode was used for samples with higher RBC or WBC counts to reduce the workload of manual counting in spite of its limitations. Beckman Coulter states that the background count for RBCs and TNCs is 0.001×10¹²/L and 0.020×10⁹/L, respectively; however, Sysmex states that the background count for RBCs and TNCs for the XN series is <0.001×10¹²/L and <0.001×10⁹/L, respectively. The higher sensitivity at low TNC and RBC concentrations may be due to differences in the measurement principles, the fluorescent flow cytometric method of Sysmex vs. Coulter VCS (volume, conductivity, and scattering of light) technology. Further multicenter studies are required to demonstrate more accurate and reliable comparison results. However, as the performance of the UniCel DxH 800 was also acceptable for the TNC and RBC counts in non-CSF samples and the TNC counts in CSF samples, clinical use of the UniCel DxH 800 is possible with acceptable performance.
Additional analyses using XN-350 also showed satisfactory results for neutrophils (%) and lymphocytes (%). The XN-350 monocyte (%) results were approximately 26.5% lower than the manual counting results; however, the MN (%) results showed good correlation with manual counting, with a Passing-Bablok equation slope of 0.94 (Table 3). The XN-350 eosinophil (%) and HF-BF results showed poor agreement and significant bias with manual counting. Therefore, we tried to establish a cut-off value for further microscopic review. An eosinophil (%) >10% of WBCs is a potential indicator of pulmonary embolism, pneumothorax, parasitic disease, and Churg-Strauss syndrome [25]. Thus, we considered 10% eosinophils obtained by manual counting as significant eosinophilia; an eosinophil cut-off point of 3.8% using XN-350 was determined as an acceptable criterion with 99.7% NPV and 50.0% PPV for further microscopic review (Table 4). Overestimation of eosinophils using XN-350 may be due to interference by eosinophilic granules or mistaking hypergranulated neutrophils as eosinophils. However, as few studies have examined this phenomenon, further studies are needed [5].
Additionally, we compared the HF-BFs, at the cut-off point of 5.9 HF-BFs/100 WBCs obtained using the Sysmex XN-350 according to the presence of malignant cells determined by the Youden index with maximum sensitivity and specificity (67.0% and 52.7%, respectively). This cut-off point was similar to the 6.9 HF-BFs/100 WBCs reported by Cho, et al. [8], but higher than the 2.1 HF-BFs/100 WBCs reported by Labaere, et al. [15]. Compared with these previous studies, the sensitivities and specificities at various cut-offs in the present study were lower, probably due to the use of different gold standards, sample variability, pre-analytical variables, inter-observer variability, or aggregation of malignant cells [115]. However, different cut-off values according to a specific purpose may be helpful. For example, 83.4 HF-BFs/100 WBCs or higher could be used as a rule-in cut-off, as the positive likelihood ratio (LR)(+) value is 9.07 (95% CI, 2.75–19.14) and 77.8% PPV (95% CI, 55.5–88.5%), while ≤0.7 HF-BFs/100 WBCs could be used as a rule-out cutoff, as the LR(−) value is 0.25 (95% CI, 0.14–0.46) (Table 5) and 91.1% NPV (95% CI, 84.6–95.1%). Results >83.4 HF-BFs/100 WBCs indicate the need for careful slide examination at 400× and/or 1,000× magnification, while results <0.7 HF-BFs/100 WBCs indicate that the slide can be examined at 100× or 200× magnification for a quick review.
The limitations of this study are that (1) the BF samples may have remained unattended for a considerable time at room temperature (22–27℃) at the collection site before transport to the central clinical laboratory. As we did not record the time between sample collection and receiving them in laboratory, we cannot guarantee that all samples were fresh; however, we analyzed the samples within two hours once they were received in the laboratory; (2) The gold standard was the cytological report rather than biopsy results because of the unavailability of biopsy samples in the pathological examinations; (3) Samples with high HF-BFs may be due to macrophage or mesothelial cells, as well as malignant cells. However, we did not distinguish malignant cells from other cell types in other cell categories; (4) Finally, the additional retrospective study using XN-350 showed that there were 1,015 CSF results of the 2,779 BF results; however, as most of them did not have corresponding BF cytology results, we obtained only two CSF results.
In conclusion, we evaluated the analytical performance of three automated cellular analyzers and compared them with manual counting. While recent automated analyzers have shown good agreement in terms of TNC and RBC counting, there are differences in differential counting. Because of poor correlation, especially for eosinophils and HF-BFs, the application of specific reflex analysis guidelines is recommended for clinical laboratories, and manual confirmation is warranted to ensure accuracy compared with morphological and clinical aspects.
 XML Download