

 PDF
PDF Citation
 Print
Print


Abbreviations
DALYs
disability-adjusted life years
KoNEHS
Korean National Environmental Health Survey
BMI
Body mass index
PAH
polycyclic aromatic hydrocarbon
VOC
volatile organic compound
RV 95
95 percentile reference value
OR
odds ratio
ETS
environmental tobacco smoke
CI
confidence interval
SHS
secondhand smoke
BHg
blood mercury
BPb
blood lead
UHg
urinary mercury
UCd
urinary cadmium
MEHHP
mono-(2-ethyl-5-hydroxyhexyl) phthalate
MEOHP
mono-(2-ethyl-5-oxohexyl) phthalate
MECCP
mono-(2-ethyl-5-carboxypentyl) phthalate
MnBP
mono-n-butyl phthalate
MBzp
mono-benzyl phthalate
Triclosan
2,4,4-trichloro-2-hydroxyphenyl ether
BACKGROUND
Worldwide, 33% of male non-smokers and 35% of female non-smokers are exposed to secondhand smoke (SHS). SHS is associated with death from ischemic heart disease, lower respiratory tract infection, asthma, and lung cancer [1]. Annually, about 600,000 deaths are related to SHS and 10.9 million disability-adjusted life-years (DALYs) are lost, which is about 1.0% of the worldwide mortality and 0.7% of the total worldwide burden of diseases in DALYs [1]. In Korea, about 36% of non-smokers and 50% of current smokers are exposed to SHS. Men tend to be exposed mainly in the workplace and women mainly in the home by family members [2].
Tobacco contains more than 4,000 chemical compounds, most of which are harmful to humans [3]. Tobacco smoke consists of mainstream and sidestream smoke. Mainstream smoke refers to the smoke that emerges from the mouth during puffing, while sidestream smoke is the smoke emerging from the end of the burning cigarette. About 85% of SHS is sidestream smoke [4]. Sidestream smoke occurs at a lower combustion temperature and its particulate size is smaller than that of mainstream smoke [5]. Thus, particles from sidestream smoke can reach deeper portions of the lung than those of mainstream smoke [5]. Sidestream smoke was about four times more toxic than the same amount of mainstream smoke when inhaled and about 2–6 times more carcinogenic in skin tests [4].
Since the 1920s, the health effects of SHS have been widely known and a number of studies have been performed. But, compared to health effects associated with SHS, with a great deal of accumulated research, a little research has been performed regarding the relationship between SHS and exposure to chemical substances. Also, most of the studies for SHS and harmful substances were about measurement of indoor air quality. The health effects of SHS closely related to harmful substances contained in tobacco; therefore, to precisely understand the health effects of SHS, it is necessary to identify the level of chemical substances in the bodies of individuals who are exposed to SHS. So, this study analyzed the relationship between SHS and biomonitoring results of harmful substances and assessed the relationship according to sex.
METHODS
Study participants
This study was based on data from the second Korean National Environmental Health Survey (KoNEHS). This KoNEHS was conducted by the National Institute of Environmental Research and included participants aged 19 years and above from 2012 to 2014. It consists of 142 surveys related to environmental exposure, 19 clinical examinations, and the concentrations of 21 kinds of harmful substances. The study participants were first stratified into regional administrative districts and coastal strata using the 2010 Population and Housing Census, and next classified based on socioeconomic level, proportion living in apartments, and those with agricultural occupations. The 42 districts within the heavy metal monitoring networks were added to 358 general survey areas for a final total of 400 selected districts. The distribution of samples used the square root method to prevent the population from being excessively allocated from densely-populated areas [6].
This study included 4,259 non-smokers from among 6,478 adults aged above 19 years of age. For accurate analysis of urine samples, outliers (n = 726) with urine creatinine concentrations outside of the range of 0.3–3.0 g/L were excluded. Finally, 3,533 people were included in the study.
Variables
Exposure to SHS was based on a self-reported questionnaire. The group who never exposed to SHS was set as the control group and the group who exposed more than once a week was set as the exposed group. Age, residential area, body mass index (BMI), education level, marital status, economic level, drinking, and exercise were included as covariates. Residential area was classified as urban, rural, coastal, and heavy metal monitoring areas. BMI was classified as underweight (under 18.5 kg/m2), normal, and over weight (over 25 kg/m2). Economic level was classified according to self-reported survey response which was categorized as upper, middle upper, middle lower, and lower. Marital status was classified as single or married. Single included those who were unmarried, divorced, bereaved, and separated. Drinking was classified as non-, light, and heavy. Non-drinkers were those who answered ‘not drinking at all’ or ‘drink in the past but not now,’ while heavy drinker were those who reported drinking more than three times per week and more than five glasses at one time. All others were categorized as light drinkers. The standard for ‘doing exercise’ was more than 3 times a week for more than 20 minutes at a time with enough exertion to sweat.
Harmful substance
Among 21 substances included in the 2nd KoNEHS data, phthalates metabolites and 3-phenoxybenzoic acid were excluded after reviewing previous studies. Finally, a total of 16 harmful substances related to tobacco smoke were analyzed. The analyzed heavy metals included urine mercury, cadmium, blood lead, and mercury. Five types of polycyclic aromatic hydrocarbon (PAH) metabolites were analyzed, including toluene, benzene, xylene, and styrene. The volatile organic compounds (VOCs) included 2-naphthol, 2-hydroxyfluorene, 1-hydroxyphenanthrene, and 1-hydroxypyrene, which are metabolites of phenanthrene and pyrene, naphthalene, and fluorene. Thus, a total of 16 substances were analyzed, including cotinine, as environmental tobacco smoke metabolites, and bisphenol A and triclosan, which are environmental phenols. Lead and mercury were analyzed from blood samples; the rest were analyzed from urine samples. All value below the detection limit were divided by the square root of 2 and missing values were excluded. All urine analytes were adjusted to the urine creatinine concentrations.
Statistical analysis
The study subjects were divided into 2 groups according to exposure to SHS. We compared the demographic characteristics between the exposed and non-exposed groups by χ2 tests and showed the prevalence of SHS for each subgroup according to sex. Most of bio-monitoring data is positively skewed and mean value can be affected by some extreme values. So, we compared the proportion that exposed to high levels of each harmful substance according to SHS. The 95 percentile reference value (RV 95) was used as cut-off value [7]. The χ2 tests were used to compare the proportion exceeding RV 95 between the two groups. For 16 substances, the adjusted odds ratios (ORs) exceeding the 95 percentile of each harmful substance were calculated for SHS exposure group in both model 1 and 2. Age, education level, marital status, BMI, drinking, and exercise were adjusted in model 1. For model 2, cotinine level was additionally adjusted as covariate. Since cotinine is an objective indicator of SHS exposure, we compared the ORs of model 1 with model 2 to assure that the result was from SHS. Sex was adjusted for total subjects. Dietary factors were included as covariates for specific substances. Fish intake was adjusted for blood and urine mercury [8]. For fish intake, we referred to the questionnaire about the consumption frequency of large fish, tuna, and fish. For cadmium, shellfish, grain, vegetable intake were adjusted [9]. Roasted meat and fish intake was adjusted for VOCs and PAHs [10].
RESULTS
Table 1 shows the demographic characteristics and prevalence of SHS of the study participants. There were significant differences in terms of age, education level, marital status, drinking status, and exercise between exposed and non-exposed groups. In the exposed group, the proportion of subjects in their 20s, 30s, and 40s were relatively high among all age groups; thus, the average age was lower in the exposed group. A greater percentage of people in the exposed group were college and high school graduates and more people in the exposed group were single. The exposed group tended to drink more alcohol and exercise more than the non-exposed group, indicating that lifestyles related to drinking and exercise were not good in the exposure group. There were no significant differences in residential area, BMI, and economic level between the 2 groups. The prevalence of SHS was higher in male (30.6%) than female (18.3%). In male, prevalence of SHS was high in 20s and 30s. In female, greater percentage of people in 40s and 50s was exposed to SHS. According to marital status, the proportion of people who were exposed to SHS was higher in single people than married. Also, SHS was associated with lifestyle such as drinking and exercise. The prevalence of SHS was higher in people who do not exercise and drink more alcohol.
Table 1
General characteristics of the study subjects associated with SHS and prevalence of SHS according to sex (n = 3,533)
Values are presented as number of participants (%).
BMI: body mass index; SHS: secondhand smoke.
aThe percentage showed the distribution of study subjects by general characteristics. bThe prevalence of SHS showed the proportion of people exposed to SHS for each study subgroup. cStatistical significance was considered as a p-value < 0.05.
![]()
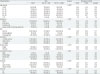
Table 2 shows the proportion exceeding 95 percentile of the concentration of harmful substances according to SHS and sex. The proportion exposed to high levels of blood mercury was higher in total and female exposure groups than in the non-exposed groups. Among the VOC metabolites, proportion exposed to high levels of the methylhippuric acid was significantly higher in the total and female exposure group. The proportion exposed to high levels of cotinine, an environmental tobacco smoke (ETS) metabolite, was significantly higher in the exposure groups of both sexes. The proportion exposed to high levels of of 2-hydroxyfluorene, a metabolite of fluorene, was high in exposure group but bisphenol A and triclosan, which are environmental phenols showed not significantly differences by sex.
Table 2
Proportion of exceeding 95 percentile of environmental harmful substances according to SHS exposure

SHS: secondhand smoke; BHg: blood mercury; BPb: blood lead; UHg: urinary mercury; UCd: urinary cadmium; VOC: volatile organic compound; ETS: environmental tobacco smoke; PAH: polycyclic aromatic hydrocarbon; Triclosan: 2,4,4-trichloro-2-hydroxyphenyl ether.
![]()
In Table 3, the adjusted ORs of exposure to high levels of hazardous substances were calculated according to SHS exposure in model 1 and 2. We used 95% reference value as a cutoff point for exposure to high level. In model 1, for the male exposure group, the adjusted OR of exposure to high blood mercury and cotinine levels was 2.35 (95% confidence interval [CI]: 1.00–5.52) and 2.17 (95% CI: 1.01–4.68). For the female exposure group, the ORs of exposure to high levels of blood mercury, methylhippuric acid and hydroxyfluorene were 2.12 (95% CI: 1.42–3.16), 1.56 (95% CI: 1.04–2.33) and 1.76 (95% CI: 1.18–2.61), respectively. In model 2, adjusting cotinine levels as covariate, the adjusted ORs of exposure to high blood mercury levels was 2.43 (95% CI: 1.03–5.75) for men. For women, the adjusted ORs of exposure to high levels of blood mercury, methylhippuric acid and hydroxyfluorene were 2.06 (95% CI: 1.37–3.09), 1.24 (95% CI: 0.81–1.91) and 1.24 (95% CI 0.79–1.96), respectively.
Table 3
Adjusted ORs exceeding 95 percentile of harmful substances were calculated for SHS exposure group compared to control group

OR: odds ratio; SHS: secondhand smoke; BMI: body mass index; BHg: blood mercury; BPb: blood lead; UHg: urinary mercury; UCd: urinary cadmium; VOC: volatile organic compound; ETS: environmental tobacco smoke; PAH: polycyclic aromatic hydrocarbon; Triclosan: 2,4,4-trichloro-2-hydroxyphenyl ether.
aAge, residential area, BMI, education level, marital status, economic level, drinking, and exercise were adjusted in model 1. bCotinine concentration was additionally adjusted in model 2. cSex was additionally adjusted for total comparison. dBig fish/tuna and fish intake was additionally adjusted for BHg and UHg. eShellfish, vegetables, and grain intake was additionally adjusted for UCd. fRoasted meat and fish consumption was additionally adjusted for VOCs and PAHs.
![]()
DISCUSSION
This study compared the concentrations of harmful substances in the body according to exposure to SHS and sex. About 18.3% of female non-smokers and 30.6% of male smokers reported exposure to SHS.
The proportion that exposed to high levels of cotinine was higher in the exposed group than that in the non-exposed group. Cotinine is a metabolite of nicotine, a biomarker with high sensitivity and specificity for exposure to tobacco and SHS[11]. Cotinine concentration in body fluids was related to the frequency of self-reported exposure to SHS and cotinine concentration tended to increase with more smokers in the home [1213]. In this study, similar to previous studies, self-reported exposure to SHS was associated with the proportion exposed to high levels of cotinine. Cotinine concentration represents the quantitative exposure to SHS during a short period of time [14]; thus, this result means that self-reported questionnaire about SHS is significantly associated with actual exposure.
The proportion exposed to high levels of blood mercury was greater in both total and female exposed group, but adjusted ORs were consistently significantly in model 2. Since cotinine concentration is an objective indicator of SHS, it can be assumed that there might be other factor if the OR is consistently significant after adjusting. There are controversial studies on the relationship between tobacco smoke and mercury exposure. Mortada et al. [15] reported no significant differences in blood, urine, and hair mercury concentrations between smokers and non-smokers. Richter et al. [16] showed that urine mercury levels in smokers were statistically lower than those in non-smokers, suggesting that smoking is not a major cause of mercury exposure. In contrast, a study on the relationship between mercury concentration in hair and blood pressure in smokers showed that smokers have a significantly higher hair mercury concentration than non-smokers [17]. Ho et al. [18] also showed that smokers had significantly higher blood levels of mercury than non-smokers. One cigarette contains 2.95–10.2 ng of mercury and most of the mercury contained in tobacco is released in smoke [19]. While it is clear that SHS exposure can result in exposure to the vapor form of mercury, few studies have assessed this relationship. In this study, the proportion exposed to high levels of mercury was higher in the total and female exposed group, but adjusted ORs in Table 3 showed similarly significant results in model 2. It means that although major factors like fish consumption was adjusted in our study, there can be still other covariate factors that affect the concentrations of mercury like occupational and environmental exposure, etc.
Muconic acid is a metabolite of benzene and trans-trans muconic acid in the urine is used as a biomarker for benzene exposure [20]. Benzene is a leukemogen, and tobacco smoke is one of the major exposure sources of benzene [212223]. The body burden of benzene in smokers is 6–10 times greater than that of nonsmokers and about 50% of benzene exposure in the United States is due to tobacco smoke [24]. The relationship between benzene and SHS has also been evaluated by a number of studies, most of which used indoor air measurements. Wallace et al. [21] reported that the concentration of benzene in homes with smokers was high, especially in autumn and winter months, and that the concentration of benzene in the breath increased when subjects were exposed to SHS during more than 50% of their office time [22]. In this study, the proportion exposed to high levels of muconic acid and adjusted OR did not show statistically significant results. Few studies have been conducted about the relationship between benzene and SHS, especially for biomonitoring results. Since the effects of SHS is much weaker than active smoke and the exposure assessment in this study was done by self-reported questionnaire, further study should be conducted for the people who exposed to SHS heavily and frequently.
The proportion that exposed to high levels of methylhippuric acid, a metabolite of xylene, showed significant differences between exposure and control groups in Table 2. Table 3 showed high OR in female exposure group in model 1, and after adjusting cotinine level, adjusted OR did not show statistically significant result. Xylene is also known to be associated with tobacco in previous studies [8]. In our study, both model 1 and model 2 showed similar tendency, xylene is likely to be associated with SHS exposure.
The metabolites of PAHs were measured for 1-hydroxypyrene, 2-hydroxyfluorene, 1-hydroxyphenanthrene, and 2-naphthol. Fluorene is relatively selective material in tobacco smoke compared to other PAHs [25]. Urine 2-hydroxyfluorene is a metabolite of fluorene, which is associated with exposure to the vapor form of cigarette smoke [26]. The concentrations of 2-hydroxyfluorene tend to be high in smokers [27]. In this study, the proportion exposed to high levels of the urinary fluorene was high in the total and female exposure group. Table 3 showed high ORs in model 1, but not in model 2. Hydroxyfluorene is known to be highly correlated with nicotine intake [25]; therefore, this could be associated with the higher ORs in our study's result.
On the other hand, the metabolites of PAHs, naphthol and hydroxyphenanthrene and urinary cadmium showed lower ORs in exposure group for male subjects, which did not show statistically significant result for total and female subjects. Compared to female, SHS in males is closely related to occupational factors [2]. Especially, since the PAHs are substance that occurs in the process of incomplete combustion, it is possible that this result comes from occupational differences between the exposure and control groups. Further studies are suggested to consider these occupational factors to obtain more accurate results in the male subjects.
The limitations of this study are as follows. First, it is difficult to objectively evaluate the amount of exposure based on responses to a questionnaire. SHS can be influenced by many factors, including the time and frequency of exposure, ventilation status, etc. Therefore, a more detailed questionnaire is needed, including the exposure time, route, and smoking history of family members, for accurate assessment. In addition, indicators or biomarkers need to be developed to objectively evaluate the exposure level to SHS. Finally, the second KoNEHS used in this research is a cross-sectional study; thus, it is difficult to determine time-based causality.
Despite these limitations, the strengths of this study are as follows: the KoNEHS is a national survey of large-scaled populations and provides useful data to assess the level of human exposure to various environmental harmful factors related to personal lifestyle. There are few Korean studies on the relationship between SHS and environmental harmful substances; thus, one strength is our comparison of exposure to environmental harmful substances in a large-scale population according to SHS and sex.
The health effects caused by SHS are clearly related to internal exposure of these harmful substances. Biological monitoring is an important tool for assessing the level of internal exposure to harmful substances taken up from environmental exposures. Therefore, to understand the health effects of SHS precisely, it is necessary to analysis the relationship between SHS and biological monitoring results of harmful substances. Future studies are needed to more accurately analyze factors such as exposure frequency, time, and pathway of SHS.
CONCLUSIONS
This study compared the proportion that exposure high levels of 16 substances related to tobacco according to SHS. In women, SHS was associated with methylhippuric acid, fluorene, and cotinine, while in men, it was associated with cotinine. After adjusting covariant factors, ORs of blood mercury, methylhippuric acid and hydroxyfluorene was greater than that in the non-exposed group. Especially, methylhippuric acid and hydroxyfluorene showed consistent result in female subjects, which means that these materials are likely to be associated with SHS. These results indicate that some of the harmful substances related to tobacco smoke are also present in SHS. The health effects caused by SHS are clearly related to these harmful substances. Future studies are necessary to more accurately analyze factors such as exposure frequency, time, and pathway of SHS.
 XML Download