

 PDF
PDF ePub
ePub Citation
 Print
Print


INTRODUCTION
Vitamin D, the active form of which is calcitriol (1,25[OH]2D3), is an anti-inflammatory agent that mitigates inflammatory diseases such as inflammatory bowel disease, rheumatoid arthritis, systemic lupus erythematosus, multiple sclerosis, atherosclerosis, and asthma [12]. Vitamin D is also associated with maintaining periodontal health [13]. Low serum vitamin D levels are associated with an increase in gingival inflammation [4]. An inverse relationship exists between periodontal attachment loss and serum vitamin D levels, irrespective of smoking or diabetes [5]. Daily intake of more than 800 IU of vitamin D was found to be associated with lower pocket depth, attachment loss, and alveolar bone loss compared to daily intake of less than 400 IU in older men [1]. Gingival scores were reduced in a dose-dependent manner according to increasing amounts of daily vitamin D intake for 3 months [6].
However, despite the anti-inflammatory potential of vitamin D in periodontal health, studies on the mechanisms associated with the anti-inflammatory effects of vitamin D in periodontal health are limited. Vitamin D has been reported to enhance the production of anti-microbial peptides in gingival epithelial cells that encounter bacteria invading the gingiva [78] and to regulate the production of pro-inflammatory cytokines by gingival epithelial cells and periodontal ligament cells infected with oral bacteria [78]. In this study, we studied the effect of vitamin D on the development of intercellular junctions, which are the first line of defense as an epithelial barrier against attack by microorganisms [9]. Maintaining intact intercellular junctions in the epithelium is imperative because they may impede the invasion of microorganisms or toxins through the epithelial barrier [10]. In particular, slight dissociation of the intercellular junction in the junctional epithelium (JE), where intercellular junctions are characteristically sporadic and loose, may cause the epithelial barrier of the JE to deteriorate [11]. Breakdown of intercellular junctions in the JE may promote pathologic desquamation of the keratinocytes facing the gingival sulcus in the upper JE and deepen the gingival sulcus at the initial stages of inflammation [12]. In addition, this breakdown may be associated with denudation of the narrow pocket epithelium, exposing the connective tissue under the pocket epithelium at the later stage of inflammation [12]. E-cadherin is critical for maintaining the structural integrity of the oral epithelium, including the JE [913]. In the present study, we evaluated E-cadherin intercellular junctions as the target of tumor necrosis factor-alpha (TNF-α) because E-cadherin forms the major intercellular junctions of the JE [13]. Furthermore, E-cadherin is regarded as a key molecule in the development of desmosomes, as well as adherens junctions [14]. Expression of E-cadherin is mostly reduced in the inflammatory JE [1115] and dissociation of E-cadherin increases the permeability of the intercellular junctions in HGKs [16].
Herein, the effect of vitamin D on the disruption of E-cadherin junctions (ECJs), which are associated with the epithelial barrier, was explored in gingival epithelial cells that were challenged by the pro-inflammatory cytokine TNF-α. It is well-known that TNF-α hampers the epithelial barrier in gingival keratinocytes [1617]. TNF-α is produced at high levels by gingival epithelial cells infected with oral bacteria such as Porphyromonas gingivalis [7]. Gingival keratinocytes that secrete TNF-α might affect themselves in an autocrine fashion. In particular, gingival keratinocytes in the JE, where the intercellular space is wide enough [11] to accommodate macromolecules due to the incomplete intercellular junctions, may be directly confronted by self-secreted TNF-α. TNF-α may be derived from inflammatory cells in the connective tissue in the later stages of gingival or periodontal inflammation.
This study was performed to determine whether TNF-α dissociated the ECJs of human gingival keratinocytes (HGKs) via upregulation of matrix metalloproteinase-9 (MMP-9) production by HGKs and whether vitamin D reduced the breakdown of the E-cadherin intercellular junctions of HGKs by downregulating the production of MMP-9 by HGKs.
MATERIALS and METHODS
HGK cultures
The HOK-16B cell line, which was immortalized from human retromolar healthy gingival tissues, was used in this study [18]. The HOK-16B cell line was a gift from Dr. N. H. Park (School of Dentistry, University of California, Los Angeles, CA, USA). The HGKs (HOK-16B cells) were cultured in supplemented keratinocyte growth medium (Lonza, Basel, Switzerland) in 5% CO2 at 37°C. The medium supplement contained bovine pituitary extract, recombinant human insulin, hydrocortisone, recombinant human epidermal growth factor, gentamicin sulfate-amphotericin (GA-1000), and 1% penicillin. The following reagents were used in the culture of HOK-16B cells; rh-MMP-9 (MMP-9) from Sino Biological (Wayne, PA, USA), rh-tissue inhibitor of metalloproteinase-1 (TIMP-1) from Calbiochem (San Diego, CA, USA), rh-TNF-α from Peprotech (Rocky Hill, NJ, USA), and 1α,25-dihyhroxyvitamin D3 (vitamin D) and Bay 11-7082 (a pharmacological inhibitor of NF-κB signaling) from Sigma-Aldrich (St. Louis, MO, USA). The MMP-9 specific inhibitor was purchased from Abcam (Cambridge, UK). Treatment doses and times are shown in the figure legends.
Immunoblotting
Immunoblotting was performed according to a standard protocol. Briefly, the cells were lysed with a RIPA lysis buffer (150 mM NaCl, 0.5% deoxycholic acid, 50 mM Tris-HCl [pH 7.5], 1% NP-40, and 0.1% sodium dodecyl sulphate [SDS]) containing a protease inhibitor mixture comprising 1 mM Na3VO4, 10 mM NaF, and 1 mM PMSF protease inhibitor (Boehringer Mannheim, Indianapolis, IN, USA). Cell lysates that were boiled in sample buffer were run through SDS-polyacrylamide gel electrophoresis (PAGE) and transferred to polyvinylidene difluoride membranes. Nonspecific reactions of the membranes were blocked with 5% skim milk, followed by incubation with primary antibodies overnight at 4°C. Antibodies for glyceraldehyde 3-phosphate dehydrogenase (GAPDH), NF-κB p65, p-NF-κB p65, and E-cadherin were purchased from Cell Signaling Technology (Danvers, MA, USA). The incubated membranes were reacted with secondary antibodies in 5% skim milk at room temperature for 1 hour. Horseradish peroxidase (HRP)-linked immunoglobulin G (IgG) for various animals was purchased from Cell Signaling Technology. The blots were developed using an enhanced chemiluminescent HRP substrate (Thermo-Fisher Scientific/Invitrogen, Waltham, MA, USA).
Antibody microarray analysis of MMPs
Antibody microarray analysis of MMPs was conducted following the manufacturer's instructions. Briefly, antibody microarray chips for the analysis of MMPs (Abcam) were blocked with blocking buffer for 30 minutes. Then, the chips were incubated in conditioned media at 4°C overnight. Thoroughly washed incubated chips were reacted with biotin-conjugated detector antibody cocktail for 2 hours. The chips were next incubated with HRP-conjugated streptavidin for 2 hours. Then, the reaction products were visualized by reacting HRP with a chemiluminescent substrate. The relative amount of MMP-9 was compared based on the intensity of MMP-9 bands obtained using ImageJ (National Institutes of Health, Bethesda, MD, USA). Specifically, the amount of MMP-9 was calculated by dividing the intensity of MMP-9 by the average intensity of 3 positive control references included in each blot as an internal control.
Zymogram analysis
Proteins in the conditioned medium were separated by SDS-PAGE using 7.5% acrylamide gel containing gelatin (4 mg/mL). The zymogram buffer kit was purchased from Koma Biotech (Seoul, Korea). After washing the gel to remove SDS with zymogram renaturing buffer, the gel was incubated to induce an enzyme-substrate reaction in the zymogram development buffer at 37°C for 48 hours. Then, the incubated gel was stained with Coomassie brilliant blue G-250 (Bio-Rad, Hercules, CA, USA) to stain the unreacted gelatin. The relative activity of MMP-9 was compared based on the intensity of the MMP-9 bands obtained using ImageJ.
Immunocytochemistry and measurement of ECJs
Immunocytochemical staining followed a standard protocol. Briefly, cells were fixed with 4% paraformaldehyde for 10 minutes and permeabilized with 0.2% Triton X-100 for 30 minutes. The permeabilized cells were incubated with primary antibodies for 2 hours at room temperature. E-cadherin was obtained from Cell Signal Technology as a primary antibody. Then, cells were treated with Cy3-conjugated anti-rabbit IgG antibody (Jackson ImmunoResearch Lab, West Grove, PA, USA) for 1 hour. F-actin and nuclei were stained with FITC-phalloidin (Sigma-Aldrich) or 4′,6-diamidino-2-phenylindole dihydrochloride (DAPI) (Sigma-Aldrich), respectively. The stained cells were photographed with serial Z-sections using an LSM 700 confocal laser-scanning microscope (Zeiss, Oberkochen, Germany). In addition, images of the expression of E-cadherin and F-actin were merged to examine the colocalization of E-cadherin and F-actin. Dissociation of the ECJs began with separation of the E-cadherin band from the F-actin band. Thus, whether E-cadherin and F-actin were colocalized in the merged images of both E-cadherin and F-actin served as a quick reference to discern the dissociation of ECJs. The development of intercellular junctions in HGKs was evaluated by measuring the length of ECJs that developed around the perimeter of the cells. The extent of ECJ development was designated by averaging the relative development of ECJs from 20–30 cells that were randomly chosen from multiple experiments [19]. The relative extent of ECJ development per cell was obtained by dividing the length of the E-cadherin expressed at the cell junctions by the total perimeter of the cell; these values were obtained by tracing using ImageJ.
Immunohistochemistry of vitamin D receptor (VDR)
Immunohistochemical analysis involving animals followed protocols approved by the Institutional Animal Care and Use Committee of Seoul National University (SNU-180207-3). Six-week-old Sprague Dawley rats were sacrificed by CO2 asphyxiation. Mandibular molars, including the surrounding tissues, were fixed in 4% paraformaldehyde in phosphate buffer (pH 7.4) at 4°C overnight. Decalcified tissues in a solution of 10% ethylenediaminetetraacetic acid (pH 7.4) were embedded in paraffin, and then processed for the immunohistochemical examinations. The deparaffinized sections were treated to retrieve antigens in a solution of citrate buffer (pH 6.0) at 60°C overnight. Expression of VDR was detected using an ABC kit (Vector Labs, Burlingame, CA, USA) and a DAB kit containing nickel chloride to enhance the contrast of the immunoreactivity (Vector Labs) after treating tissues with rabbit anti-VDR (1:50, Santa Cruz, Santa Cruz, CA, USA) as the primary antibody and a biotin-labeled goat anti-mouse IgG (1:200, Vector Labs) as the secondary antibody. The negative control slides were treated similarly, except that the reaction with the primary antibody was omitted.
Statistical analysis
All data on the relative extent of ECJ development per cell are presented as the mean±standard deviation of the mean. Statistical analyses for the comparison of the means were performed using MedCalc for Windows (version 18.11, MedCalc software, Ostend, Belgium). After normality analysis by the Kolmogorov-Smirnov test, depending on the normality of the data distribution, the nonparametric Kruskal-Wallis test and post hoc multiple comparison with the Dunn test or parametric 1-way analysis of variance and post hoc multiple comparison with the Tukey-Kramer test was performed. The significance level was set as P<0.05. The results of non-quantitative immunoblotting analyses, microarray analyses, zymogram analyses, and immunohistochemical observations are presented as a representative example of the 2 or 3 experiments, respectively, all of which showed consistent results from independent cultures.
RESULTS
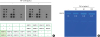
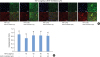
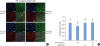
ECJs were downregulated when the HGK cells were treated with TNF-α (Figure 1). Interestingly, the preformed ECJs were dissociated by treatment with TNF-α. The effects of vitamin D on the development of E-cadherin were examined to determine whether vitamin D averted the attenuated development of the ECJs in the HGKs in response to TNF-α. As expected, vitamin D nullified the deteriorating effect of TNF-α on the development of ECJs of gingival epithelial cells (Figure 2).
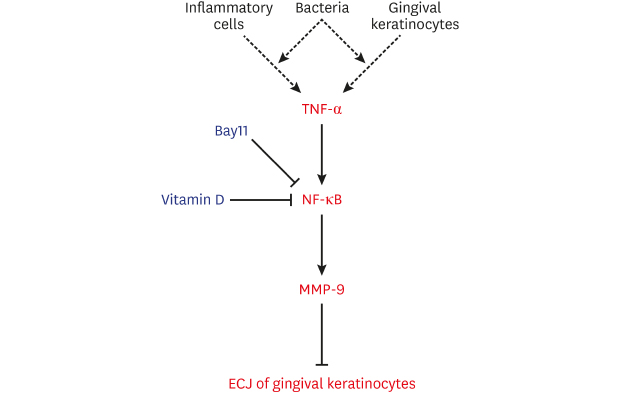
 | Figure 1TNF-α suppresses the development of ECJs in HGKs in vitro. Cells were cultured for 24 hours for the establishment of the ECJs and then treated with various amounts of TNF-α (10, 40, 100 ng/mL). (A) ECJ development was detected by immunocytochemical staining of E-cadherin expression (red). In addition, F-actin (green) was stained with FITC-phalloidin and nuclei were stained with DAPI (blue). The lower right pictures in each set of pictures are the merged images of the E-cadherin, F-actin, and nuclei images.(B) The average ratio of the development of ECJs per cell was calculated.TNF-α: tumor necrosis factor-alpha, ECJ: E-cadherin junction, HGK: human gingival keratinocyte, DAPI: 4′,6-diamidino-2-phenylindole dihydrochloride.
a)P<0.05 versus b)Nonparametric Kruskal-Wallis test and post hoc multiple comparison with the Dunn test.
|
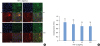
 | Figure 2Vitamin D suppresses the dissociation of the ECJs induced by TNF-α in HGKs in vitro. Cells were cultured for 24 hours for the establishment of ECJs and pretreated with vitamin D (10, 100 nM) or without it for an additional 24 hours. Then, cells were cultured with or without TNF-α for 24 hours along with vitamin D. (A) ECJ development was detected by immunocytochemical staining of E-cadherin expression (red). In addition, F-actin (green) was stained with FITC-phalloidin and nuclei were stained with DAPI (blue). The lower right pictures in each set of pictures are the merged images of the E-cadherin, F-actin, and nuclei images. (B) The average ratio of the development of ECJs per cell was calculated.ECJ: E-cadherin junction, TNF-α: tumor necrosis factor-alpha, HGK: human gingival keratinocyte, DAPI: 4′,6-diamidino-2-phenylindole dihydrochloride.
a)P<0.05 versus b)Nonparametric Kruskal-Wallis test and post hoc multiple comparison with the Dunn test.
|
Disruption of ECJs by MMP-9
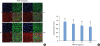
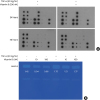
To find a candidate molecule that may mediate the vitamin D-induced strengthening of the intercellular junctions of the gingival keratinocytes in the inflammatory setting, HOK-16B cells were treated with TIMP-1. This was performed to examine whether MMPs were involved in the breakdown of the intercellular junction by TNF-α as MMPs have been reported to destroy various epithelial intercellular junctions, including ECJs [2021222324]. As expected, TIMP-1 reversed the destruction of ECJs by TNF-α (Figure 3). Next, the type of MMPs mediating the destruction of ECJs by TNF-α was explored through antibody microarray analysis of the conditioned culture medium. An antibody microarray analysis of MMPs showed that the secretion of MMP-9, not MMP-1, 2, 3, 8, 9, 10, or 13, was upregulated in the culture medium by TNF-α (Figure 4A). The upregulation of MMP-9 by TNF-α was further confirmed by gelatin zymogram analysis. TNF-α upregulated the activity of MMP-9 in the culture medium in a dose-dependent manner in the zymogram analysis (Figure 4B). In addition, treatment of the cells with a specific inhibitor for MMP-9 maintained the development of ECJs at the rate of the control despite treating cells with TNF-α (Figure 5). Next, since dissociation of ECJs by MMP-9 has not been reported in oral keratinocytes, including gingival keratinocytes, except for a few cases involving cancer cells, the direct effect of exogenous MMP-9 on the downregulation of ECJs was examined. MMP-9 directly reduced the development of ECJs (Figure 6). These results suggest that MMP-9 may be involved in the break-up of the epithelial barrier by TNF-α in gingival epithelial cells.
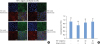
 | Figure 3TIMP-1 suppresses the dissociation of ECJs induced by TNF-α in HGKs in vitro. Cells were cultured for 24 hours for the establishment of the ECJs and then treated with TNF-α (40 ng/mL), with or without TIMP-1 (20 ng/mL) for an additional 24 hours. (A) ECJ development was followed by immunocytochemical staining of E-cadherin expression (red). In addition, F-actin (green) was stained with FITC-phalloidin and nuclei were stained with DAPI (blue). The lower right pictures in each set of pictures are the merged images of the E-cadherin, F-actin, and nuclei images. (B) The average ratio of the development of ECJs per cell was calculated by taking the mean of the values that were obtained by dividing the length of the E-cadherin expressed at cell junctions by the total perimeter of each cell.TIMP-1: tissue inhibitor of metalloproteinase-1, ECJ: E-cadherin junction, TNF-α: tumor necrosis factor-alpha, HGK: human gingival keratinocyte, DAPI: 4′,6-diamidino-2-phenylindole dihydrochloride.
a)P<0.05 versus b)Nonparametric Kruskal-Wallis test and post hoc multiple comparison with the Dunn test.
|
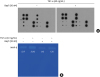
 | Figure 4TNF-α upregulates the secretion of MMP-9, as shown by antibody microarray analysis, and gelatinolytic digestion by the secreted MMP-9, as demonstrated by gelatin zymography in HGKs in vitro, respectively. (A) Cells were cultured for 24 hours for the establishment of the ECJs and then treated with TNF-α (40 ng/mL). Antibody microarray analysis of MMPs was performed by applying conditioned culture medium to the antibody microarray chip for MMPs. The table contains a list of the MMPs or TIMPs in the array. The numbers under the MMP-9 blots indicate the intensity of MMP-9 standardized using the positive controls as references (boxes). (B) Cells were cultured for 24 hours for the establishment of the ECJs and then treated with various amounts of TNF-α (10, 40, 100 ng/mL). Secretion of MMP-9 into the culture medium was assessed by gelatin zymogram analysis. The numbers under the MMP-9 bands indicate the activity of MMP-9.TNF-α: tumor necrosis factor-alpha, MMP-9: matrix metalloproteinase-9, HGK: human gingival keratinocyte, ECJ: E-cadherin junction, Pos: positive control for the chip reactions, Neg: negative control for the chip reactions.
|
 | Figure 5A specific inhibitor of MMP-9 reverses the effect of TNF-α on the development of ECJs in HGKs in vitro. Cells were cultured for 24 hours for the establishment of the ECJs and then treated with TNF-α (40 ng/mL) along with various amounts of an MMP-9 inhibitor (5, 20, or 50 µM) or without it for an additional 24 hours. (A) ECJ development was followed by immunocytochemical staining of E-cadherin expression (red). In addition, F-actin (green) was stained with FITC-phalloidin and nuclei were stained with DAPI (blue). The lower right pictures in each set of pictures are the merged images of the E-cadherin, F-actin, and nuclei images. (B) The average extent of the development of ECJs per cell was calculated by taking the mean of the values that were obtained by dividing the length of the E-cadherin expressed at cell junctions by the total perimeter of each cell.MMP-9: matrix metalloproteinase-9, TNF-α: tumor necrosis factor-alpha, ECJ: E-cadherin junction, HGK: human gingival keratinocyte, DAPI: 4′,6-diamidino-2-phenylindole dihydrochloride.
a)P<0.05 versus b)Nonparametric Kruskal-Wallis test and post hoc multiple comparison with the Dunn test.
|
 | Figure 6MMP-9 induces the dissociation of ECJs in HGKs in vitro. Cells were cultured for 24 hours for the establishment of the ECJs and then treated with various amounts of MMP-9 (10, 50, 100 ng/mL). (A) ECJ development was followed by immunocytochemical staining of E-cadherin expression (red). In addition, F-actin (green) was stained with FITC-phalloidin and nuclei were stained with DAPI (blue). The lower right pictures in each set of pictures are the merged images of the E-cadherin, F-actin, and nuclei images. (B) The average extent of the development of ECJs per cell was calculated by taking the mean of the values that were obtained by dividing the length of the E-cadherin expressed at cell junctions by the total perimeter of each cell.MMP-9: matrix metalloproteinase-9, ECJ: E-cadherin junction, HGK: human gingival keratinocyte, DAPI: 4′,6-diamidino-2-phenylindole dihydrochloride.
a)P<0.05 versus b)Nonparametric Kruskal-Wallis test and post hoc multiple comparison with the Dunn test.
|
Reinforcement of ECJs by vitamin D
Next, we explored how vitamin D averted the dissociation of the ECJs by TNF-α. Based on the antibody microarray analysis and zymogram analysis, vitamin D reduced the production of MMP-9 that was upregulated by TNF-α (Figure 7). Along with upregulating the development of ECJs, these results indicate that vitamin D may fortify ECJs against dissociation by TNF-α through downregulating the production of MMP-9, which is destructive to the ECJs.
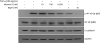
 | Figure 7Vitamin D downregulates the TNF-α-induced secretion of MMP-9 and the gelatinolytic digestion by the MMP-9 upregulated by TNF-α in HGKs in vitro. Cells were cultured for 24 hours for the establishment of ECJs and pretreated with or without vitamin D (10 or 100 nM) for an additional 24 hours. Then, cells were cultured with or without TNF-α (40 ng/mL) along with vitamin D for 24 and 48 hours (A) or 48 hours (B). (A) Antibody microarray analysis of MMPs was performed by applying conditioned culture medium to the antibody microarray of MMPs. Details on the arrays are shown in the legend of Figure 4A. The numbers under the MMP-9 blots indicate the intensity of MMP-9 standardized using the positive controls as references (boxes). (B) Secretion of MMP-9 into the culture medium was assessed by gelatin zymogram analysis. The numbers under the MMP-9 bands indicate the activity of MMP-9.TNF-α: tumor necrosis factor-alpha, MMP-9: matrix metalloproteinase-9, HGK: human gingival keratinocyte, ECJ: E-cadherin junction.
|
Next, target molecules of vitamin D were explored to further elucidate the mechanism through which vitamin D strengthened the development of ECJs against the deleterious effects of TNF-α by downregulating MMP-9 production.
Since NF-κB is a well-known downstream actor in the signal transduction pathway of TNF-α stimulation in inflammatory reactions [25], NF-κB signaling was explored to determine whether this pro-inflammatory signaling pathway played a role in the destruction of ECJs and the upregulated production of MMP-9 by TNF-α in HGKs. Treatments of the HGKs with Bay 11-7082 along with TNF-α clearly averted the attenuated development of the ECJs (Figure 8) and the upregulated production of MMP-9 by TNF-α (Figure 9). The finding that the deleterious effects of TNF-α were reversed by Bay 11-7082 (Figures 8 and 9), as was observed for vitamin D (Figures 2 and 7), strongly indicates that vitamin D works through attenuating NF-κB signaling to protect the epithelial barrier and reduce the production of MMP-9 under the influence of TNF-α. Furthermore, the downregulation of NF-κB signaling was directly demonstrated by immunoblotting analyses. As expected, vitamin D downregulated the NF-κB signaling that was upregulated by TNF-α (Figure 10). These results indicate that vitamin D may reinforce ECJs by downregulating inflammatory NF-κB signaling, which is upregulated by TNF-α.
 | Figure 8NF-κB inhibition by Bay 11-7082 reverses the TNF-α-induced effects on HGKs in vitro. Cells were cultured for 24 hours for the establishment of ECJs and then treated with TNF-α (40 ng/mL) along with Bay 11-7082 (Bay11; 10 nM) or without it for an additional 24 hours. (A) ECJ development was followed by immunocytochemical staining of E-cadherin expression (red). In addition, F-actin (green) was stained with FITC-phalloidin and nuclei were stained with DAPI (blue). The lower right pictures in each set of pictures are the merged images of the E-cadherin, F-actin, and nuclei images. (B) The average ratio of the development of ECJs per cell was calculated by taking the mean of the values which were obtained by dividing the length of the E-cadherin expressed at cell junctions by the total perimeter of each cell.NF-κB: nuclear factor kappa B, TNF-α: tumor necrosis factor-alpha, HGK: human gingival keratinocyte, ECJ: E-cadherin junction, DAPI: 4′,6-diamidino-2-phenylindole dihydrochloride.
a)P<0.05 versus b)Nonparametric Kruskal-Wallis test and post hoc multiple comparison with the Dunn test.
|
 | Figure 9The inhibition of NF-κB signaling by Bay 11-7082 lowers the secretion of MMP-9 into the culture medium and the gelatinolytic digestion by the secreted MMP-9, upregulated by TNF-α. Cells were cultured for 24 hours for the establishment of ECJs and then treated with TNF-α (40 ng/mL) along with Bay 11-7082 (Bay11; 10 nM) or without it for an additional 24 hours. (A) Antibody microarray analyses of MMPs were performed by applying culture medium to the MMPs antibody microarray chip. Representative data from the triplicate measurements are shown. Details on the arrays are shown in the legend of Figure 4A. The numbers under the MMP-9 blots indicate the intensity of MMP-9 standardized using the positive controls as references (boxes). (B) Secretion of MMP-9 into the culture medium was assessed by gelatin zymogram analysis. The numbers under the MMP-9 bands indicate the activity of MMP-9.NF-κB: nuclear factor kappa B, MMP-9: matrix metalloproteinase-9, TNF-α: tumor necrosis factor-alpha, ECJ: E-cadherin junction.
|
 | Figure 10Vitamin D inhibits TNF-α-induced NF-κB signaling, as shown by western blotting. Cells were cultured for 48 hours and then pretreated with vitamin D (10, 100, or 1,000 nM) or without it for 24 hours. Before cell lysis for western blotting, cells were treated with TNF-α (100 ng/mL) for 10 minutes. Bay 11-7082 (Bay 11; 1 nM), a pharmacological inactivator of NF-κB signaling, was used as an internal control of the immunoblotting analyses to show that TNF-α-induced NF-κB signaling was reduced when NF-κB signaling was pharmacologically inactivated in HGKs.TNF-α: tumor necrosis factor-alpha, NF-κB: nuclear factor kappa B, HGK: human gingival keratinocyte, GAPDH: glyceraldehyde 3-phosphate dehydrogenase.
|
Next, VDR expression was examined in the gingival epithelium, since the presence of VDR in the gingival epithelium would be promising in terms of the clinical relevance of the present in vitro study. VDR was clearly expressed throughout the entire layer of the gingival epithelium, including the JE, sulcular epithelium, and oral gingival epithelium (Figure 11).
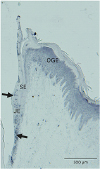 | Figure 11VDR is expressed in the gingival epithelium. VDR expression in gingival epithelium surrounding rat mandibular molars was examined using immunohistochemical methods. Expression of VDR was apparent in the JE (arrows). Expression of VDR was also localized in the OGE and SE.VDR: vitamin D receptor, JE: junctional epithelium, OGE: oral gingival epithelium, SE: sulcular epithelium.
|
DISCUSSION
The present study shows, for the first time, that vitamin D attenuated the dissociation of the ECJs of HGKs in response to TNF-α. VDR was highly expressed in the gingival epithelium, including the JE. Preservation of stable ECJs in the gingival epithelium by vitamin D may fortify the epithelial barrier in pro-inflammatory conditions. The maintenance of epithelial barrier integrity via vitamin D may be a factor involved in the protection of the periodontium against bacterial invasion. Although no report has shown an upregulating effect of vitamin D on the development of ECJs in gingival keratinocytes, vitamin D has been indirectly suggested to be associated with the development of ECJs in gingival keratinocytes. Gingival keratinocytes from mice deficient in VDR developed fewer ECJs than those from wild-type mice in vitro [26]. The association of ECJs with vitamin D is also well-characterized in other cells. Vitamin D was found to enhance the expression of E-cadherin in bronchial epithelial cells [27]. Vitamin D upregulated ECJs to suppress the epithelial-mesenchymal transition in various cancer cells [2829]. In addition to the effects of vitamin D on the development of ECJs, increased production of antimicrobial peptides [78] and decreased production of pro-inflammatory cytokines [7] from gingival keratinocytes infected by P. gingivalis were observed when gingival keratinocytes were treated with vitamin D. Such fortification of the epithelial barrier depleted by TNF-α has also been reported in the gingival epithelium in response to substances other than vitamin D. Azithromycin, an antibiotic, and irsogladine maleate, a gastric mucosal protectant, promoted recovery of the epithelial barrier downregulated by TNF-α in HGKs [1630]. In a recent report, estrogen was reported to upregulate the epithelial integrity of HGKs diminished by TNF-α [17]. Turning to other epithelial systems, azithromycin also maintained epithelial integrity in airway epithelial cells [31], and dexamethasone reversed the downregulation of E-cadherin expression in bronchial epithelial cells [32].
Vitamin D is believed to mitigate the destructive effects of TNF-α, which is known to be secreted from keratinocytes when infected by oral bacteria such as P. gingivalis [7]. Destruction of the epithelial barrier by TNF-α is a well-known phenomenon in various epithelial cells [323334] including gingival keratinocytes [1617]. Transepithelial electric resistance through the sheet of gingival keratinocytes was reduced by treatment with TNF-α [1617]. However, the mechanism through which vitamin D downregulates the development of the intercellular junctions of gingival keratinocytes remains unclear. In the present study, we, for the first time, demonstrated that TNF-α dissociated ECJs by stimulating the production of MMP-9 in HGKs. The dissociation of ECJs by exogenous MMP-9 indicates that MMP-9 directly disassembles ECJs in HGKs. Although in the present study, dissociation of the E-cadherin intercellular junction by MMP-9 did not show a dramatic ability to separate the gingival epithelial cells to the extent that is observed in the epithelial-mesenchymal transition, even a low level of ECJ disassembly may significantly damage the intercellular junctions of the keratinocytes in the JE, where only partial and weak ECJs are developed. Breakdown of the weak epithelial barrier in the JE may allow the invasion of bacteria to proceed farther or promote desquamation of the upper cells, making the gingival sulcus deeper.
As a mechanism by which vitamin D fortifies epithelial integrity, in the present study, we demonstrated that MMP-9 responded to vitamin D. Vitamin D downregulated the MMP-9 production that was upregulated by TNF-α. Although downregulation of MMP-9 by vitamin D has not been reported in gingival keratinocytes, it has been documented in various cancer cells [222324]. MMP-9, a zinc-metalloproteinase, degrades extracellular matrix components such as type IV collagen, type V collagen, and gelatin to promote angiogenesis and wound healing [35]. Interestingly, it also dissociates ECJs by causing the extracellular domain of E-cadherin receptors to be shed in ovarian carcinoma cells [20] and renal tubular epithelial cells [21]. At this moment, however, it is not clear whether MMP-9 also cleaves the exo-domain of E-cadherin receptors to destroy ECJs in HGKs. Further study is required to elucidate how MMP-9 dissociates ECJs in HGKs. It is also noteworthy that HGKs secrete MMP-9, since MMP-9 is regarded as a specific marker representing periodontitis when detected in gingival crevicular fluid or saliva [3637]. The production of MMP-9 by gingival keratinocytes suggests the possibility that epithelial MMP-9 may be an initial source of the MMP-9 found in the crevicular fluid or saliva before the later production of MMP-9 by inflammatory cells in the connective tissue. Gingival keratinocytes are known to secrete MMP-9 into the crevicular fluid; this process is triggered by TNF-α the expression of which is upregulated by infection with P. gingivalis [7].
In the present study, vitamin D treatment diminished NF-κB signaling, which was upregulated by TNF-α stimulation; furthermore, vitamin D also stimulated upregulation of ECJs and downregulation of MMP-9 production in the HGKs. NF-κB signaling is a prototypical pro-inflammatory signaling pathway [25] that is highly upregulated by TNF-α [38]. Thus, the idea that NF-κB signaling is a target of vitamin D signaling is not surprising. The finding that the downregulation of ECJs and the upregulation of MMP-9 production by TNF-α was averted by Bay 11-7082, a specific pharmacological NF-κB inhibitor, as was observed in response to vitamin D, further supports the possibility that vitamin D may reduce the pro-inflammatory TNF-α signaling pathway through downregulating NF-κB signaling. In addition, the downregulation of p-NF-kB by vitamin D, as shown in immunoblotting analyses, further suggests that vitamin D suppresses NF-κB signaling by TNF-α, through which the ECJs were destroyed by means of upregulated MMP-9 expression, to protect the epithelial barrier. In oral keratinocytes, vitamin D has been reported to reduce lipopolysaccharide-induced inflammation by downregulating NF-κB signaling [39]. Furthermore, VDR expression in the JE, as observed in the present study, suggests the possibility that vitamin D may substantially regulate ECJs to reinforce the epithelial barrier in the JE. In skin keratinocytes, NF-κB has also been proposed as a target molecule for vitamin D in reducing inflammation [40]. NF-κB signaling may be a target for developing more potent vitamin D analogs to reinforce the integrity of the epithelial barrier against bacterial challenges. In pancreatic cancer cells, a vitamin D analog, MART-10 (19-nor-2α-[3-hydroxypropyl]-1α,25[OH]2D3), was found to be more potent than vitamin D in terms of both reduction of MMP-9 production and loss of E-cadherin. It is expected that various vitamin D analogs will be tested to find more efficient agents for strengthening the epithelial integrity of the gingival keratinocytes through mechanistically targeting NF-κB signaling.
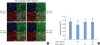
In conclusion, the results of the present study suggest that vitamin D may avert TNF-α induced downregulation of the intercellular ECJs of HGKs, decreasing the production of MMP-9 by TNF-α. In addition, vitamin D may reinforce ECJs by downregulating NF-κB signaling, which is upregulated by TNF-α. Such maintenance of the epithelial barrier by vitamin D may be associated with a role of vitamin D in protecting the periodontium from oral bacteria. Figure 12 summarizes the results of the present study.
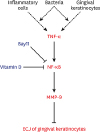 | Figure 12Diagram of a hypothetical molecular mechanism by which vitamin D suppresses the dissociation of ECJs induced by TNF-α. Vitamin D suppresses the NF-κB activation induced by TNF-α, which abolishes the detrimental action of TNF-α through downregulating the production of MMP-9, which breaks the integrity of ECJs. TNF-α may be produced by gingival keratinocytes infected with bacteria in an autocrine fashion at the early epithelial stage of infection [7] or could be externally provided from inflammatory cells in connective tissue at the late stage of inflammation. In summary, the present study suggests that vitamin D may be protective for periodontal health by strengthening the epithelial barrier.ECJ: E-cadherin junction, TNF-α: tumor necrosis factor-alpha, NF-κB: nuclear factor kappa B, MMP-9: matrix metalloproteinase-9.
|
 XML Download