

 PDF
PDF ePub
ePub Citation
 Print
Print


Abstract
Purpose
To evaluate the usefulness of wash-in color map in detecting early enhancement of prostate focal lesion compared to whole dynamic contrast-enhanced MRI (DEC MRI) images.
Materials and Methods
This study engaged 50 prostate cancer patients who underwent multiparametric MRI and radical prostatectomy as subjects. An expert [R1] and a trainee [R2] independently evaluated early enhancement and recorded the time needed to review 1) a wash-in color map and 2) whole DCE MRI images.
Results
The review of whole DCE images by R1 showed fair agreement with color map by R1, whole images by R2, and color map by R2 (weighted kappa values = 0.59, 0.44, and 0.58, respectively). Both readers took a significantly shorter time to review the color maps as compared to whole images (P < 0.001).
Go to : 
References
1. Futterer JJ, Briganti A, De Visschere P, et al. Can clinically significant prostate cancer be detected with multiparametric magnetic resonance imaging? A systematic review of the literature. Eur Urol. 2015; 68:1045–1053.
2. Weinreb JC, Barentsz JO, Choyke PL, et al. PI-RADS Prostate Imaging – Reporting and Data System: 2015, version 2. Eur Urol. 2016; 69:16–40.

3. Woo S, Suh CH, Kim SY, Cho JY, Kim SH, Moon MH. Head-to-head comparison between biparametric and multiparametric MRI for the diagnosis of prostate cancer: a systematic review and metaanalysis. AJR Am J Roentgenol. 2018; 211:W226–W241.
4. Purysko AS, Rosenkrantz AB, Barentsz JO, Weinreb JC, Macura KJ. PI-RADS version 2: a pictorial update. Radiographics. 2016; 36:1354–1372.
5. Iwazawa J, Mitani T, Sassa S, Ohue S. Prostate cancer detection with MRI: is dynamic contrast-enhanced imaging necessary in addition to diffusion-weighted imaging? Diagn Interv Radiol. 2011; 17:243–248.
6. Tamada T, Sone T, Higashi H, et al. Prostate cancer detection in patients with total serum prostate-specific antigen levels of 4–10 ng/mL: diagnostic efficacy of diffusion-weighted imaging, dynamic contrast-enhanced MRI, and T2-weighted imaging. AJR Am J Roentgenol. 2011; 197:664–670.
7. Greer MD, Shih JH, Lay N, et al. Validation of the dominant sequence paradigm and role of dynamic contrast-enhanced imaging in PI-RADS version 2. Radiology. 2017; 285:859–869.
8. Turco S, Lavini C, Heijmink S, Barentsz J, Wijkstra H, Mischi M. Evaluation of dispersion MRI for improved prostate cancer diagnosis in a multicenter study. AJR Am J Roentgenol. 2018; 211:W242–W251.
9. Sanz-Requena R, Marti-Bonmati L, Perez-Martinez R, Garcia-Marti G. Dynamic contrast-enhanced case-control analysis in 3T MRI of prostate cancer can help to characterize tumor aggressiveness. Eur J Radiol. 2016; 85:2119–2126.
10. Vos EK, Litjens GJ, Kobus T, et al. Assessment of prostate cancer aggressiveness using dynamic contrast-enhanced magnetic resonance imaging at 3 T. Eur Urol. 2013; 64:448–455.
11. Ocak I, Bernardo M, Metzger G, et al. Dynamic contrast-enhanced MRI of prostate cancer at 3 T: a study of pharmacokinetic parameters. AJR Am J Roentgenol. 2007; 189:849.
12. Kim JK, Hong SS, Choi YJ, et al. Wash-in rate on the basis of dynamic contrast-enhanced MRI: usefulness for prostate cancer detection and localization. J Magn Reson Imaging. 2005; 22:639–646.
13. Oto A, Kayhan A, Jiang Y, et al. Prostate cancer: differentiation of central gland cancer from benign prostatic hyperplasia by using diffusion-weighted and dynamic contrast-enhanced MR imaging. Radiology. 2010; 257:715–723.
14. Padhani AR, Gapinski CJ, Macvicar DA, et al. Dynamic contrast enhanced MRI of prostate cancer: correlation with morphology and tumour stage, histological grade and PSA. Clin Radiol. 2000; 55:99–109.
15. Riches SF, Payne GS, Morgan VA, et al. MRI in the detection of prostate cancer: combined apparent diffusion coefficient, metabolite ratio, and vascular parameters. AJR Am J Roentgenol. 2009; 193:1583–1591.
16. Rosenkrantz AB, Kim S, Campbell N, Gaing B, Deng FM, Taneja SS. Transition zone prostate cancer: revisiting the role of multiparametric MRI at 3 T. AJR Am J Roentgenol. 2015; 204:W266–272.
17. Schlemmer HP, Merkle J, Grobholz R, et al. Can preoperative contrast-enhanced dynamic MR imaging for prostate cancer predict microvessel density in prostatectomy specimens? Eur Radiol. 2004; 14:309–317.
18. Franiel T, Hamm B, Hricak H. Dynamic contrast-enhanced magnetic resonance imaging and pharmacokinetic models in prostate cancer. Eur Radiol. 2011; 21:616–626.
19. Rosenkrantz AB, Ginocchio LA, Cornfeld D, et al. Interobserver reproducibility of the PI-RADS version 2 lexicon: a multicenter study of six experienced prostate radiologists. Radiology. 2016; 280:793–804.
20. Hansford BG, Peng Y, Jiang Y, et al. Dynamic contrast-enhanced MR imaging curve-type analysis: is it helpful in the differentiation of prostate cancer from healthy peripheral zone? Radiology. 2015; 275:448–457.
21. Feinstein AR, Cicchetti DV. High agreement but low kappa: I. The problems of two paradoxes. J Clin Epidemiol. 1990; 43:543–549.
22. Cicchetti DV, Feinstein AR. High agreement but low kappa: II. Resolving the paradoxes. J Clin Epidemiol. 1990; 43:551–558.
23. Oto A, Yang C, Kayhan A, et al. Diffusion-weighted and dynamic contrast-enhanced MRI of prostate cancer: correlation of quantitative MR parameters with Gleason score and tumor angiogenesis. AJR Am J Roentgenol. 2011; 197:1382–1390.
24. Preziosi P, Orlacchio A, Di Giambattista G, et al. Enhancement patterns of prostate cancer in dynamic MRI. Eur Radiol. 2003; 13:925–930.
Go to :
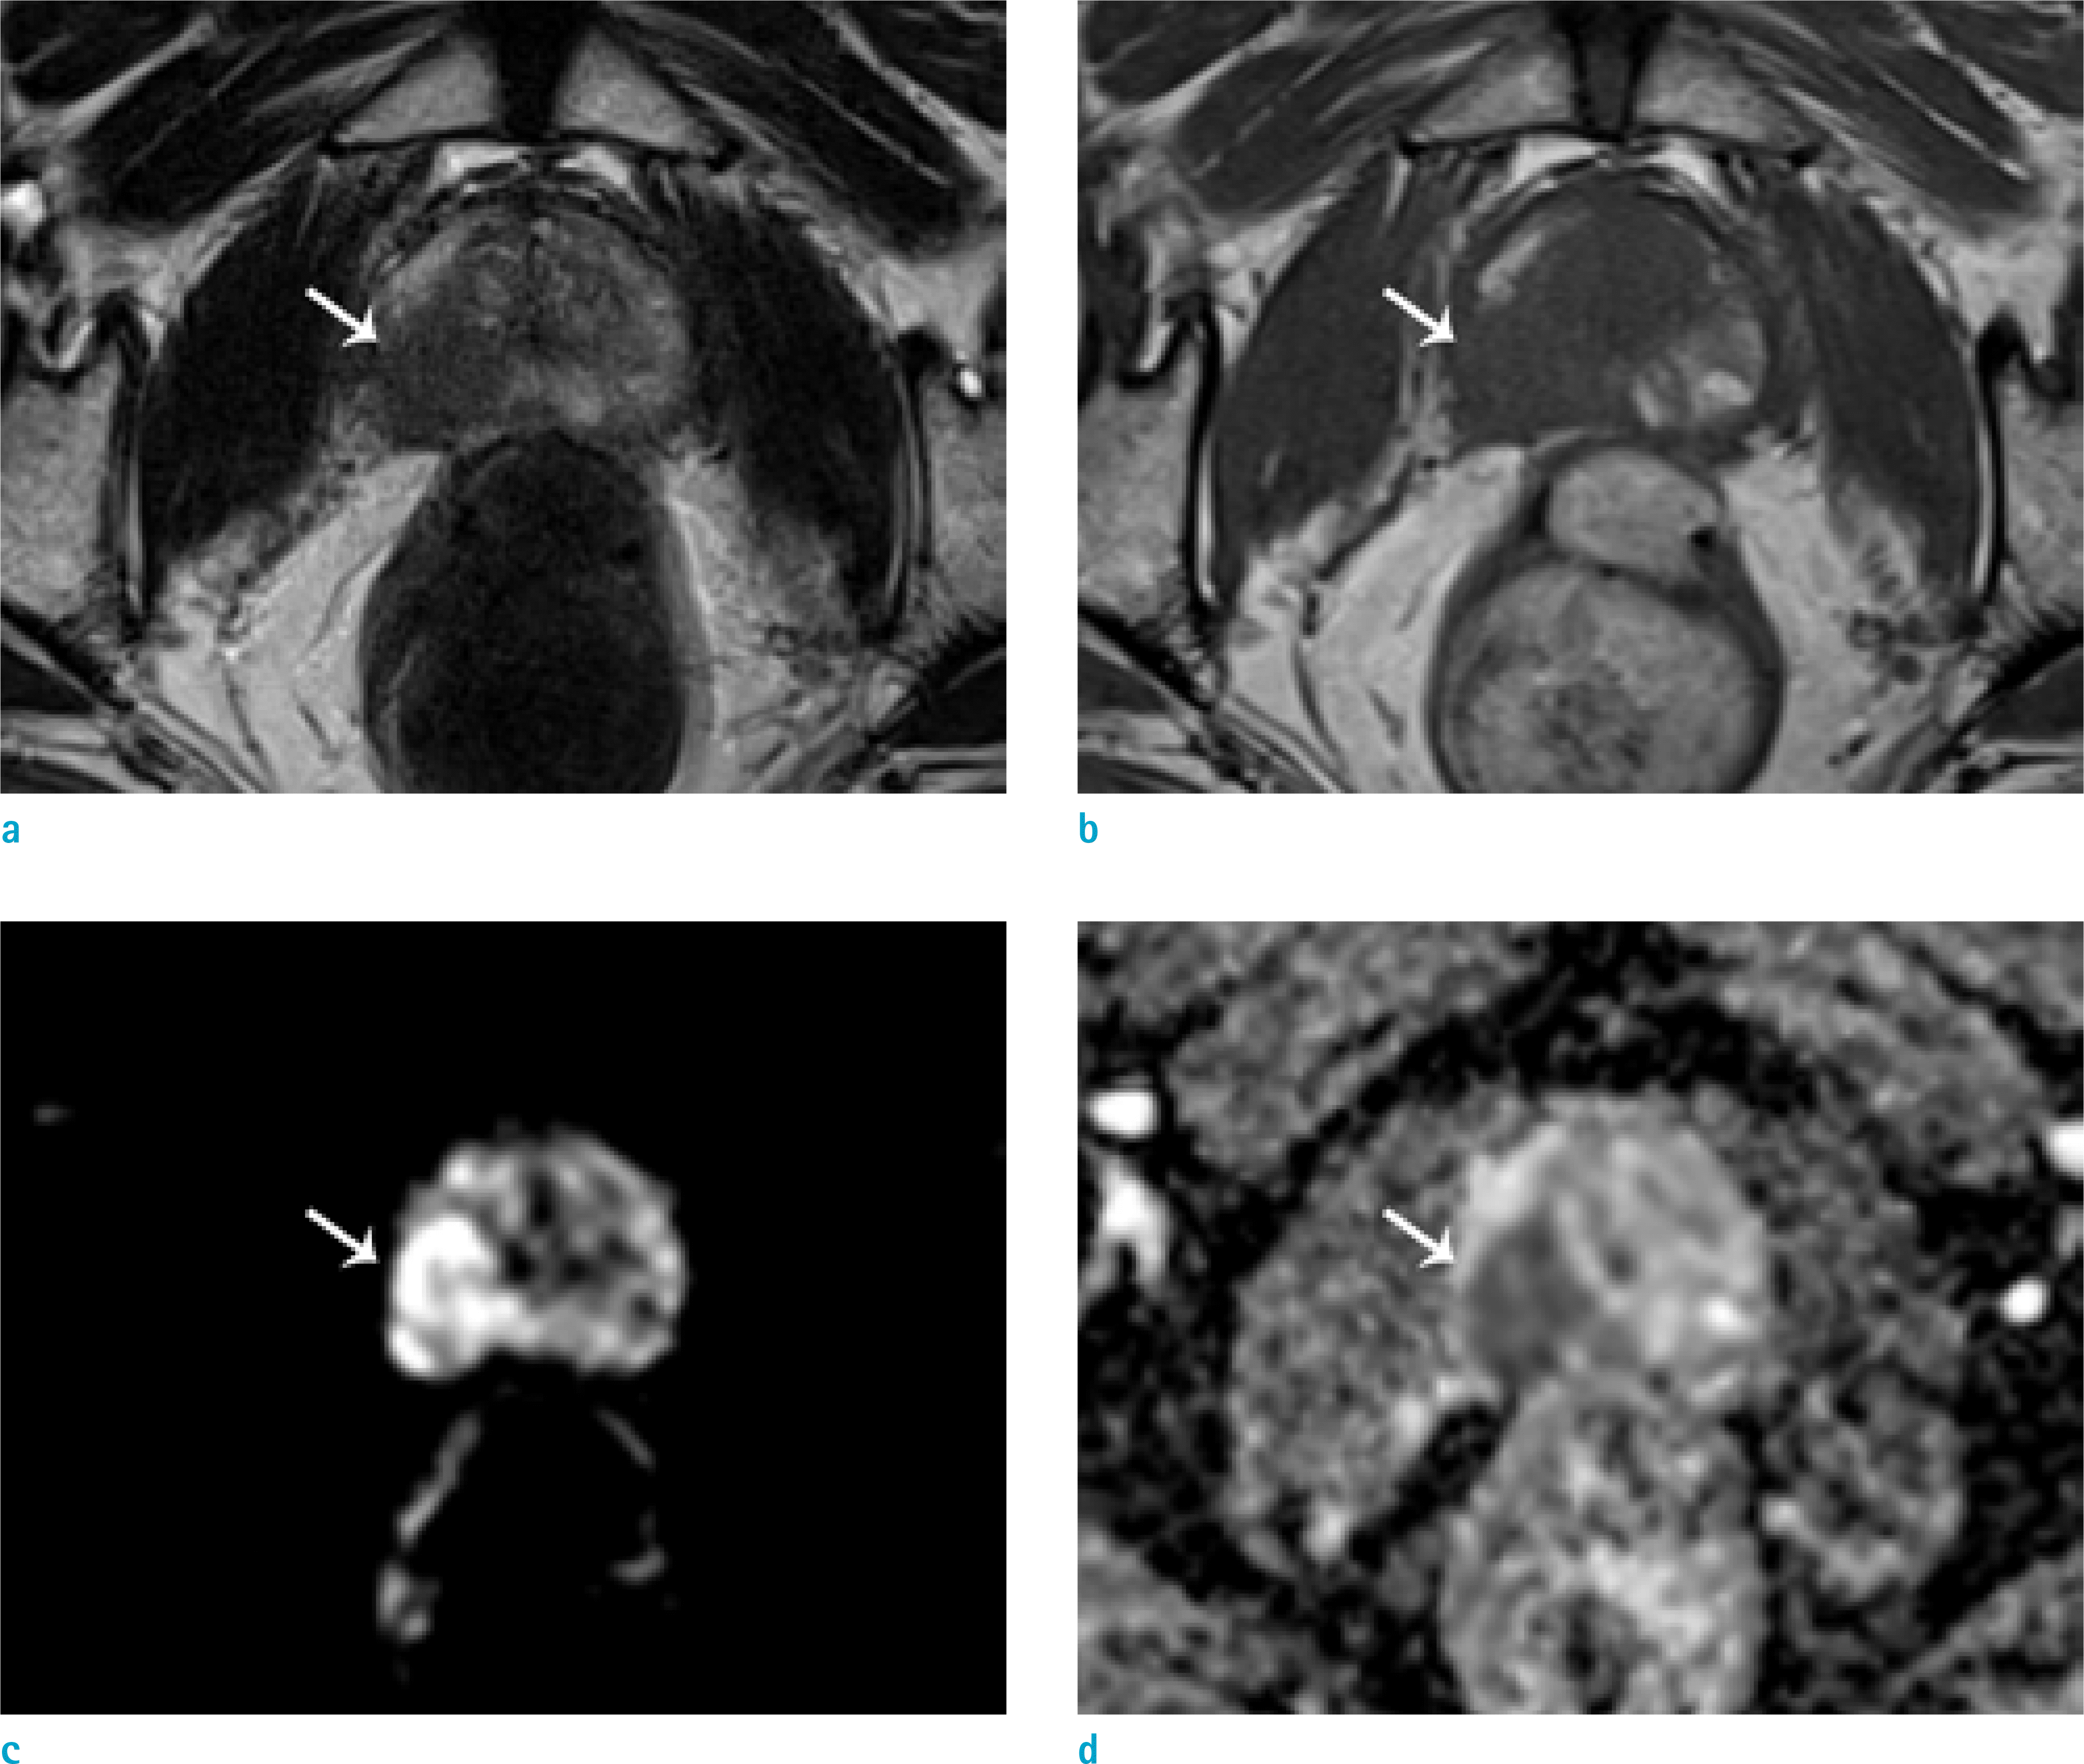 | Fig. 1.A 66-year-old male patient with prostate cancer (Gleason score 8 [4+4]). Focal low signal intensity is shown at the right peripheral zone (arrows) on T2WI (a) and T1WI (b). The lesion showed diffusion restriction on DWI (c) and the ADC map (d). Early enhancement was noted on DCE whole images (e) and the color map (f). |
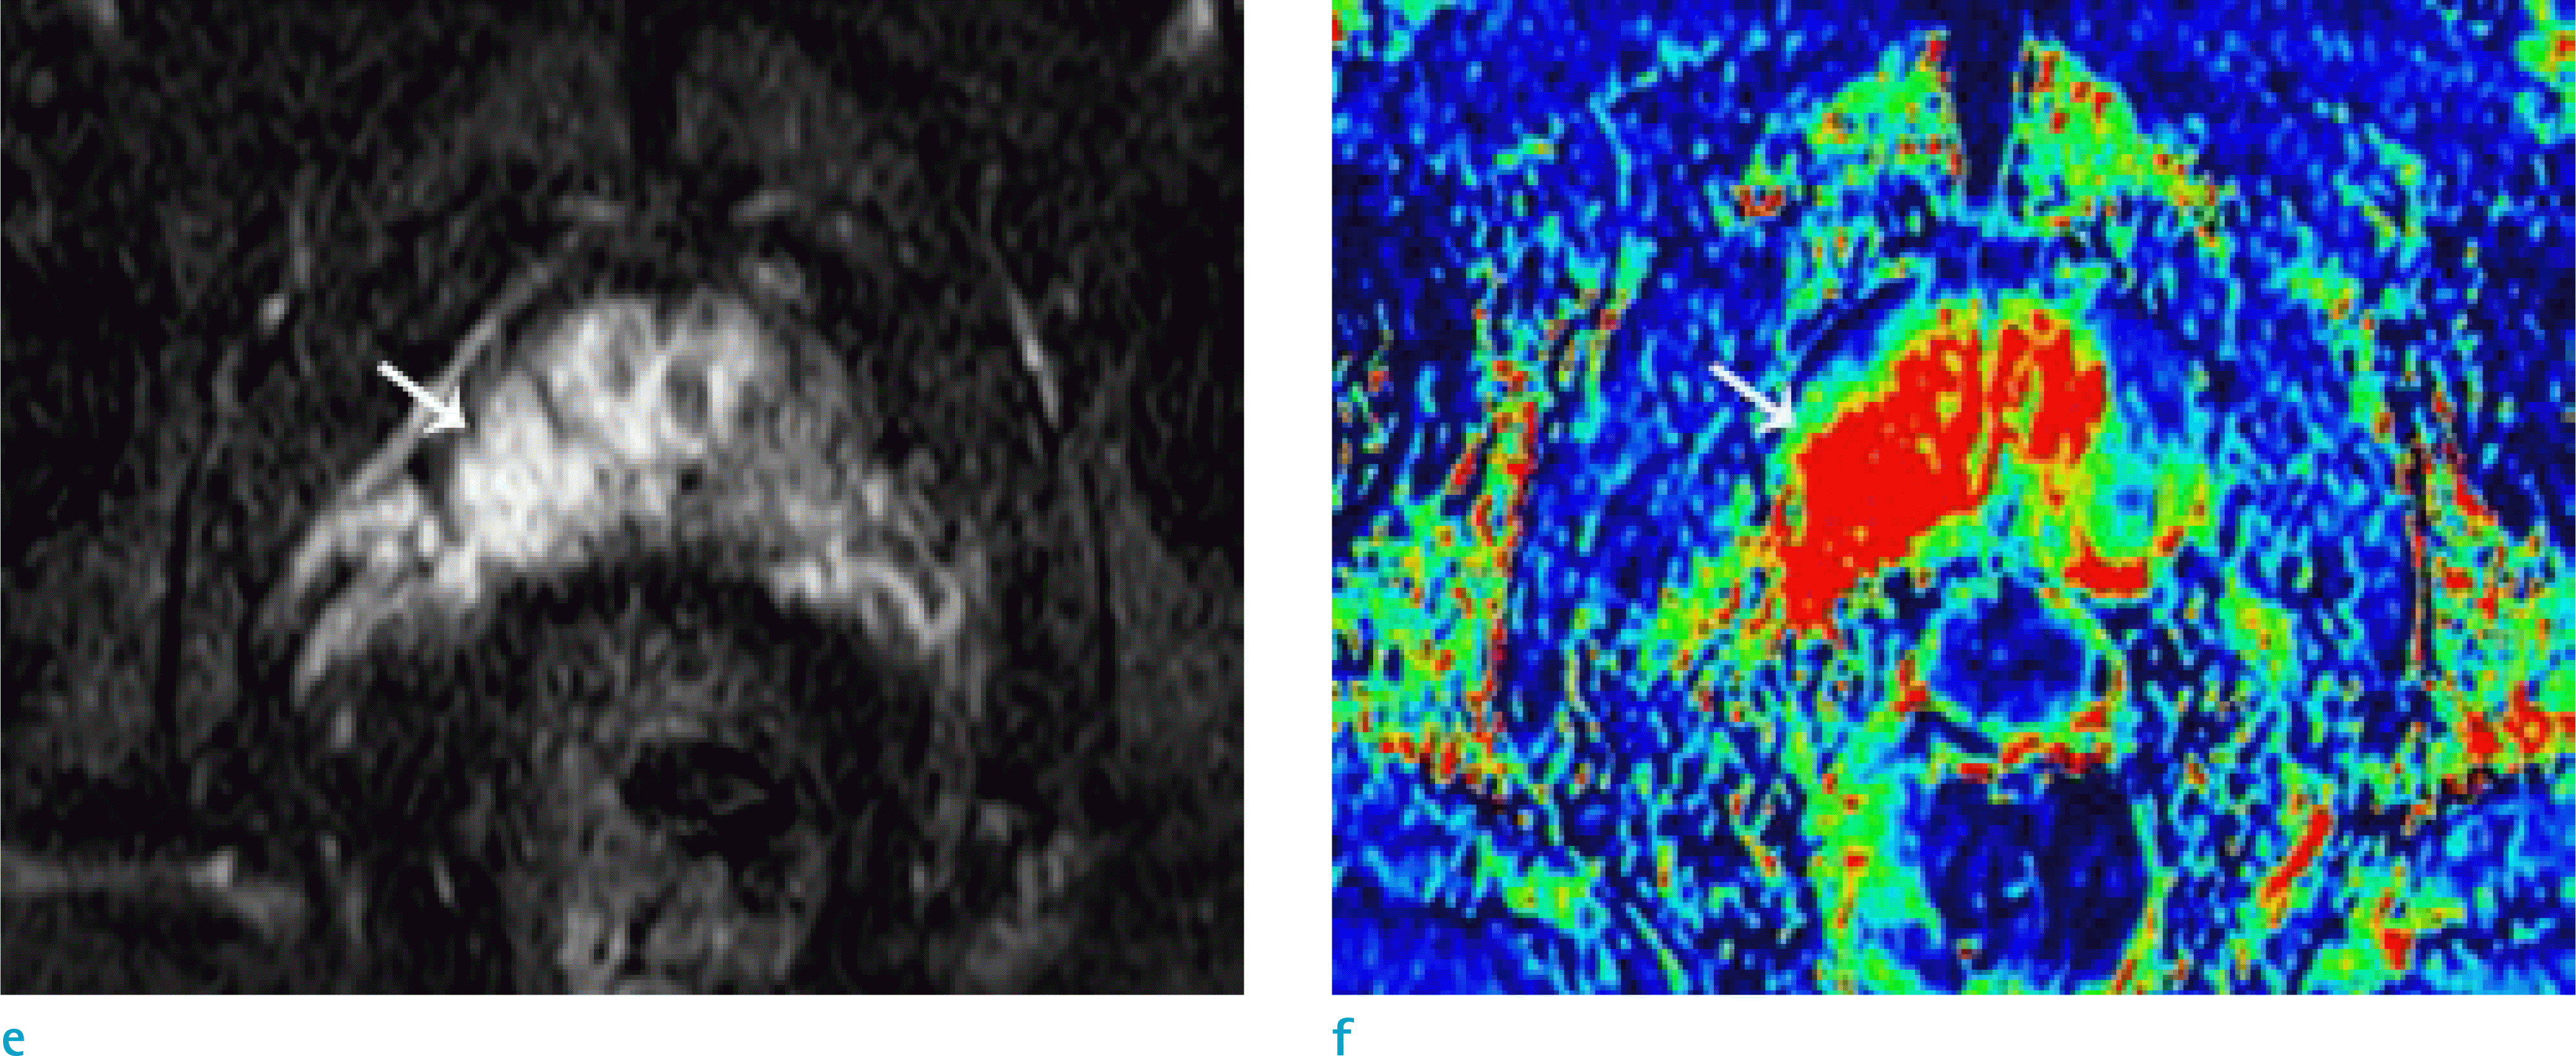 | Fig. 1.A 66-year-old male patient with prostate cancer (Gleason score 8 [4+4]). Focal low signal intensity is shown at the right peripheral zone (arrows) on T2WI (a) and T1WI (b). The lesion showed diffusion restriction on DWI (c) and the ADC map (d). Early enhancement was noted on DCE whole images (e) and the color map (f). |
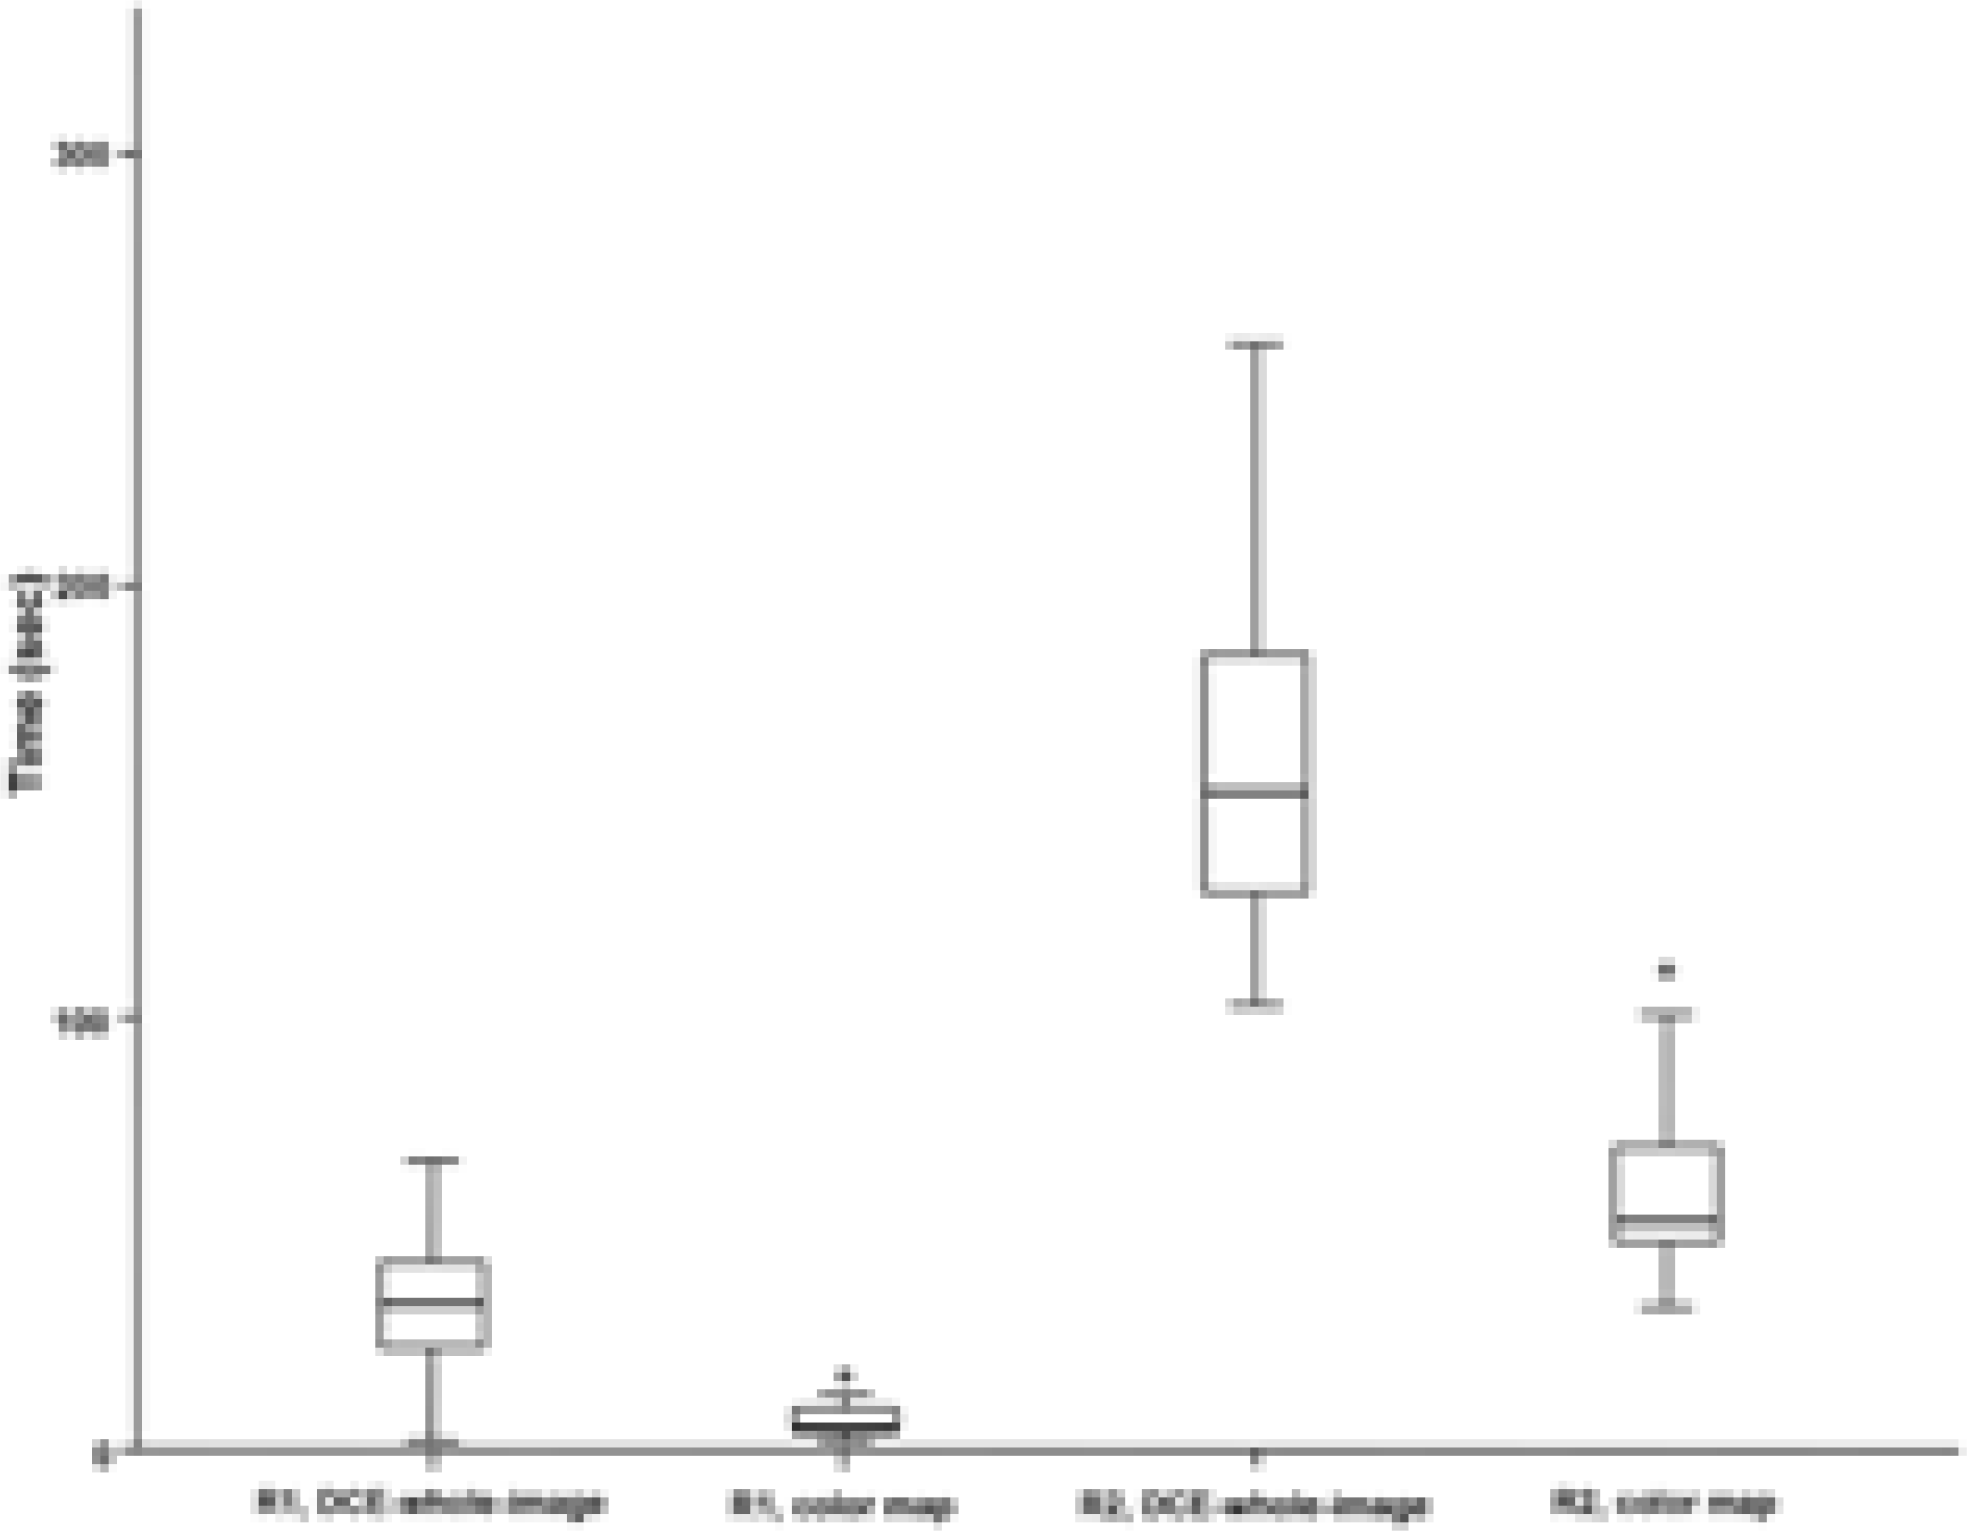 | Fig. 2.Box-whisker plot of the time consumed by two readers for evaluating DCE whole images and color maps. |
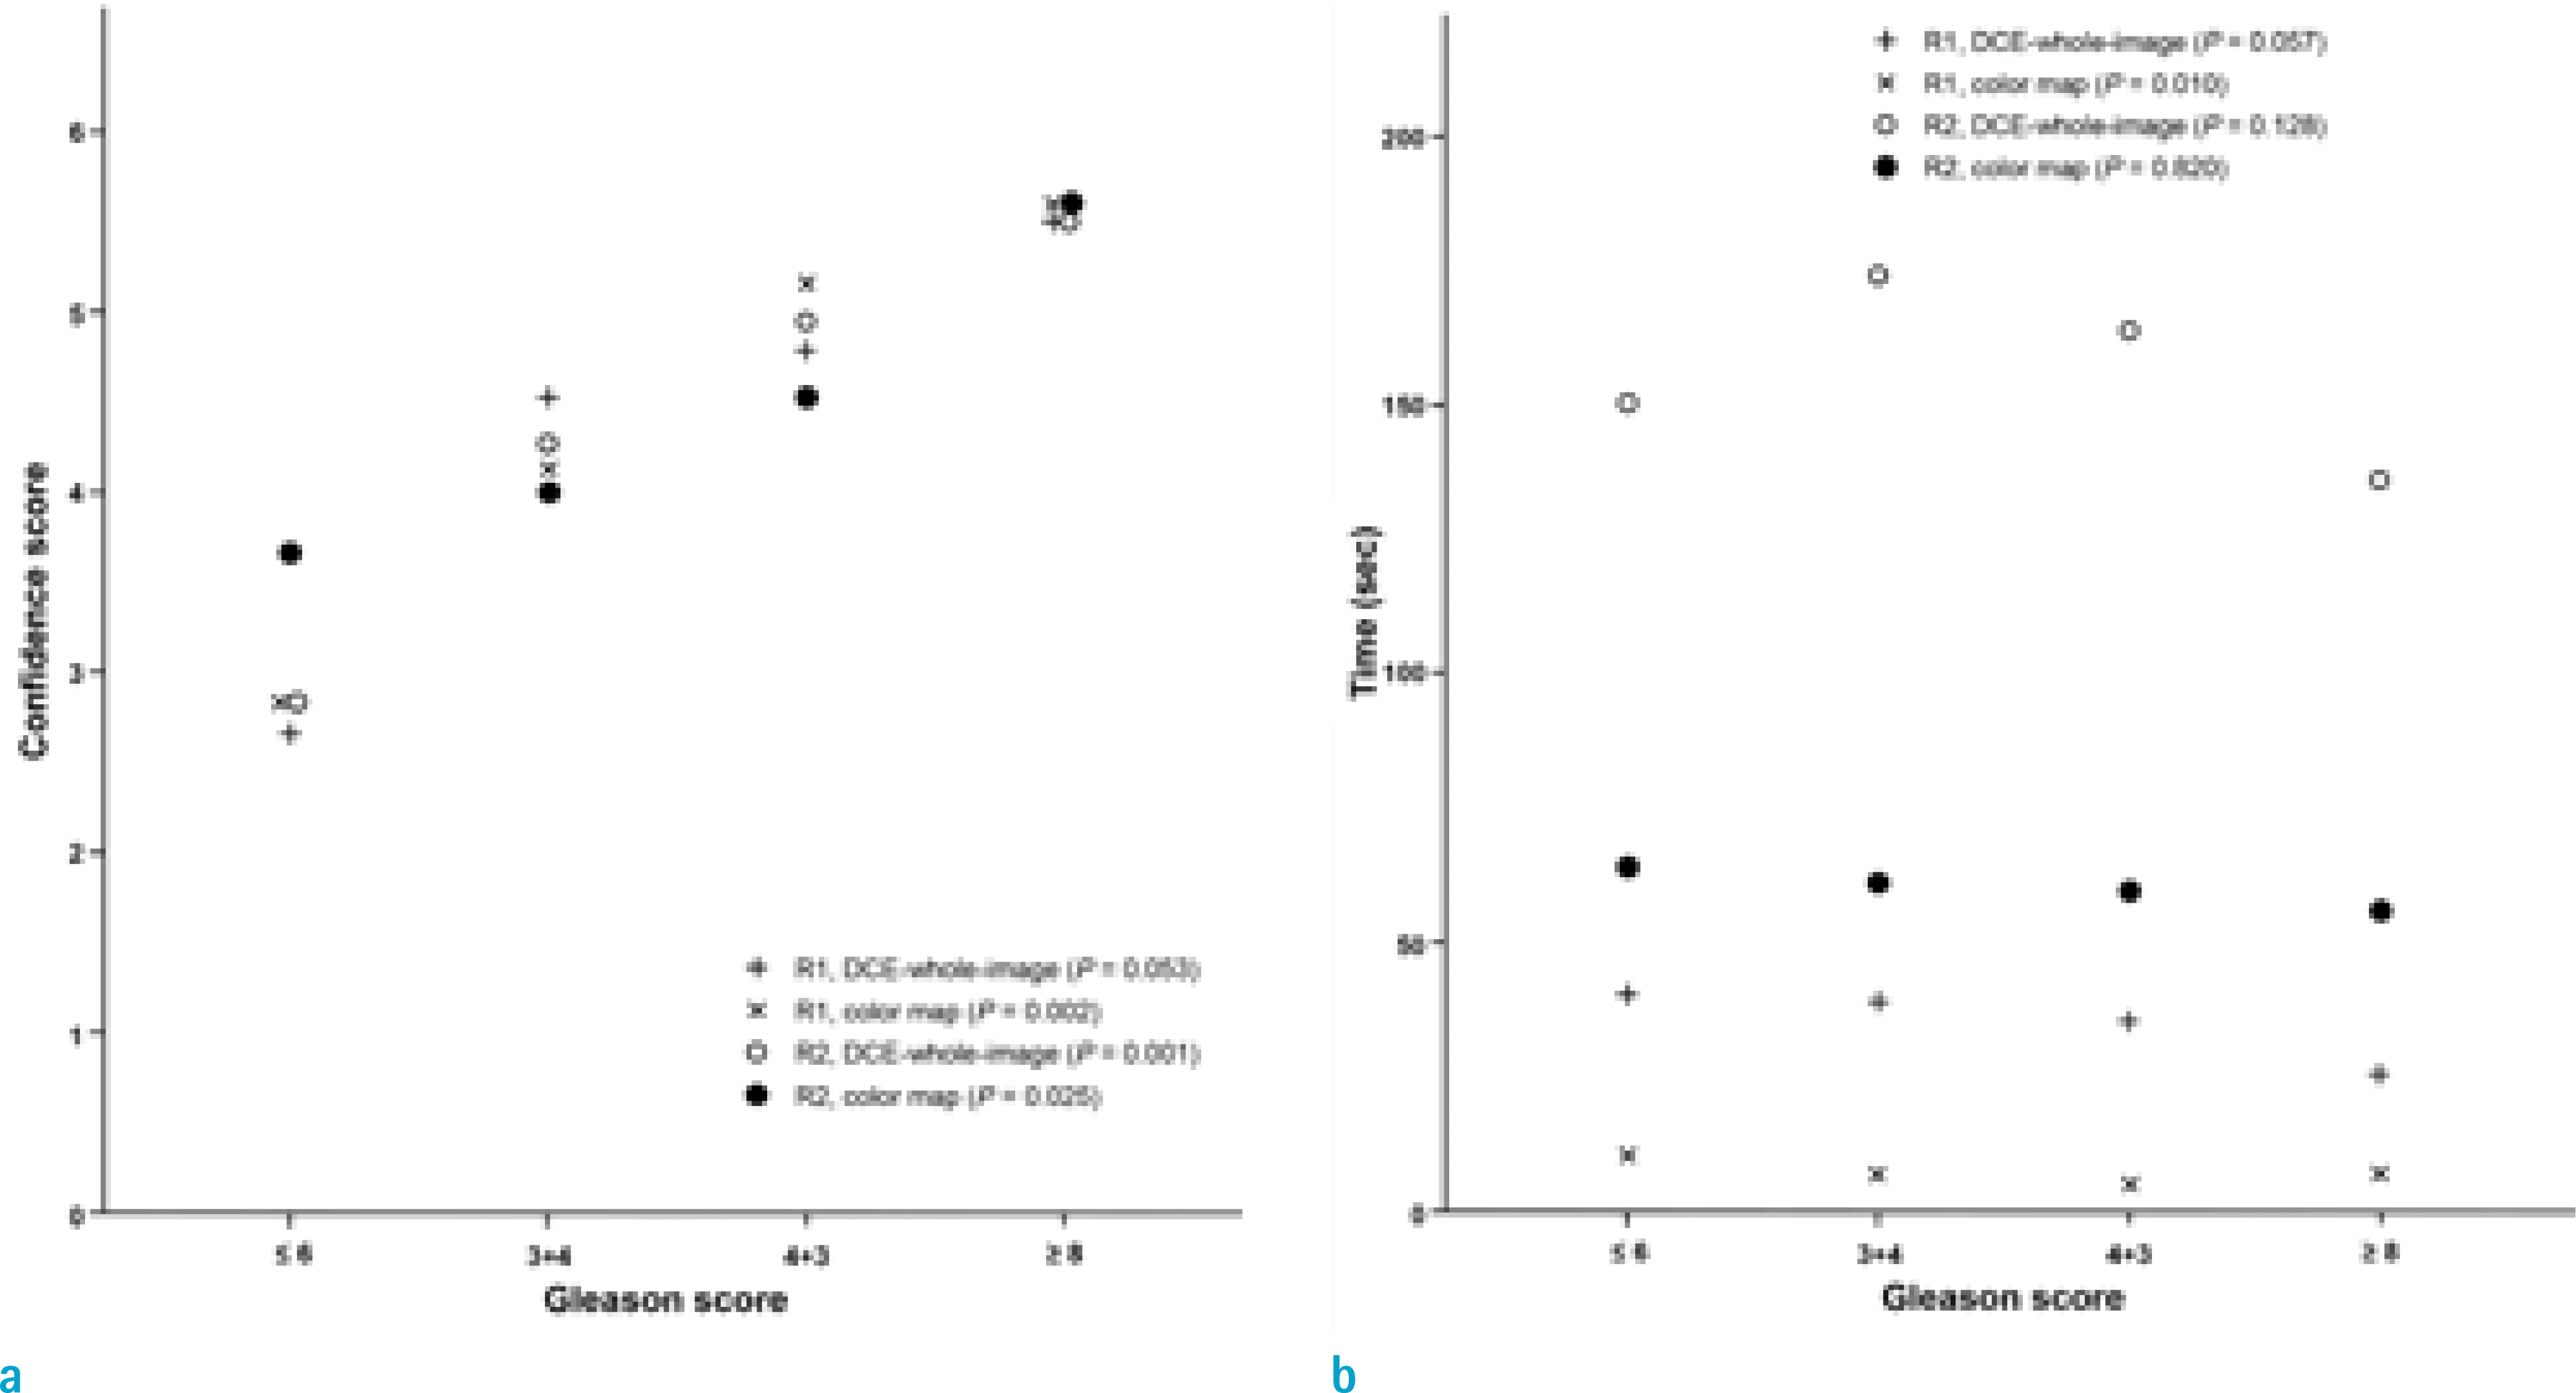 | Fig. 3.Differences in confidence scores (a) with respect to evaluation time (b) with respect to Gleason score. |
Table 1.
Baseline Characteristics
Table 2.
Comparison of Confidence Grades from Two Readers between DCE Whole Images and Color Maps
 XML Download