

 PDF
PDF ePub
ePub Citation
 Print
Print


INTRODUCTION
Hypertension is a major yet modifiable risk factor for cardiovascular disease, stroke, congestive heart failure, and renal failure, that leads to substantial morbidity and mortality worldwide.1) Early management of hypertension is crucial in preventing further adverse health outcomes at individual and national levels.
Despite significant improvements in management of hypertension and effectiveness and availability of antihypertensive medications, changes in blood pressure (BP) control rate have been considerably stagnant in recent years. The Korean Society of Hypertension reported that between 1998 and 2016, hypertension awareness rate has increased from 19.7% to 64.9% in men and from 29.6% to 66.8% in women, which was simultaneously accompanied by large improvements in treatment rate from 16.7% to 60.1% in men and from 26.6% to 64.3% in women.2) Furthermore, the recent temporal and geospatial analyses noted achievements in hypertension treatment adherence from 24.4% in 2002 to 71.6% in 2016, with reduced regional gap.3) However, a large proportion of the population remains untreated and unmanaged. Furthermore, regardless of the treatment status, large proportion of persons with hypertension still have uncontrolled BP, partly or entirely.4)5)
Considering the different pathophysiology and risk factors distinct to each systolic and diastolic BP (SBP and DBP), it is required to investigate which component of BP (or both) is hindering from comprehensive management. Therefore, we determined conventional (S&DBP, combined) and differential (SBP and DBP, separately) control rates in Korean adults with hypertension, and determined which demographic factors are associated with each BP control rates.
METHODS
Study population
This study analyzed data from the sixth (2013–2015) Korea National Health and Nutrition Examination Survey (KNHANES). The KNHANES is an ongoing surveillance system in the Republic of Korea that assesses current health status and distributions of its risk factors. It collects detailed information on socioeconomic status (SES), health behaviors, healthcare utilization, anthropometric measures, nutrition, and provides hematological and urinal profiles.6) To produce unbiased cross-sectional estimates of the Korean population, it uses complex, multi-stage probability sample design.7) Sample weights are constructed to account for non-response and post-stratification.7) The details of the KNHANES is published elsewhere.6)7) KNHANES VI is administered by the Korea Center for Disease Control and Prevention (KCDC) and approved by the KCDC Institutional Review Board (2013-07CON-03-4C, 2013-12EXP-03-5C, and 2015-01-02-6C). Each participant voluntarily participated and provided a signed written consent before participating in the study. In the present study, among 22,948 participants, 3,720 participants were excluded for missing BP measurements. Of the remaining 19,228 participants, 5,100 participants (2,429 men and 2,671 women) with hypertension were analyzed.
Questionnaire survey and health examination
The health interview obtained details on the following. Age was divided into 6 groups: below 30 years, 30–39 years, 40–49 years, 50–59 years, 60–69 years, and 70 years or above. Household income was split into low, middle-low, middle-high, and high, account for population structure at the surveyed year. Current employment status was categorized as either employed or self-/non-employed. Education level was categorized into completion of elementary school, middle-school, high school or college/university. Physical activity was assessed by fulfillment of “sufficient activity” by the Korean version of the International Physical Activity Questionnaire standard.8) Alcohol consumption was recorded as the frequency and amount of intake over the past year. Heavy drinkers were defined as individuals who consumed, on average, more than 7 glasses for men and 5 glasses for women of any alcoholic beverage at least twice per week. Cigarette smoking status was divided into non-smoker, previous smoker, and current smoker by the time of survey administration.
The health examination obtained participants' body weight and height to the nearest 0.1 kg and 0.1 cm, respectively, while wearing light clothing without shoes. Body mass index (BMI) was then calculated as the ratio of weight in kilograms to height in squared meters.9) Daily average sodium intake was calculated from the Korean version of the food frequency questionnaire. Quality of the survey was controlled by trained personnel using calibrated equipment and strictly adhering to standardized protocols.5)
Blood pressure measurement, hypertension, and hypertension control
BP was measured using a standard mercury sphygmomanometer (Baumanometer Wall Unit 33(0850); Baum Co., Inc., Copiague, NY, USA). Participants sat in a comfortable position after they had rested for at least 5 minutes and had not smoked within 30 minutes of the measurement. BP was measured on 3 consecutive occasions in a relaxed environment. The mean of the second and the third measurements was adopted for the data analysis. Information regarding hypertension treatment was obtained via self-report. Participants who took antihypertensive medication for 20 or more days per month were classified as the treated group. Hypertension prevalence was defined according to the 2013 Korean Society of Hypertension Guidelines for the Management of Hypertension; participants with a mean SBP ≥140 mmHg, DBP ≥90 mmHg, or using antihypertensive medications were considered to have hypertension.4)
Three types of BP control rates were calculated. Controlled SBP was defined as SBP <140 mmHg but with any DBP level. Conversely, controlled DBP was defined as DBP <90 mmHg but with any SBP level. The conventional hypertension control rate was also calculated—SBP <140 mmHg and DBP <90 mmHg (referred to as combined BP control rate). Each control rate was calculated among all people with hypertension (all hypertension) as well as among people using antihypertensive medication (treated hypertension).
Statistical analyses
General characteristics of the study population were reported as frequency and percentage or mean and standard deviation. Sex differences were compared via independent t-test, the Wilcoxon rank sum test, or χ2 test for differences. Each type of control rates was calculated separately by sex and age group. We used multivariable logistic regression to calculate odds ratio (OR) and 95% confidence interval (CI) to identify factors associated with better control of each BP among participants treated for hypertension. The model was adjusted for age, household income, employment status, education level, alcohol intake, smoking status, and BMI. Hosmer-Lemeshow goodness of fit for logistic regression and C-statistic ensured appropriateness of the model. All statistical tests were 2-sided, and statistical significance was set at a p value<0.05. All analyses were performed using SAS version 9.4 (SAS Institute Inc., Cary, NC, USA).
RESULTS
Participant characteristics
In the 6th KNHANES, 5,100 out of 19,228 adult participants had hypertension, which corresponds to the prevalence of 19.9% (95% CI, 19.1–20.7%). Among 5,100 people with hypertension, 3,376 were treated for hypertension. The prevalence of hypertension and its corresponding treatment rates were incrementally higher in older participants (Supplementary Tables 1 and 2).
Table 1 presents the general characteristics of participants with and treated for hypertension. The mean BP differed significantly by sex. In both participants with and treated for hypertension, men had significantly lower SBP yet higher DBP, younger age distribution, larger waist circumference, and higher proportion of current employment, completion of higher education, married persons, heavy drinkers, current smokers, regularly exercising persons, and daily average sodium intake compared to women. Only men treated for hypertension had significantly lower BMI than women.
Table 1
General characteristics of the study participants
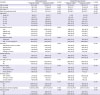
Values are presented as mean±standard deviation, median (interquartile range), or number (%).
The p value was derived from the independent t-test, the Wilcoxon rank sum test, or χ2 test.
BMI = body mass index; CVD = cardiovascular disease; DBP = diastolic blood pressure; SBP = systolic blood pressure.
Blood pressure control rates
Sex- and age-stratified BP control rates are illustrated in Figures 1, 2, 3 and Supplementary Tables 3 and 4. Among participants with hypertension, the combined BP control rate generally increased with older age. In men, the combined BP control rate increased consecutively up to 60.1% in those aged 60–69 years, and then declined to 58.0% in those beyond the age of 70. Analogously, in women, it increased up to 56.5% in age 60–69, which, again, was followed by 1.3% decline in age 70+ years. Similar pattern was seen in men treated for hypertension. However, the combined BP control rate showed non-linear age trend in women treated for hypertension; women between 40–49 years had the highest combined BP rate (87.1%), which was subsequently followed by large decline in the subsequent decade, then plateaued onwards.
Figure 1
(A) S&DBP control rate among participants with hypertension by age. (B) S&DBP control rate among participants treated for hypertension by age.
DBP = diastolic blood pressure; NA = not available; SBP = systolic blood pressure.
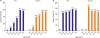
Figure 2
(A) SBP control rate among participants with hypertension by age. (B) SBP control rate among participants treated for hypertension by age.
NA = not available; SBP = systolic blood pressure.
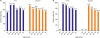
Figure 3
(A) DBP control rate among participants with hypertension by age. (B) DBP control rate among participants treated for hypertension by age.
DBP = diastolic blood pressure; NA = not available.
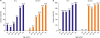
The differential BP control rates showed different trend. In men with hypertension, SBP control rate was the highest in men 40–49 years (74.6%), which was, then, accompanied by gradual decline. On the other hand, DBP control rate noticeably increased with older age. Similar pattern was observed in their female counterpart. Subsequent to 13 out of 18 women aged below 30 with controlled SBP, women of 40–49 years old had the second highest SBP control rate (67.0%), followed by non-linear negative trend in older women. The DBP control rate accreted to 93.9% in women aged 70+ years.
Participants treated for hypertension showed higher control rates in all aspects. Men treated for hypertension showed the highest SBP control rate in the youngest age group, which deteriorated to 74.9% in men aged 70+ years. Their female counterpart showed similar age trend. On the contrary, DBP control rates were the highest in both men and women aged 70+ years. However, women treated for hypertension showed intermittent fluctuations; the DBP control rate was higher in 40–49 years (89.4%) compared to 50–59 years (81.3%).
In terms of sex differences, combined BP control rate was higher in women, until the fifth decade in participants with hypertension and sixth decade in participants treated for hypertension. The differential BP analyses indicate that SBP control rate was uniformly higher in men, whereas DBP control rate was generally higher in women.
Factors associated with each blood pressure control
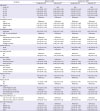
Table 2 illustrates characteristics associated with better combined BP control among participants with treated hypertension. After adjusting for covariates, rural residing, married, and overweight women were associated with better combined BP control. When examining individual BP component, overweight women with BMI between 25 and 30 kg/m2 were 1.31 times more likely to have controlled SBP (OR, 1.31; 95% CI, 1.05–1.63) compared to their normal BMI counterparts (Table 3). However, another anthropometric measurement, waist circumference, showed contrasting albeit statistically non-significant result; women with waist circumference equal to or larger than 80 cm were 0.80 times less likely to have controlled SBP (OR, 0.80; 95% CI, 0.60–1.05). When examining factors associated with DBP control rate, there was a graded negative trend in household income but positive trend in education level, only in men (Table 4). Lastly, heavy drinking men were also less likely to have controlled DBP (OR, 0.39; 95% CI, 0.22–0.66) compared to non-drinking men (Table 4).
Table 2
Factors associated with S&DBP control among participants with treated hypertension
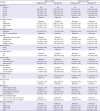
Table 3
Factors associated with SBP control among participants with treated hypertension
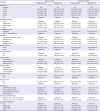
Table 4
Factors associated with DBP control among participants with treated hypertension
DISCUSSION
Our findings extend the conventional control rates seen in previous studies of KNHANES by focusing on the differential attainment of SBP and DBP goals. Overall, the combined BP control rate was higher with male sex and older age, which was manifested through gradual deterioration in SBP and improvements in DBP control rates with older age. This is reinforced by the fact that a large proportion of younger people with hypertension (30–49 years) in both sex were unaware of, untreated for, and uncontrolled for their elevated BP.2)4) Multinational analyses also demonstrated that men aged 50 years or older consistently had higher rates of hypertension treatment and control when compared to female or younger participants.10)
Among younger participants, combined and DBP control rates were low in both sex. However, there are no established evidence that links elevated DBP in younger age to adverse cardiovascular outcomes in later life.11)12) After a 12 year follow-up of 6,545 patients, the Copenhagen Heart Study did not find a significant association between isolated diastolic hypertension (IDH) and stroke risk.13) Multiple Risk Factor Intervention Trial yielded that elevated DBP was not independently associated with heart diseases; rather, the major determinant of cardiovascular risk was SBP,14) which was relatively well-controlled in our young participants.
On the contrary, uncontrolled SBP was more common among older subjects. Among persons with hypertension who were 60 years or older, 40.0% had isolated elevation of SBP. Conversely, among persons with SBP <140 mmHg, 40.7% had DBP below 70 mmHg. Therefore, in older population, it is clinically challenging to achieve intensive SBP control without concerns for extremely low DBP and the associated risk of myocardial hypoperfusion. Post hoc analyses of the Ongoing Telmisartan Alone and in Combination with Ramipril Global Endpoint Trial and the Telmisartan Randomised Assessment Study in ACE Intolerant Subjects with Cardiovascular Disease trial suggested that lower achieved DBP below 70 mmHg in patients with adequate SBP control (120–140 mmHg) was associated with higher risk for myocardial infarction and mortality.15) However, such trials included high risk individuals, predominantly men, and population-level, age- and sex-specific data are not available to date. The recent 2017 American Heart Association/American College of Cardiology BP guideline16) recommended a population-wide target of 130/80 mmHg, rather than the more lenient target for the elderly suggested in the Eighth Joint National Committee guideline.17) SBP control of the elderly population should be sought, with discretion, but with tenacity, and future changes in control rates should also be surveilled.
In addition to behavioral factors associated with hypertension management, the pathophysiology of BP can also elucidate our findings. The natural course of S&DBP increases until the fifth or sixth decade of life, after which there is a gradual decline in the DBP and the continued SBP elevation, independent of demographics, treatment status, and physician practices.18) Therefore, even the untreated participants are able to achieve DBP goal, whereas the uncontrolled SBP persists in the treated participants.
Marked endocrinological changes may attribute to sex differences. During menopause, changes in hormonal composition and secretion rate (i.e. decline in the estrogen/androgen ratio) are known to elevate SBP, by raising vascular stiffness and triggering atherosclerotic changes in the vessel wall.19) The rapid decline in estrogen levels causes an upregulation of the renin-angiotensin system with an increase in plasma-renin activity, triggering steeper SBP rise in women,20) thereby explaining the lower combined and SBP control compared with men.
Other studies agree with our findings. Lloyd-Jones et al.21) reported that poor systolic control was overwhelmingly responsible for poor rates of overall control to goal among elderly participants with hypertension in the U.S. Their sex-specific analyses indicated that women had lower rates of SBP and combined but higher DBP control rates compared with men.21) Another study done on Nigerian population also showed that despite better combined BP control with older age, SBP control rate became progressively lower.13)
Factors associated with higher SBP or DBP control rate in our study align with observations seen in other population surveillance and managed-care settings. However, we observed higher SBP control rate among women with BMI between 25 and 30 kg/m2, which contradicted previous findings.21) There are several explanations possible. First, central obesity, rather than high BMI, may be more closely associated with high BP.5 Stratification by waist circumference (according to National Cholesterol Education Program Adult Treatment Panel III metabolic syndrome criteria22)) indicated contrasting results, where larger waist circumference was associated with poorer systolic and diastolic BP control rates in both sex, although without statistical significance. While BMI is a widely utilized and practically obtained index, waist circumference may better characterize obesity and metabolic health in association with BP control.23)24) Second, a previous study on BMI and hypertension subtypes in a nationally representative population observed higher proportion of IDH and, thereby, lower proportion of systolic hypertension toward higher BMI.25) Such shift in relative frequencies of hypertension subtypes may have contributed to what appears to be better SBP control in overweight individuals.
In regards to DBP control, SES played diverging roles in men. Whereas high education level but low household income were positively associated with DBP control in our population, Vietnamese men in the lowest education category were more likely to have elevated DBP than those in the highest category, but their income level appeared irrelevant.26) However, no differences in BP levels were observed by education level in Israel population.26) Additional SES markers, such as urban or rural dwelling and individual, communal, or national economic standings appeared significant indicators of BP management in other populations by influencing access to care and knowledge regarding sequelae of uncontrolled hypertension.27) However, these associations often appeared complicated and, at times, somewhat contradictory. Often, effects of SES on BP control only manifested through complex interactions with other demographic factors, such as age or marital status.10) Lastly, low DBP control rate was observed in heavy drinking men, but not in women. The KCDC has reported that records on alcohol consumption in women are very inconsistent, thereby unable to yield reliable statistics. However, regardless of sex, it is established that excessive alcohol intake and abuse are associated with adverse arterial and cardiac health.28)
Our study has several notable strengths. To the extent of our knowledge, this is the first study that examined differential BP control rates in contemporary Korean population. Next, the KNHANES encompasses vast size and complexity of data that can be readily used to capture numerous aspects of contemporary population health status. In addition, the KCDC meticulously ensures quality to preserve its integrity as an unbiased and generalizable source.7) Additional examinations on the extent of association between various demographic risk factors and each BP control may allow governments and policymakers to tailor specific efforts to target population in fulfilling better hypertension management.
However, there are limitations to be considered. Due to the cross-sectional nature of the data source, temporality between risk factors and BP control cannot be determined. Furthermore, because single-occasion BP measurements were used to classify hypertension, BP variability cannot be ruled out. Inter-investigator variability in screening environment may have contributed to measurement error. Furthermore, it is known that BP measurements performed at a single visit usually overestimate the hypertension prevalence.29) In a domestic study performed in primary care clinics, the prevalence of masked hypertension was 21.2%.6) According to the registry data for ambulatory BP monitoring in secondary or tertiary referral centers, 14.9% of patients who have received hypertension diagnosis were found to have white coat hypertension, as were 25.3% diagnosed on the basis of the office BP.7) Differential misclassification bias also cannot be ruled out; in single-center studies from a domestic tertiary hospital, white coat hypertension occurred more frequently in patients with low BMI.5 The slight decline of the combined BP control rate in the oldest group may be construed by survival bias. Our older participants might have been those who survived through high BP and are still relatively healthy, thus selectively surveyed. Therefore, it may have been difficult to isolate the true effects of aging on BP control. Because demographic information and the use of antihypertensive medication were obtained via self-report, response bias cannot be ruled out.
Despite ameliorative trends in recent hypertension management status, a large proportion of population with hypertension remains partially or entirely uncontrolled. Persistent and comprehensive BP control should be prioritized, considering the widespread and prolonged benefits of timely and comprehensive BP control. This study examined different courses of individual BP control rates across various risk factors of hypertension. Such separate examination specified target groups to achieve SBP and DBP goals, which would have been overlooked with the traditional control rate. This implies that the future health policies should tailor more personalized approach to fulfill each gap in SBP and DBP control.
 XML Download