

 PDF
PDF ePub
ePub Citation
 Print
Print


INTRODUCTION
Staphylococcus aureus (S. aureus) can cause nosocomial infections and community-acquired diseases.1 Besides, its exposure in humans results in 20–30% mortality in the developed world.2 Staphylococcal enterotoxin B (SEB), released by S. aureus, is a major exotoxin in the pathogenesis of multi-organ failure associated with liver disease. When humans are exposed to SEB, it could be inhaled or ingested, leading to results ranging from slight food poisoning to fatal conditions, such as toxic shock. Liver is the primary response organ for intestinally derived events.3 Notably, it has been well-documented that SEB triggers injuries in animal organs, including liver.4 Mechanically, SEB acts as a superantigen that activates T cells up to 30%,5 causing uncontrolled pro-inflammatory cytokine release including interferon-gamma (INF-γ), tumor necrosis factor-alpha (TNF-α), and interleukins (ILs).6 In liver, administration of SEB also causes an increase in aspartate aminotransferase (AST) levels, necrotic lesions, as well as the inflammation storm. Naturally, SEB is extremely stable in different environments including acid, heat, and proteolytic digestion.7 However, there is still no effective method to prevent and treat SEB-induced toxicity and injuries, including liver injury.
Recently, miRNAs have been reported as an emerging, promising regulator in mediating SEB-induced inflammatory injury.8 miRNAs are short, non-coding RNA sequences that repress gene expression by binding to the 3′ untranslated region (3′ UTR) sequences of the target messenger RNAs (mRNA). miRNA-222-3p (miR-222-3p) is a well-studied oncogenic miRNA that is frequently upregulated in several types of human tumors.9 In liver, some serum/plasma miRNAs, including miR-222-3p, might serve as biomarkers for early diagnosis/prognosis of hepatocellular carcinoma (HCC).1011 Moreover, a close association between miR-222-3p and different liver injuries has been developed.12131415 Besides, the role of miRNA in regulating SEB-induced acute lung injury, especially inflammatory injury, has been announced.1617 However, it remains unclear whether miR-222-3p is implicated in the pathogenesis of SEB-induced liver injury.
Suppressors of cytokine signaling 1 (SOCS1) gene in humans locate on 16p13.3 and are key negative regulator of JAK/STAT pathway, participating in negative feedback loops in cytokine signaling.1819 SOCS1 expression could be regulated by cytokines, such as IL-2, IL-6, and INF-γ, and miRNAs including miR-222-3p.192021 Functions of SOCS1 have been disclosed in multiple liver injuries.222324 Previous studies indicated that SOCS1 was involved in SEB-mediated cell reprograming and inflammatory lung injury.2526 However, the role of SOCS1 in SEB-induced liver injury needs urgent explanation.
In order to explore the role of miR-222-3p in SEB-induced liver injury, miR-222-3p expression was deleted in mice and splenocytes ex-vivo. Expression of miR-222-3p and SOCS1 was examined. Liver injury was confirmed by biochemical analyses, histological examination, and inflammation response. Moreover, the regulatory relationship between miR-222-3p and SOCS1 was identified as well.
MATERIALS AND METHODS
Mice
Female C57BL/6 wild type (WT) mice (6 to 8 weeks old) as well as miR-222-3p knockout (KO) mice were purchased from Shanghai Model Organisms Center, Inc. (Shanghai, China). All animal experimental procedures were performed with the approval of the Institutional Animal Care and Use of the Second Hospital of Dalian Medical University.
Isolation of splenocytes
Splenocytes were prepared by aseptically removing the spleens from WT mice. Spleen tissues were homogenized into single-cell suspensions and subjected to red blood cell lysis (Sigma-Aldrich) according to instructions. Single splenocytes were seeded at a density of 1×10⁶ cells in 96-well plate (Corning, New York, NY, USA) in culture containing RPMI 1640 media, 10% heat inactivated fetal bovine serum (FBS; Hyclone, South Logan, UT, USA), 1% penicillin/streptomycin, 10-mM L-glutamine, 10-mM Hepes, and 50-µM β-Mercaptoethanol.
Cell transfection
Plasmid pcDNA 3.1-SOCS1 and oligonucleotides siRNA against SOCS1 (si-SOCS1), miR-222-3p mimic, anti-miR-222-3p (miR-222-3p-in), and their negative controls were acquired from GenePharma (Shanghai, China). Usually, 50 nM of oligonucleotides and 2 µg of plasmid were solely transfected into splenocytes. In rescue experiments, 30 nM of si-SOCS1 and 30 nM of anti-miR-222/NC-in were uniformly mixed and co-transfected in splenocytes. All transfection procedures were carried out using Lipofectamine™ 2000 (Invitrogen, Carlsbad, CA, USA). Transfected cells were incubated for 24 h for further study.
Challenge of SEB
SEB was provided from Toxin Technologies (Sarasota, FL, USA) and dissolved in sterile phosphate buffer solution (PBS) at a stock concentration of 2 mg/mL. To construct SEB-activated mice, wild type and miR-222-3p KO mice were firstly sensitized by intraperitoneally injecting 20 mg of D-galactosamine (D-gal) for 1 h, followed by injecting 40 µg of SEB (in 100 µL) or 100 µL of PBS for 24 h. Therefore, in vivo experiments were divided into four groups: WT control, KO control, WT SEB, and KO SEB. The experiments were repeated at least three times, and each experimental group consisted of four mice. To construct SEB-induced splenocytes, transfected splenocytes were stimulated with either PBS or SEB (1 µg/mL) for 24 hours. All cells were cultured in a humidified incubator with 5% CO2 and 20% O2.
Biochemical analyses of liver injury
Blood was collected from the four groups of mice at 8 h after SEB injection, and serum were separated and stored at −20℃. Levels of AST and alanine aminotransferase (ALT) were measured by spectrophotometric method at 340 nm in the serum using AST assay kit and ALT assay kit from Pointe Scientific (Canton, MI, USA) according to the protocol.
Histopathology examination of liver injury
Mice were euthanatized 24 h after SEB injection, and liver tissues were separated. Subsequently, tissues were fixed in 10% formalin, embedded in paraffin, and cut into 5-µm sections. The sections were deparaffinized in xylene, and serially diluted in decreasing concentrations of ethanol (100, 95, and 90%) prior to hematoxylin-eosin (HE) staining. Then, the stained sections were examined under a light microscope (Nikon, Tokyo, Japan) for infiltrating cells.
Enzyme-linked immunosorbent assay (ELISA)
Inflammatory cytokines (INF-γ, TNF-α, IL-6, and IL-2) in the serum and culture supernatant were detected with commercial mouse-specific ELISA kits purchased from Abcam (Cambridge, UK). Serum was collected from the four groups of mice at 24 h after SEB injection. Culture supernatant was acquired from transfected splenocytes after SEB incubation for 24 h. Their levels were measured at a wavelength of 450 nm.
Real-time quantitative PCR (RT-qPCR)
Expressions of miR-222-3p and SOCS1 mRNA in the serum from mice and splenocytes ex vivo were determined by RT-qPCR. Total RNAs were extracted with TRIzol reagent (Invitrogen), and the first-strand cDNA was synthesized using high capacity RNA-to-cDNA kit (Takara, Shiga, Japan). Quantitative PCR was performed using SYBR Prime-Script RT-PCR kit (Takara) on ABI 7500 real-time PCR system (Applied Biosystems, Foster City, CA, USA). β-actin mRNA and U6 snRNA (U6) were used as internal control for SOCS1 and mmu-miR-222-3p, respectively. Primers involved are as follows: SOCS1: 5′-GGTTGTAGCAGCTTGTGTC-3′ forward and 5′-AAT GAAGCCAGAGACCCTC-3′ reversed; β-actin: 5′-GGCTG TATTCCCCTCCATG-3′ forward and 5′-CCAGTTGGTAA CAATGCCATGT-3 ′ reversed; mmu-miR-222-3p: 5′-GGGGAGCTACATCTGGCT-3′ forward and 5′-TGCGT GTCGTGGAGTC-3′ reversed; U6: 5′-GCTTCGGCAGCA CATATACTAAAAT-3′ forward and 5′-CGCTTCACGAATTT GCGTGTCAT-3′ reversed. The reactions were performed in quadruplicate for each sample, for at least three independent runs. The relative gene expression was calculated using the 2−ΔΔCt method.
Western blot
Expression of SOCS1 protein in splenocytes ex vivo was determined by western blot assay. Total protein was isolated in RIPA lysis buffer (Beyotime, Shanghai, China) supplemented with cocktail protease inhibitor (Roche, Basel, Switzerland), and protein concentrations were determined by Bradford protein assay reagent (Bio-Rad, Hercules, CA, USA). Equal amounts of protein (20 µg) from each sample were loaded for standard procedures of western blot assay. GAPDH on the same membrane was an internal standard to normalize protein levels. The following primary antibodies were purchased from Abcam: SOCS1 (#62584, 1:1000) and GAPDH (#181602, 1:10000).
Luciferase reporter assay
Mouse SOCS1 3′ UTR fragment wild type (SOCS1-Wt) containing the potential binding sites of mmu-miR-222-3p and its corresponding mutant (SOCS1-Mut) were cloned by PCR methods into pmirGLO vector (Invitrogen). SOCS1-Mut was replaced UGUAGC with ACAUCG in SOCS1 sequence. Splenocytes were transfected according to the following groups: SOCS1-Wt+miR-NC mimic (miR-NC), SOCS1-Wt+miR-222-3p mimic (miR-222-3p), SOCS1-Mut+miR-NC, and SOCS1-Mut+miR-222-3p; or SOCS1-Wt+miR-NC-in, SOCS1-Wt+miR-222-3p-in, SOCS1-Mut+miR-NC-in, and SOCS1-Mut+miR-222-3p-in. The pmirGLO vector itself provided a strong Renilla luciferase signal acting as a control reporter for normalization. After 24 h incubation, cells were collected to measure Firefly and Renilla luciferase activity using the dual-luciferase reporter assay system (Promega, Madison, WI, USA). All data were the average of at least three independent transfections, and were normalized to SOCS1-Wt+miR-NC/miR-NC-in.
Statistical analysis
Data are presented as mean±standard error of mean (SEM). The in vitro assays were performed in triplicate. The in vivo assay included four mice in each group. Student's t-test was performed to compare the differences between the two groups, and multiple comparisons were made using one-way analysis of variance (ANOVA) and Tukey's post hoc test. Statistical analyses were performed using Graphpad 6.0 (GraphPad Software Inc., San Diego, CA, USA), and p<0.05 was considered significant.
RESULTS
Knockout of miR-222-3p attenuated SEB-mediated liver injury
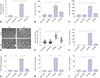
To address the role of miR-222-3p in SEB-induced liver injury, miR-222-3p KO mice and wild type (WT) mice were sensitized by D-gal 1 h before SEB injection. After 24 h, serum miR-222-3p expression level was firstly determined using RT-qPCR. As shown in Fig. 1A, miR-222-3p level was significantly downregulated in KO mice with or without SEB challenge; moreover, its level was dramatically increased in WT mice under SEB challenge (WT SEB) compared to WT control. Subsequently, SEB-induced liver injury in WT and KO mice was confirmed by biochemical analyses, histological examination, and inflammation response. After SEB injection for 8 h, serum levels of liver marker enzyme AST and ALT were observed to be abundantly elevated in WT SEB mice compared to WT control. Meanwhile, KO SEB mice showed significantly lower AST level than WT SEB (Fig. 1B and C). Moreover, histopathological examination of liver tissue by HE staining showed that liver tissue from WT SEB mice exhibited remarkable amounts of infiltrating monocyte cells versus WT control (Fig. 1D). Similarly, the infiltrating cells and total infiltrating mononuclear cells in liver from KO SEB mice were lower compared to those from WT SEB (Fig. 1E). Inflammation response of WT and KO mice after SEB injection was determined by levels of inflammatory cytokines at 24 h. ELISA data showed that serum levels of INF-γ (Fig. 1F), TNF-α (Fig. 1G), IL-6 (Fig. 1H), and IL-2 (Fig. 1I) were overall extremely promoted after SEB challenge in WT mice, while KO prominently descended SEB-induced high level of these factors. Intriguingly, miR-222-3p KO itself showed little effect on serum levels of AST, ALT, INF-γ, TNF-α, IL-6, and IL-2 and the numbers of infiltrating mononuclear cells in liver. These data supported the successful construction of liver injury mice model, and miR-222-3p downregulation took a potentially protective role in SEB-induced liver injury.
Knockdown of miR-222-3p inhibited inflammatory injury in splenocytes ex vivo under SEB incubation
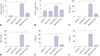
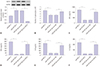
In order to investigate the role of miR-222-3p in SEB-induced liver injury in vitro, splenocytes were isolated from C57BL/6 mice. Splenocyte ex vivo were cultured and transfected miR-222-3p/NC inhibitor (miR-222-3p/NC-in), followed by 1 µg/mL of SEB incubation for 24 h. RT-qPCR analysis showed that SEB challenge dramatically upregulated miR-222-3p, whereas the presence of miR-222-3p-in could abundantly block its expression under SEB challenge (Fig. 2A). Next, we collected and counted the number of cells in each experimental group. As shown in Fig. 2B, there was a significant increase of splenocyte cells isolated from cultures that were treated with miR-NC-in transfection and SEB challenge, which descended when transfected with miR-222-3p-in. Inflammation response of splenocytes under SEB incubation was determined by the levels of inflammatory cytokines on 24 h. ELISA data showed that the levels of INF-γ (Fig. 2C), TNF-α (Fig. 2D), IL-6 (Fig. 2E), and IL-2 (Fig. 2F) in culture supernatant were overall extremely promoted after SEB treatment, while miR-222-3p-in prominently descended SEB-induced high level of these factors. Notably, miR-222-3p-in transfection itself showed little effect on the cell number of splenocytes and the release of INF-γ, TNF-α, IL-6, and IL-2 (Fig. 2B–F). These results indicated that knockdown of miR-222-3p could inhibit SEB-induced liver inflammatory injury in splenocytes ex vivo.
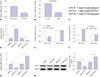
SOCS1 was negatively regulated by miR-222-3p in splenocytes and in vivo model
This study examined SOCS1 expressions in SEB-challenged mice and splenocytes. As shown in Fig. 3A and B, SOCS1 level was significantly downregulated during SEB treatment. Moreover, the target relationship between miR-222-3p and SOCS1 had been reported in basal-like breast cancer cells. Therefore, we wondered whether SOCS1 was modulated by miR-222-3p in splenocytes through target binding. In silicon results on targetScan software (Whitehead Institute for Biomedical Research, Cambridge, MA, USA) showed a putative miR-222-3p target site in 3′ UTR of SOCS1, as represented in Fig. 3C. The potential binding of miR-222-3p in the 3′ UTR of SOCS1 wild type (SOCS1-Wt) was validated with luciferase reporter assay, as well as the corresponding mutant (SOCS1-Mut). Splenocytes were co-transfected with SOCS1-Wt/Mut and miR-222-3p/NC mimic (miR-222-3p/NC) or miR-222-3p/NC-in. The high transfection efficiency of miR-222-3p/NC or miR-222-3p/NC-in was confirmed (Fig. 3D). As a result, relative luciferase activity of SOCS1-Wt was remarkably reduced in the presence of miR-222-3p (Fig. 3E), and increased in the presence of miR-222-3p-in (Fig. 3F); however, there was no difference in SOCS1-Mut group. Subsequently, the regulatory effect of miR-222-3p on SOCS1 expression was detected. Protein expression level and mRNA expression level of SOCS1 reduced when transfected with miR-222-3p, and increased when transfected with miR-222-3p-in (Fig. 3G and H). Notably, SOCS1 expression level was dramatically higher in miR-222-3p KO mice compared to that in WT mice, and was significantly downregulated during SEB treatment (Supplementary Fig. 1, only online). Meanwhile, SEB-exposed KO mice showed higher level of SOCS1 than SEB-exposed WT mice, suggesting the involvement of SOCS1 in the protective role of miR-222 in SEB-induced liver injury. These data demonstrated that SOCS1 served as a target gene for miR-222-3p and was negatively regulated by miR-222-3p.
Overexpression of SOCS1 suppressed inflammatory cytokines release in SEB-induced splenocytes ex vivo
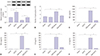
SOCS1 has been complicated with several liver injuries. However, the role of SOCS1 in SEB-induced injury especially liver injury remains to be uncovered. Splenocytes cultured were transfected with pcDNA-SOCS1 or Vector, followed by 1 µg/mL of SEB incubation for 24 h. Western blot demonstrated that SEB challenge dramatically inhibited SOCS1 protein expression, whereas the presence of pcDNA-SOCS1 could abundantly block its downregulation under SEB challenge (Fig. 4A). In addition, there was a significant increase of splenocyte cells isolated from cultures that were treated with vector transfection and SEB incubation, which decreased after transfected with pcDNA-SOCS1 (Fig. 4B). ELISA data showed that the levels of INF-γ (Fig. 4C), TNF-α (Fig. 4D), IL-6 (Fig. 4E), and IL-2 (Fig. 4F) in culture supernatant were overall extremely promoted after SEB treatment, while ectopic SOCS1 prominently descended SEB-induced high level of these factors. Notably, pcDNA-SOCS1 transfection itself showed little effect on the cell number of splenocytes and the release of INF-γ, TNF-α, IL-6, and IL-2 (Fig. 4B–F). These results showed that upregulation of SOCS1 could protect splenocytes against SEB-induced inflammatory injury.
SOCS1 downregulation blocked the suppressive effect of miR-222-3p knockdown in SEB-induced inflammatory injury in splenocytes ex vivo
To further explore the influence of SOCS1 expression on miR-222-3p knockdown-mediated suppressive effect on SEB-induced inflammatory injury, splenocytes cultured were cotransfected with miR-222-3p-in and si-SOCS1, and then treated with 1 µg/mL of SEB. After 24 h, transfection efficiency was determined and SOCS1 levels were detected by RT-qPCR. As described in Fig. 5A, the higher level of SOCS1 induced by miR-222-3p-in transfection was tremendously attenuated in the presence of si-SOCS1. Rescue experiments that numbers of splenocytes (Fig. 5B) and inflammatory cytokines INF-γ, TNF-α, IL-6, and IL-2 (Fig. 5C–F) were distinctively inhibited during knockdown of miR-222-3p expression only, which was obviously abolished at simultaneous knockdown of SOCS1 expression. These outcomes implied that the suppressive effect of miR-222-3p knockdown in SEB-induced inflammatory injury in splenocytes ex-vivo depend on upregulating its target gene SOCS1, as described in Supplementary Fig. 2, only online.
DISCUSSION
miR-222-3p protects liver and splenocytes against SEB-induced inflammatory injury. It has been well-documented that SEB triggers liver injury. There are diverse underlying mechanisms of SEB, including miRNAs, inflammation, apoptosis, and proliferation. For example, Kadhim, et al.27 demonstrated that resveratrol could effectively attenuate SEB-induced acute liver injury, and that this might result from its action on miRNA profile in liver mononuclear cells and induction of myeloid-derived suppressor cells (MDSCs). Moreover, hepatic MDSCs were reported to inhibit SEB-triggered T cell proliferation in a reactive oxygen species-dependent manner both in vivo and ex vivo.28 Indoles could effectively suppress acute hepatic injury caused by SEB through downregulation of miRNAs miR-31, miR-125b, miR-200c, miR-34a, miR-679, and miR-181d, promoting caspase-2-mediated apoptosis, and inhibiting proinflammatory cytokines INF-γ, IL-2, and IL-6 levels in the serum and liver mononuclear cells.29 Besides, expressions of CD44 and/or CD44v7 isoform contributed to SEB-activated liver mononuclear cell apoptosis.30 Moreover, hepatic cell apoptosis might be related to necrosis, and massive hepatocyte apoptosis was likely the initiating step of acute hepatic necrosis in mice, as shown in results of study by Yin, et al.31 In this study, we pointed out that miR-222-3p was abundantly induced in the serum from SEB-injected mice and the culture supernatant of splenocytes ex vivo, suggesting that upregulation of miR-222-3p might be attributed to the pathogenesis of SEB-induced liver injury. Moreover, our data showed that increased numbers of splenocytes accompanied with promoted levels of inflammatory cytokines INF-γ, TNF-α, IL-2, and IL-6 was the foundation of liver injury after SEB challenge, which was overall inhibited by downregulated miR-222-3p. Therefore, we summarized that miR-222-3p could protect liver against SEB-induced injury. Notably, miRNAs exhibited a suppressive role in SEB-induced liver injury through targeting mRNAs, for example, miR-185/colony stimulating factor,27 miR-31/caspase-229 and miR-222-3p/SOCS1, in this study. Also, there was an inconsistent finding of TNF-α release under SEB treatment. According to data from Busbee, et al.29, TNF-α was not detected in the serum from mice exposed to SEB for 24 h, while we observed highly expressed TNF-α in the serum of SEB-induced mice at 24 h. They applied C57BL/6 mice with 20 mg of D-gal for 30 min, followed by injection of 40 µg of SEB, whereas we utilized C57BL/6 mice with 20 mg of D-gal for 1 h and later with 40 µg of SEB. Therefore, more experiments should be performed to confirm this issue.
miR-221 and miR-222 are homologous miRNAs located on chromosome X; therefore, miR-221/222 is considered as a cluster of miRNA.9 Recent studies have reported that miR-221/222 cluster is important in many human diseases, including liver disease. In liver, miR-221/222 were shown to be involved in liver fibrosis and tumorigenesis.3233 Besides, an inverse correlation between SOCS1 expression and miR-221/222 expression in liver tissue or in serum was verified by Yu, et al.21 in rats. In their investigation, SOCS1 regulated hepatic regenerative response by indirectly decreasing downstream molecules miR-221/222 via Met in vitro. However, they did not explore whether miR-221/222 could in turn affect SOCS1 expression. Later, Li, et al.34 uncovered that miR-221/222 targeting SOCS1 and cyclin-dependent kinase inhibit 1B contributed to the aggressiveness in control of basal-like breast cancer cells, as demonstrated by suppressed cellular migration, invasion, and G1/S transition of the cell cycle. In the current study, we verified the target relationship between miR-222 and SOCS1 in splenocytes using in silicon data on targetScan software and luciferase reporter assay. Moreover, we showed that downregulation of SOCS1 could block the suppressive effect of miR-222-3p knockdown in SEB-induced inflammatory injury in splenocytes, suggesting miR-222/SOCS1 axis might partially mediate the protective molecular mechanism in SEB-induced liver injury. However, we had not investigated the role of miR-221 in SEB-induced liver injury, as well as its mechanisms. Considering these results, miR-222-3p/SOCS1 axis seems to participate in different types of cells, and this hypothesis need more evidence.
Dysregulation of SOCS1 has been reported in SEB-mediated injury. For example, Plaza, et al.26 showed that SOCS1 mRNA levels were sharply and substantially increased in splenocytes from mice after SEB injection for 1.5 h, and the high levels remained for 18 h. Rao, et al.25 not only indicated that lymph nodes cells obtained from naive WT mice expressed significantly higher level of SOCS1 when activated with SEB for 24 h, but also suggested that abundant increase of SOCS1 occurred in lung-infiltrating mononuclear cells from miR-155 KO mice exposed to SEB. In vitro, they further identified miR-155 targeted and downregulated SOCS1 to promote pro-inflammatory cytokine INF-γ production. In this study, we also observed lower level of SOCS1 in splenocytes after SEB incubation for 24 h. Moreover, we further discovered the role of SOCS1 in inflammatory response. As a result, pcDNA-SOCS1 transfection dramatically attenuated the numbers of splenocytes and levels of inflammatory cytokines INF-γ, TNF-α, IL-6, and IL-2 with SEB incubation. These results showed that SOCS1 overexpression could suppress inflammatory injury in splenocytes exposed to SEB, implying its protective role in SEB-induced liver injury. Notably, we also noticed pcDNA-SOCS1 transfection itself probably showed little effect on inflammation response without SEB challenge, suggesting that SOSC1 overexpression showed no cytotoxic effect in splenocytes. Furthermore, an upstream regulator of SOCS1 was figured out in modulating liver injury. miR-222-3p targeted and negatively regulated SOCS1. It is well-known that SOCS1 is induced by cell signal factors and acts as negative regulator of signaling pathways such as JAK-STAT, TLR, and NF-κB pathway.353637 This study was limited as it did not determine these signaling pathways underlying SOCS1 role in SEB-induced liver injury.
In conclusion, we successfully constructed a mice model of liver inflammatory injury using SEB. Expression of miR-222-3p was highly induced by SEM in the serum of mice and splenocytes ex vivo, accompanied by increased pro-inflammatory cytokines INF-γ, TNF-α, IL-6, and IL-2 and infiltrating immune cells in liver. Our results showed miR-222-3p targeting SOCS1 in suppressing SEB-induced liver inflammatory injury. This study is the first to provide information on miR-222-3p in liver injury activated by SEB, offering novel evidence of miR-222-3p/SOCS1 axis in SEB toxicity and liver disease.
 XML Download