

 PDF
PDF ePub
ePub Citation
 Print
Print


INTRODUCTION
Renal cell carcinoma (RCC) is the most common malignant tumor in the kidney, accounting for 85% of renal tumors. The incidence of RCC has increased at a rate of 2% annually for the past two decades.1 Small RCC is diagnosed more frequently due to abdominal imaging, such as ultrasonography, and computed tomography (CT) is used more widely for various medical disorders.2 Renal tumors of ≤7 cm that are confined to the kidney are graded as stage T1, according to the guidelines of the 7th Edition of the American Joint Committee on Cancer (AJCC) Cancer Staging Manual.3 Some clinical T1 stage RCC tumors invade renal sinus fat up to 15.4%.456 Renal sinus fat is a fatty area within the kidney that contains many vessels and lymphatic channels, and is not separated from the renal cortex by the capsule. Tumor invasion into renal sinus fat may increase the risk of metastasis, and is related to poor prognosis.78 RCC with sinus fat invasion (SFI) is defined as stage T3a, according to the tumor, node, and metastases system.3
CT is one of the most widely used modalities for characterizing and staging renal tumors. Multidetector computed tomography (MDCT) has allowed radiologists to overcome the limitations of single-detector helical CT by providing volume data that can be reformatted in various planes, which helps to determine the boundaries of complex renal tumors. However, MDCT provides only limited information for predicting pathological SFI in renal tumors.9
C-reactive protein (CRP), a serum marker for systemic inflammation, was recently reported as a good prognostic marker in patients with RCC.1011 However, CRP data are not readily available for all patients, as it requires additional serum testing. Therefore, other systemic inflammatory markers, such as lymphocyteto-monocyte ratio or neutrophil-to-lymphocyte ratio (NLR), have been used in many studies.1213 NLR correlates well with serum CRP levels,13 and it is easily calculated from a complete blood count with differential by dividing the absolute neutrophil count by the absolute lymphocyte count. NLR has been reported to predict oncological outcomes in patients with RCC.1415 In this study, we aimed to evaluate whether NLR could predict pathological SFI in RCC of ≤7 cm that appeared to invade the renal sinus fat on preoperative imaging.
MATERIALS AND METHODS
Patient selection
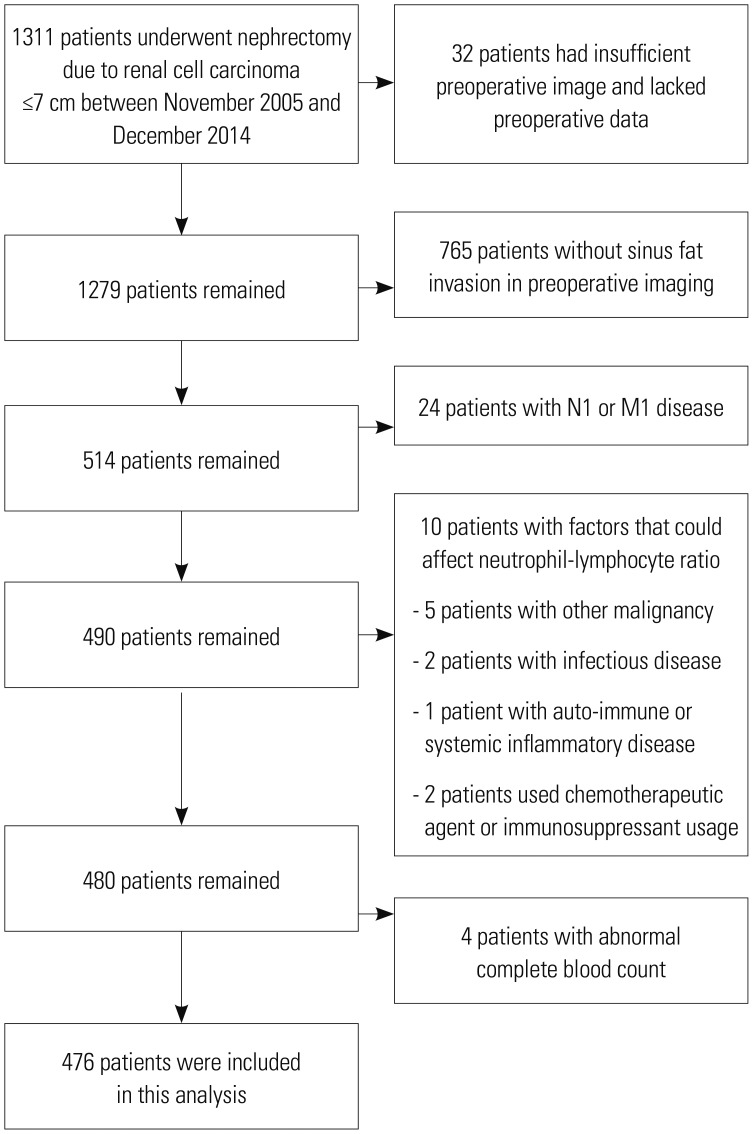
We retrospectively reviewed the medical records of 1311 patients who underwent partial or radical nephrectomy for RCC of ≤7 cm between November 2005 and December 2014. After the patients with insufficient preoperative image for diagnosing SFI and lacked preoperative data, patients who did not have SFI in preoperative imaging and were diagnosed with node positive or metastatic (N1 or M1) disease were excluded. Patients also were excluded if they had any factors that could affect NLR, including simultaneous diagnosis of other malignancy, infectious disease, autoimmune or systemic inflammatory diseases, and the use of chemotherapeutic agents or immunosuppressants. Patients also were excluded if they had abnormal complete blood count. Our institution sets the normal range of haemoglobin levels from 14.0 g/dL to 17.4 g/dL in men and 11.7 g/dL to 16.0 g/dL in women, white blood cell range from 4000/µL to 10800/µL, and platelet range from 150000/µL to 400000/µL. Finally, 476 patients were enrolled in our study (Fig. 1). We evaluated the age, gender, body mass index (BMI), hypertension, smoking status, preoperative NLR, radiological information from preoperative CT, and pathology results. Preoperative NLR was calculated by dividing the absolute neutrophil count by the absolute lymphocyte count, which were obtained from routine laboratory tests within 1 month before nephrectomy. Retrospective data collection was approved by the Institutional Review Board of the Yonsei University Health System (Approval No. 4-2018-0215).
CT data interpretation
CT images were obtained using a 64-slice detector (Sensation 64, Siemens, Erlangen, Germany) to identify renal tumors with SFI. One senior uro-radiologist (Young Taik Oh) and one senior urologist (WS Ham) retrospectively reviewed and evaluated the CT images, independently. They were informed that all patients included in the study were diagnosed with RCC, although no information was given about the size, location, stage, or renal sinus involvement of the tumor. Interobserver variation was evaluated using Cohen's kappa statistical analysis; the kappa coefficient was 0.95 (p<0.05), indicating a high coincidence of SFI diagnosis between the two reviewers. If the reviewers had different opinions regarding SFI, the final decision was reached after both reviewers reviewed the images together. The anatomical characteristics of tumors were collected based on the preoperative aspects and dimensions used for an anatomical (PADUA) classification, which contains SFI information. The criteria used for SFI diagnosis on preoperative imaging included tumor extension into the renal sinus, proximity to the pelvicalyceal system, and invasion of the pelvicalyceal system. Collecting system involvement on preoperative imaging was defined as a renal tumor infiltrating or dislocating a collecting system.16
Pathology analysis
Pathology outcomes were obtained by reviewing medical records and previous pathology reports that had been prepared by a single genitourinary pathologist (Nam Hoon Cho) at Yonsei University. Pathological SFI was defined as direct contact of cancer cells with the renal sinus stroma or fat cells. Tumors infiltrating the pelvicalyceal system were also classified as SFI. Tumors confined by a pseudocapsule bulging into renal sinus fat without clear evidence of infiltration were not classified as SFI.
Statistical analysis
Baseline characteristics of patients and tumors were compared between patients with no SFI and those with SFI using descriptive statistics. Mann—Whitney U-test and Fisher's exact test were used to compare continuous and categorical variables, respectively. Binomial logistic regression analysis was used to identify factors associated with pathological SFI. A receiver operating characteristic (ROC) curve was used to analyse the ability of NLR to predict pathological SFI. After identifying the predictors of pathological SFI, we plotted ROC curves including all factors related to pathological SFI, and another set of ROC curves with all covariates except NLR. We compared the area under the curve (AUC) of the two ROC curves to determine the predictive ability of NLR. Recurrence-free survival (RFS) was compared using Kaplan—Meier curves with log-rank test. Statistical analysis was performed using SPSS version 25 (IBM Corp., Armonk, NY, USA).
RESULTS
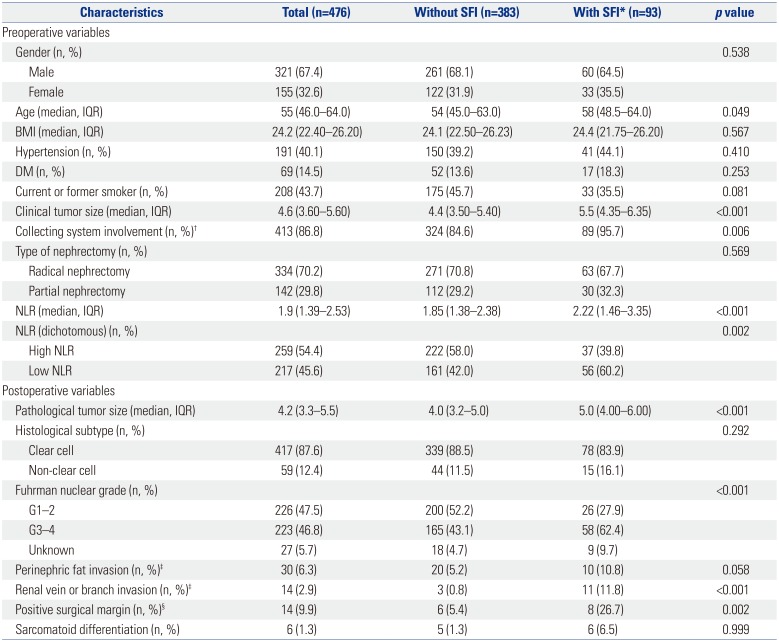
Table 1 presents the clinical and pathological characteristics of patients. There were 321 male and 155 female patients with a median age of 55 years [interquartile range (IQR) 46.0–64.0]. The median clinical tumor size was 4.6 cm (IQR 3.6–5.6). The median value of NLR was 1.90 (IQR 1.39–2.53). SFI was observed in 93 of the 476 patients. NLR cut-off value was determined as 1.98, which was calculated by ROC analysis. AUC based on SFI was 0.615. NLR was evaluated as a dichotomised variable by dividing the observed cases into two groups (NLR <1.98 and NLR ≥1.98).
Although the tumors of all 476 patients were presumed to invade the renal sinus fat on preoperative imaging, only 93 patients (19.5%) had pathological SFI. Older patients were more likely to have pathological renal SFI, and clinical tumor size was larger in the pathological SFI group (5.5 cm vs. 4.4 cm, p<0.001). Collecting system involvement on preoperative CT was more frequently observed in SFI group (95.7% vs. 84.6%, p=0.006). The median preoperative NLR value was higher in SFI group (2.22 vs. 1.85, p<0.001). There was no difference in the rate of partial nephrectomy (PN) between the two groups (32.3% vs. 29.2%, p=0.569), but the incidence of positive surgical margin was higher in SFI group (26.7% vs. 5.4%, p<0.001) among patients underwent PN. The pathology results for SFI group showed larger tumor size (5.0 cm vs. 4.0 cm, p<0.001) and higher rate of high-grade (Fuhrman nuclear grade 3–4) RCC (62.4% vs. 43.1%, p<0.001). SFI group also had more renal vein involvement (11.8% vs. 0.8%, p<0.001).
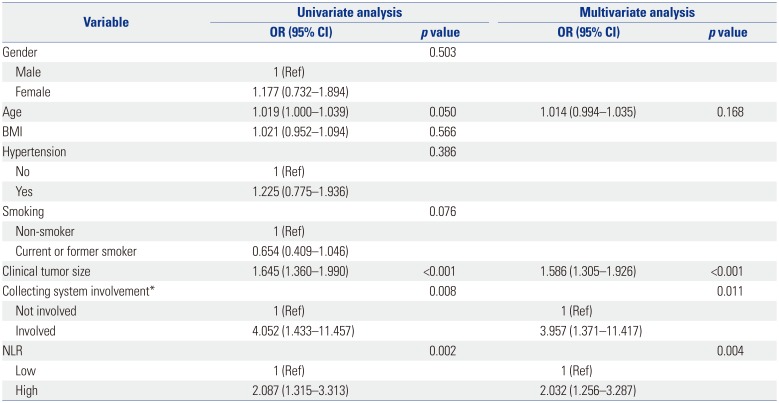
We performed univariate binary logistic regression analysis to evaluate preoperative factors associated with pathological SFI in these tumors, and found that age [odds ratio (OR)=1.019, 95% confidence interval (CI) 1.000–1.039, p=0.05], clinical tumor size (OR=1.645, 95% CI 1.360–1.990, p<0.001), collecting system involvement on preoperative imaging (OR=4.052, 95% CI 1.433–11.457, p=0.008), and NLR (OR=2.087, 95% CI 1.315–3.313, p=0.002) were associated with SFI. In multivariate analysis, clinical tumor size (OR=1.586, 95% CI 1.305–1.926, p<0.001), collecting system involvement on preoperative imaging (OR=3.957, 95% CI 1.371–11.417, p=0.011), and high NLR (OR=2.032, 95% CI 1.256–3.287, p=0.004) were independent predictors of pathological SFI (Table 2).
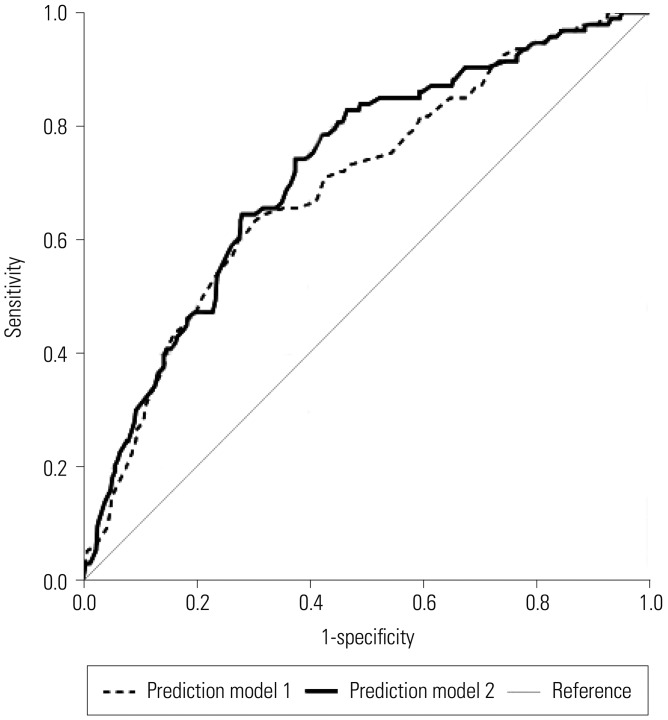
To assess the predictive power of NLR, we defined prediction model 1 to include clinical tumor size and collecting system involvement, whereas prediction model 2 included an additional factor of preoperative NLR. Then, we compared the AUCs of these two predictive models, which were 0.693 and 0.720 for model 1 and model 2, respectively (Fig. 2).
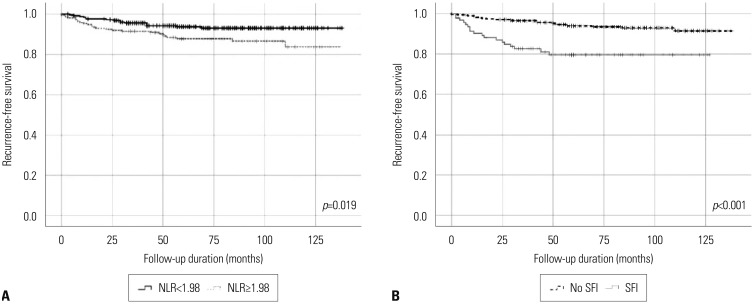
Fig. 3 showed Kaplan-Meier curves of RFS according to NLR and pathologic SFI. With median follow-up 79 months, 5-year RFS was worse in high NLR group (87.8% vs. 93.8%, p=0.019) and having pathologic SFI group (79.5% vs. 93.9%, p<0.001).
DISCUSSION
Renal sinus is a cavity within the kidney that is formed by extension of the perinephric space into the deep recess located at the medial border of the kidney. Major branches of renal artery and vein along with the major and minor calices of collecting system are located within the renal sinus. Renal sinus also contains abundant lymphatic channels with adipose tissue and nerve fibres.8 Unlike perirenal tissue, renal sinus is not separated from the renal cortex by a capsule. Therefore, tumor invasion into the renal sinus means that the tumor has higher chance to spread. Many studies showed that renal sinus invasion has poor prognosis. Thompson, et al.7 reported that the survival rate of patients who had RCC with SFI was poorer compared to patients who had RCC without SFI. Bertini, et al.17 assessed the impact of renal sinus fat sinus invasion on oncological outcome in pT3a clear cell RCC, and found that SFI was significantly negatively associated with cancer-specific survival in patients without lymph node or distant metastasis.
Since renal sinus invasion is associated with oncological outcome, predicting SFI is important to predict the prognosis of RCC patients. CT is the gold standard imaging modality for diagnosing RCC, and it provides information such as tumor size, location, and the anatomy of adjacent structures. CT may help to diagnose T stage, but it is limited for diagnosing renal sinus invasion.18 Some studies reported that CT sensitivity ranged from 71.0–81.8% and CT specificity ranged from 71.0–91.7%.919 In our study, only 19.7% of patients had pathological SFI.
NLR is a prognostic factor in numerous cancers including RCC, although the specific mechanism for this relationship is not completely understood. Several studies reported that chronic inflammation has a key role in carcinogenesis.20 Neutrophils play a major role in pro-tumoral activity by secreting substances such as derivatives of reactive oxygen species or vascular endothelial growth factors,21 whereas lymphocytes reflect cell-mediated immunity with antitumoral properties.22 Therefore, high NLR potentially contributes to aggressive tumor biology and progression and poor survival.
Other studies showed that tumor-derived inflammation can increase myelopoiesis with defective myeloid cell differentiation and proliferation by regulating the bone marrow and spleen, leading to the accumulation of immature myeloid cells in the peripheral circulation.23 Myeloid cells play a critical role in tumor pathogenesis by promoting cancer cell proliferation, tumor angiogenesis, cell invasion, and metastasis. In the case of cancer-mediated myelopoiesis, myelocytes and promyelocytes (neutrophil precursors) proliferate are released into the peripheral blood. Neutrophils are the most abundant granulocytes, which account for most peripheral white blood cells.24 Therefore, the prognostic and predictive value of peripheral neutrophils as an independent index or as part of NLR in cancers is apparent, and enhanced neutrophil responses and/or lymphocyte suppression, leading to a high NLR, might promote tumor progression and inhibit the antitumor immune response.
Many studies demonstrated that NLR was a biomarker with a prognostic value for RCC. Sejima, et al.25 reported an association between NLR and local Fas ligand (FasL) expression. FasL is a surface receptor involved in cell apoptosis via the action of cytotoxic T cell. Low NLR was correlated with a high expression level of FasL, which was related to improved overall survival (OS). In locally advanced or metastatic RCC, higher preoperative NLR was associated with poorer OS in many studies.2627 The study by de Martino, et al.14 reported that high preoperative NLR was associated with poorer disease-free survival (DFS) in patients with localized RCC. Viers, et al.15 also showed that preoperative NLR was a significant prognostic factor of OS and DFS in localized RCC. Therefore, we assessed whether NLR could predict pathological SFI, which is related to worse oncological outcomes, in cancers with few predictive factors of SFI. In this study, preoperative NLR was associated with pathological SFI, tumor size, and collecting system involvement on preoperative imaging. Adding preoperative NLR to our predictive model, along with tumor size and collecting system involvement on preoperative imaging, increased the AUC from 0.693 to 0.720. This indicates that preoperative NLR is helpful, although limited, in diagnosing SFI.
Our results showed that 29.8% of patients with suspected SFI underwent PN. In our institution, the surgical method for RCC is usually determined by the surgeon's preference, and some faculties have performed PN for renal masses more than 4 cm or presumed SFI for many years. We previously reported equivalent oncological outcomes for PN and radical nephrectomy when clear surgical margins can be obtained in these tumors.18 Therefore, if SFI is suspected on preoperative imaging with high NLR, there should be greater intention for the surgeon to secure negative surgical margins during PN.
Our study had some limitations. First, due to the study's retrospective and non-randomized nature, some selection bias may have occurred in our results. We tried to overcome this limitation by allowing the two reviewers to judge the presence of SFI from preoperative images without informing them of the patients' SFI outcome. However, our criteria for SFI diagnosis were liberal, as only 19.5% of the enrolled cases had pathological SFI in clinical T3a stage tumors. This result means that it is not sufficient to diagnose SFI using only preoperative CT, and also implies that other predictors for SFI are needed. The long duration of study could also be a limitation. Our study included patients who underwent surgery over a period of more than 10 years, during which there would have been some progress in the technique of imaging. We tried to overcome this disadvantage by excluding patients with images of insufficient quality to read SFI. We did not perform a second review of the pathology specimen, although it is difficult to diagnose SFI with specimen obtained by PN. This was due to our policy that the retention period of specimens obtained after surgery is 10 years, and the majority of old formalin-fixed paraffin-embedded tissue were difficult to read due to poor quality. This might have been a reason for our clinical over-staging. Our results were derived using data from Severance Hospital, so it may not be generalizable. Further prospective and multicenter studies are needed to confirm our results.
In conclusion, preoperative high NLR, along with tumor size and collecting system involvement, on preoperative imaging was associated with pathological SFI in patients with RCC of ≤7 cm with presumed SFI on preoperative imaging. Patients with these preoperative findings require greater attention to obtain negative surgical margins during PN.
 XML Download