

 PDF
PDF ePub
ePub Citation
 Print
Print


INTRODUCTION
Clear cell renal cell carcinoma (ccRCC) is the most potentially lethal subtype of renal cell carcinoma (RCC) and accounts for 94% of metastatic RCCs.123 Early diagnosis of ccRCC is difficult, and by the time it is identified, it typically has already metastasized in 30–35% of patients.4 In early stage patients (stages I and II), most ccRCCs are treated by resection via surgery, with survival rates over 5 years greater than 70%, while as for patients in stages III (regional spread) and IV (metastatic), which have a poor prognosis, survival rates at 5 years are only 50% and 10%, respectively.567 Therefore, predictive methods with high specificity and sensitivity may improve the prognosis of patients.
Important targets in cancer research, cancer initiation and proliferation are regulated by epigenetic modifications.8 As one of the basic mechanism of epigenetic modification, DNA methylation plays as a pivotal role in the processes of chromatin structure regulation and gene regulation.9 Abnormal DNA methylation was reported to show a significant relationship with the occurrence and prognosis of various cancers.10 Dubrowinskaja, et al.11 demonstrated that neurofilament heavy (NEFH)-specific hypermethylation in RCC is relevant to overall survival rates among patients undergoing targeted therapy. Mir-874, which is downregulated in breast cancer, is correlated with the prognosis of breast cancer.12 Zhang, et al.13 demonstrated that decreased of mir-874 expression is mediated by DNA methylation of the promoter region and that DNA methylation is directly related to the prognosis of breast cancer. Furthermore, DNA methylation of specific genes has already been used as biomarkers in early diagnosis and prognosis,14,15 such as aldehyde dehydrogenase 1 family member A3 (ALDH1A3) promoter hypermethylation in glioma CpG island methylator phenotype-primary glioblastoma16 and hypomethylation of cyclin dependent kinase inhibitor 2A (CDKN2A) in colon cancer.17 Moreover, for patients with stage I non-small cell lung cancer, a shorter relapse-free survival rate has been found to be associated with higher methylation levels of CpG sites within five genes (HIST1H4F, PCDHGB6, NPBWR1, ALX1, and HOXA9).18
It was reported that ccRCC typically shows features of epigenetic alterations and methylated CpGs accompanying progress of disease,1920 although a specific prognostic model has not been proposed. This study analyzed whole-genome methylation profiles for ccRCC in The Cancer Genome Atlas (TCGA) database to identify potential biomarkers for predicting survival times for ccRCC patients.
MATERIALS AND METHODS
DNA methylation information for ccRCC tissues in the TCGA dataset
The DNA methylation information of ccRCC (platform: Illumina Human Methylation 27; downloaded in March 27, 2019; depending on GRCh38, the genomic coordinates of the CpGs were gained) and relevant clinical data were obtained from the TCGA database (https://cancergenome.nih.gov/). No further approval from the Ethics Committee was requested due to the data being obtained from the TCGA dataset. We studied how DNA methylation levels impacted survival in ccRCC using dates reported in survival records of the patients. β values were used to express DNA methylation levels, and M/(M+U) was computed. In M/(M+U), M is defined as the signal from methylated beads, while U is defined as the signal from unmethylated beads at targeted CpG sites. Ultimately, 215 samples comprised 96 ccRCCs of grade 2, 82 of grade 3, and 28 of grade 421 and 113 of stage I, 27 of stage II, 49 of stage III, and 25 of stage IV.22 In total, 23171 DNA methylation sites were selected in this work, and samples with relevant clinical records were obtained from the TCGA dataset. According to the TCGA series number, these 215 samples were assigned into a training dataset (60%) and a validation dataset (40%): one was used for discriminating and designing prognostic markers, while the other was applied to prove the precision of the biomarkers in survival prediction.
Prognostic identification and choosing CpG sites
Detection of methylation signatures was performed by means of the computing environment R with Survival package (R version 3.5.1; Revolution Analytics, Mountain View, CA, USA). First, methylation markers (p<0.05) found to be closely related to patient survival were defined as candidate markers through univariate Cox proportional hazard analysis. Then, robust likelihood-based survival analysis modeling and multivariable Cox regression analysis was applied to further screen for CpG sites.23
Establishment and validation of risk scores
We established risk scores for prognosis-related CpG sites by means of estimation of the regression coefficients in the multivariable Cox regression analysis of the training set. p values were characterized using the Wilcoxon rank-sum test, followed by false discovery rate correction. Then, we ranked the samples according to the risk score. We drew cross-validated time-dependent receiver operating characteristic (ROC) curves to verify the prediction accuracy of this model and to develop an effective optimal threshold. Based on this threshold, the samples were classified into high- and low-risk groups. Thereafter, cumulative survival time was calculated by a nonparametric statistic (Kaplan-Meier estimator), with a log-rank test (Mantel-Cox). Also, differences between the two groups in overall survival time were compared. Furthermore, the risk score system was evaluated by fitting in the checking set and the complete set. Also, by using different regrouping methods, we predicted the performance of the DNA methylation signature.
RESULTS
Collection of data from TCGA
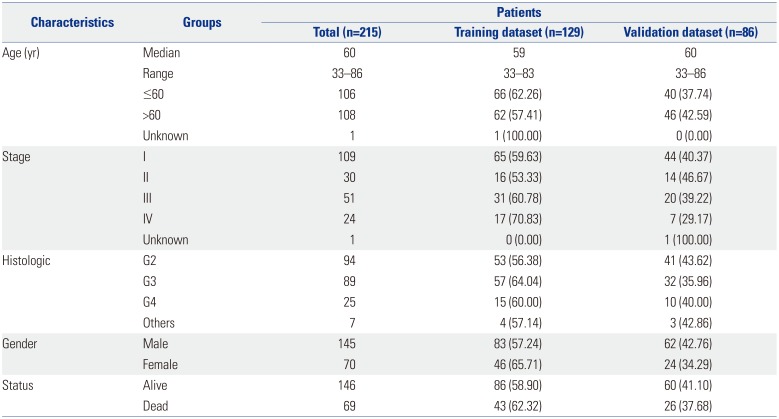
The study was performed as indicated in Fig. 1. In total, 23171 DNA methylation sites were collected for 215 patient samples from the TCGA DNA methylation and clinical dataset. The median age of the patients was 60 years (range, 33–86 years), and the median survival time was 2386 days. The patients were randomly assigned to a training set (n=129, used to identify key CpG sites) and to a testing set (n=86, used to verify the methylation signature) based on status (alive/dead). The clinical data, including age, sex, ethnicity, stage, and status, are listed in the Table 1.
Screening and identification of DNA methylation markers in the training dataset
Methylation levels were used as variables in the training dataset to identify DNA methylation markers related with ccRCC, and based thereon, univariate Cox proportional hazard regression analysis and robust likelihood-based survival analysis were performed. The first 19 significant prognosis-related CpG sites were chosen (p<0.001, Supplementary Table 1, only online). Next, the 19 CpG sites of prognostic significance were put into multivariable Cox regression survival analysis to further screen CpG sites in order to identify an optimum prognostic model for predicting ccRCC. Finally, two methylation sites (cg18034859, cg24199834) in the hazard ratio (HR) model were identified; their risk coefficients are listed in Table 2. cg24199834 was indicated as a risk factor with a HR of 1.03, while the methylation level of cg24199834 was inversely proportional to the risk of death, with an HR of 0.78, indicating that cg18034859 was a protective factor. Accordingly, we developed the following risk score formula: Risk score=-0.2455×β value of cg18034859+0.0304×β value of cg24199834. The formula demonstrated that the hypermethylation levels of cg24199834 are associated with higher risk, while the hypomethylation levels of cg18034859 are related to lower risk.
Evaluation of the predictive performance of the two-DNA methylation signature
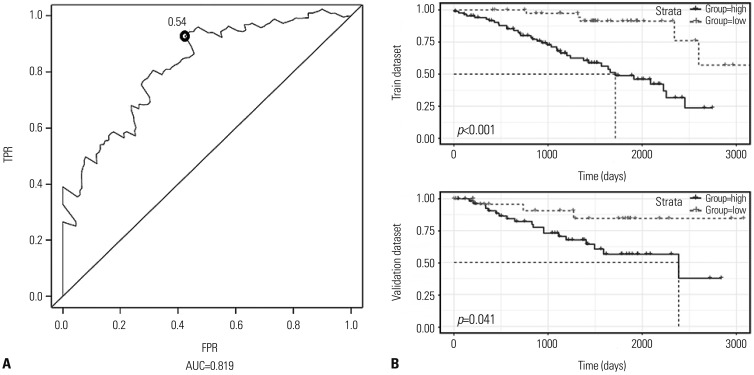
After screening, 0.54 was identified as the optimal threshold cut-off point, exhibiting the best performance (Fig. 2A). The area under the curve of ROCs (AUC) for the two-DNA methylation signature was 0.819, indicating a favorable prognostic value in prediction of patient survival. Then, the training dataset was divided into high-risk (n=87) and low-risk groups (n=42). Kaplan-Meier survival analysis was applied to compare the survival time of the two groups. The results indicated that patients in the high-risk group had shorter survival time than the low-risk group. A significantly worse prognosis was embodied in the high-risk group (p<0.001, Fig. 2B). To further validate the prognostic ability of the two-DNA methylation signature, we divided the validation dataset into high-risk (n=58) and low-risk groups (n=28). Similar to the above, the high-risk group had significantly shorter survival time in Kaplan-Meier survival analysis (Fig. 2B). Fig. 3A shows the risk score distribution and the scatter plot of patient states, with higher risk corresponding to more deaths. Heat mapping depicts the methylation levels of cg18034859 and cg24199834 between the two groups for the entire dataset. Significantly higher methylation levels for cg24199834 were confirmed, while the opposite was true for cg18034859 (Fig. 3B).
Predictive performance of the two-DNA methylation signature
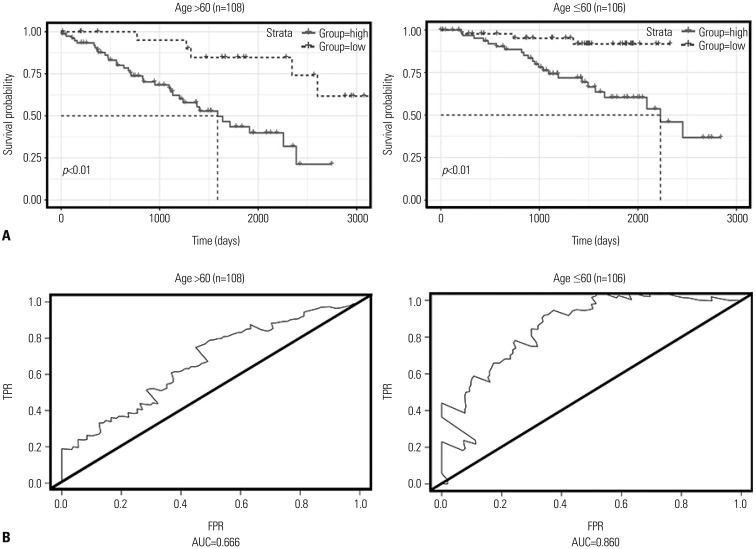
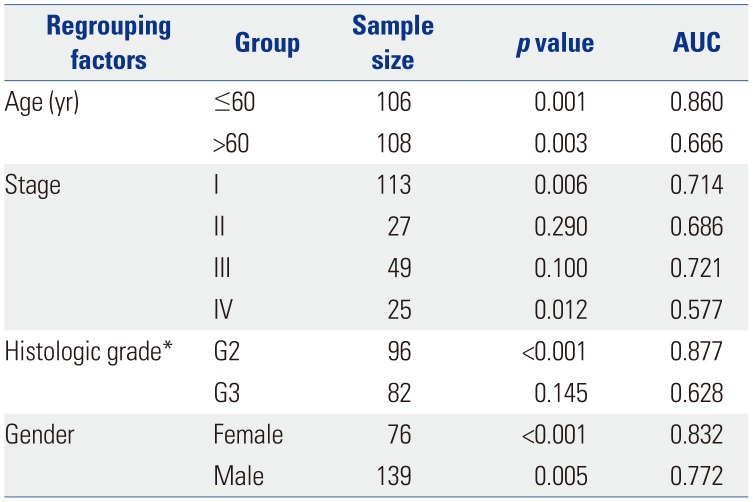
Studies have reported that age,24 sex,25 pathological stage,26 and histologic grade etc.27 are associated with prognostic survival. Accordingly, all patient samples were regrouped according to clinicopathological characteristics, and the two-DNA methylation signature was validated separately in the different groups. First, the effect of the two-DNA methylation signature among the different age groups of patients (based on survival status, “alive” used the final follow-up time; otherwise the time of death): ≤60 (n=106, 49.53%) and >60 (n=108, 50.47%) years were analyzed (Fig. 4A). From Kaplan-Meier curves, we found that the overall survival of patients in different risk groups differed between the two age cohorts (p<0.01), and AUC values were 0.860 in patients younger than 60 years old and 0.666 in patients older than 60 years old (Fig. 4B), exhibiting the independent relationship between the two-DNA methylation signature and age. Ricketts, et al.25 found that the spread of ccRCC among the sexes is distinctly uneven. Sex may affect mutation spectra and hold implications for prognosis. A summary analysis of age, sex, pathological stage, and histologic grade is listed in Table 3. The two risk groups both in male and female patients (p<0.01) reflected obviously distinct survival times, and the AUCs for male and female sex were 0.772 and 0.832, respectively. Taking the sample number into account, we verified the predictive value of the two-DNA methylation signature in G2 (n=96) and G3 (n=82), with correlated AUC values of 0.877 and 0.628. About one quarter of the patients showed distant metastasis at initial diagnosis, and our results showed that overall survival was significantly different between the risk groups in pathological stage IV patients (p=0.01). The AUCs in stages I, II, III, and IV cohorts were 0.714, 0.686, 0.721, and 0.577, respectively. From the above results, the two-DNA methylation signature was proven to be an independent applicable value for predicting patient survival.
DISCUSSION
A lack of effective and reliable prognostic biomarkers or models remain the focus of ccRCC research. Studies have demonstrated that molecular markers, including DNA methylation, can be used to predict the prognosis of ccRCC.28293031 Compared to using individual DNA methylation factors as predictors, combinations of DNA methylation could achieve higher sensitivity and specificity.32 In the present study, we generated a risk score model based on a two-DNA methylation signature significantly related to ccRCC prognosis in Cox regression and ROC analysis. Median survival time was used to divide high- and low-risks groups, which has more clinical practicability than median risk score. Calculating patient risk scores could be helpful to predict the probability of patients reaching median survival time. Time-dependent ROC curves showed that our two-DNA methylation signature has stable and good performance in prognosis prediction. The model could distinguish different risk groups with totally varied survival time, which was verified in training and validation datasets. Independent grouping tests showed that, the two-DNA methylation signature possessed independent predictive value from age and sex, and was more suitable to forecast survival time for patients in stage I and G2.
Compared to other acquainted prognostic markers, it is found that the two-DNA methylation signature possesses noticeable higher sensitivity and specificity in predicting ccRCC prognosis. Zhan, et al.28 reported a five-gene prognostic model to predict prognosis in ccRCC, with an AUC of 0.783. The sixlncRNA signature identified in a previous study33 was described as a prognostic biomarker of ccRCC, with an AUC of 0.696. In this study, low- and high-risk groups could be well distinguished by way of the two-DNA methylation signature. Also, the two-DNA methylation signature performed well in associated log-rank tests, confirming its independent predictive value for patient survival.
Exploring another database (http://genome.ucsc.edu/), we found cg18034859 and cg2419834 are located in the promoter regions of myosin light chain kinase 2 (MYLK2) and POU class 4 homeobox 2 (POU4F2) genes, respectively, indicating the potential influence of its methylation on gene expression. POU4F2 is a member of the POU-domain transcription factor family, which is involved in determining the fate of retinal ganglion cells (RGCs) and initiating RGC differentiation.34 The methylation levels of POU4F2 were quantified by quantitative methylation-specific PCR using urine sediment DNA from another study, and the researchers generated a two-DNA methylation signature [combination of POU4F2 and protocadherin 17 (PCDH17)] for bladder cancer. The model showed high sensitivity and specificity of 90.00% and 93.96%, respectively, reflecting the ability of detecting bladder cancer effectively among pathologically varied sample groups.35 Moreover, urinary levels of POU4F2 hypermethylation were considered to be having a bearing on non-muscle invasive bladder cancer recurrence, which is in good association with our results for a high DNA methylation level of cg2419834 at POU4F2.36 In addition, gene expression levels of POU4F2 in ccRCC were not detectable based on Gene Expression Profiling Interactive Analysis (GEPIA, http://gepia.cancer-pku.cn/index.html) and TCGA database (data not shown). Meanwhile, MYLK2 encodes a calcium/calmodulin-dependent serine/threonine kinase and is a risk factor for the development of acute lung injuries.37 Soung, et al.38 reported that MYLK2 does not play a significant role in cancer pathogenesis because the kinase domain of MYLK2 is rarely mutated in common human carcinomas. The gene expression data of MYLK2 were downloaded from TCGA, while the clinical data of ccRCC were the same. We merged and ranked samples according to the expression levels of MYLK2 and divided them into high-expression (n=89) and low-expression groups (n=89). Kaplan-Meier survival analysis methods exhibited a difference in survival time between high-expression and low-expression groups: the survival time of patients in the high-expression group was significantly shorter (p=0.028) (Supplementary Fig. 1, only online). The results indicated that MYLK2 may be an independent prognostic marker of survival for patients with ccRCC.
In conclusion, we discovered that the survival time of patients is greatly affected by a two-DNA methylation signature, which was detected from genome-whole analysis of DNA methylation data for 215 samples with ccRCC, and the significance for patients of varying ages, sex, stages, and histologic grades was confirmed. The two-DNA methylation signature could play an important role as a prognostic marker for forecasting the survival time of patients with ccRCC. In the future, research may want to focus on a functional mechanism for the two-DNA methylation marker and its potential association in carcinogenesis.


 XML Download