

 PDF
PDF ePub
ePub Citation
 Print
Print


Introduction
Artemisiae Argyi Folium is the dried leaves of asteraceous plant Artemisia argyi Lev. et Vant. This plant is a famous medicinal drug in some Asia countries known for treatment of eczema, diarrhea, hemostatis, and tuberculosis.1 In Korean herbal Pharmacopoeia, Artemisiae Argyi Folium was defined into different species such as Artemisia argyi Lev. et Vant., Artemisia princeps Pampanini, and Artemisia montana Pampani. While in Chinese Pharmacopoeia, this herbal medicine and food supplement was known as Artemisia argyi Lev. et Vant.2 Conversely, Artemisiae Iwayomogii Herba is a different species in Artemisiae genus, derived from aerial parts of Artemisia iwayomogi Kitamura (Compositae). This herb containing the yellow flowers is a perennial aromatic plant and distributed in Korea. The pharmacological activities of this plant and its constituents revealed effects of immediate-type allergic reactions and anti-inflammatory cytokine secretion,34 antimicrobial,5 antioxidant,6 and antifibrotic effects.7 Artemisiae Iwayomogii and Artemisiae Argyi Folium have been widely used, and Artemisiae Iwayomogii Herba is misused as Artemisiae Argyi Folium in the Korean herbal drug markets. However, that is difficult to discriminate these two herbal drugs based on their morphological features, when they are dried or divided into pieces states. Previously, some studies described the methods to identify some Artermisia species by using marker compounds such as chlorogenic acid (1), 3,5-di-O-caffeoylquinic acid (5), 1,5-di-O-caffeoylquinic acid (6), and eupatilin (8),8 chlorogenic acid (1), hyperoside (3), 3,4-di-O-caffeoylquinic acid (4), 3,5-di-O-caffeoylquinic acid (5), 4,5-di-O-caffeoylquinic acid (7),9 3,5-di-O-caffeoylquinic acid (5), and 4,5-di-O-caffeoylquinic acid (7)10 in which, the chromatograms did not display sufficient resolutions among peaks. Thus, the quantification of these marker compounds in samples may not reveal exact amounts in samples. Until now, there is no study on discriminating Artemisiae Argyi Folium and Artemisiae Iwayomogii Herba by HPLC/PDA method using all above standards (1 – 8). Herein, we described the HPLC developed method for quantification, validation, and identification of two herbal drugs by using eight marker compounds. Pattern analysis was performed by using software of IBM SPSS Statistics Version 22.
Experimental
Standards and samples
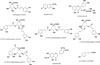
The standards of eight marker compounds (1–8) including chlorogenic acid (1), scopoletin (2), hyperoside (3), 3,4-di-O-caffeoylquinic acid (4), 3,5-di-O-caffeoylquinic acid (5), 1,5-di-O-caffeoylquinic acid (6), 4,5-di-O-caffeoylquinic acid (7), and eupatilin (8) (Fig. 1) were obtained from Chengdu Biopurify Phytochemicals Co., LTD, China. Methanol and acetonitrile (ACN) solvents were purchased from Fisher Scientific Korea Ltd. All other chemicals were used of analytical grade. HPLC water was prepared with Milli-Q purification system (Millipore, Bedford, USA). Eleven samples of ArtemisiaeArgyi Folium (A01–A11) and fifteen samples of Artemisiae Iwayomogii Herba (I01–I15) were collected from different regions and provided by Prof. Young Ho Kim, College of Pharmacay, Chungnam National University, Korea. Among them, samples A01, A03, A05–A07, A09 and A10 were collected from Korea, and the other samples A02, A04, A08, and A11 were collected from China. In addition, fifteen samples (I01–I15) of Artemisiae Iwayomogii Herba were also collected from different regions in Korea.
HPLC instrument and chromatographic conditions
The quantification and validation methods were experimented on an HPLC chromatography (Waters, Houston, TX, USA) equipped with a photodiode array (PDA) detector at 25 ℃. The HPLC components were conducted by using an auto-sampler, degasser, and quaternary solvent pump for quantitative analysis. The eight marker compounds and samples were conducted by using a Kinetex C18 column (4.6 × 250 mm, 5 µm particle size; Phenomenex Torrance, CA, USA) with a C18 RP guard column (10 × 3.2 mm, particle size 5 µm); flow rate of 1 mL/min; injection of 10 µL. The detection was performed with an ultra-violet (UV) detector at wavelength of 327 nm. The mobile phase was consisted as a solvent system of phase A (water containing 0.3% formic acid) and phase B (ACN) with gradient elution as following: 12.5 – 20% (B) for 0 – 18 min, 20–40% (B) for 18 – 35 min, and 40 – 100% (B) for 35 – 40 min and held for 10 min. The column was then re-equilibrated with 12.5% (B) until the end of analysis.
Method validation
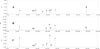
Compounds 1 – 3 revealed the UV absorption maxima at 325, 228, 343, and 353 nm. While compounds 4 – 7, dicaffeoyl derivatives, displayed the strong UV maximum absorption at 327 nm. Thus, the wavelength of 327 nm was used for detecting of eight marker compounds (1 – 8) in the method. The mobile phase consisted of water containing 0.3% (v/v) of formic acid was used as phase A, and acetonitrile was used as phase B. The gradient solvent elution system was used as follow: 12.5 – 20% (B) for 0 – 18 min, 20–40% (B) for 18 – 35min, and 40 – 100% (B) for 35 – 40min. Meanwhile, p-coumaric acid was used as an internal standard with retention time of 13.5minutes and eight marker compounds (1 – 8) were clearly separated without overlapping of adjacent peaks according to above analytical condition (Fig. 2). The identification of these standards in the samples was determined by obtaining relative retention times as well as UV absorbance in comparison with that in the standard mixture at the same analytical condition. The validation parameters of the developed HPLC-PDA method were linearity, limit of detection (LOD) and limit of quantification (LOQ), accuracy, precision, stability, and robustness. The LOD values were relatively expressed for the lowest concentration that could be detected at a signal-to-noise (S/N) ratio of 3. The LOQ values were calculated by using S/N ratio of 10. The stock solutions were diluted to make seven working solutions with different concentration for each compound. Linearity was determined by plotting the measurement of peak areas (analyte/I.S.) and calculating correlation coefficients (r2) from calibration curves.
Preparation of calibration standard solutions
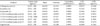
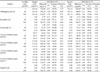
We checked the purities of all marker compounds (1 – 8) which their structures were shown in the Fig. 1. Results indicated that these marker compounds were reached over 97% of purity according to absorbance on the HPLC/PDA system. Standard stock solutions were exactly prepared for each analytical standard and internal standard (I.S.) at concentration of 1000 µg/mL and diluted with MeOH to obtain concentrations for content determination. These standard solutions were kept in brown glass vials of 10 mL filmed by plastic film (Parafilm, Chicago, IL, USA) and stored in a refrigerator (4 ℃) for analysis. Linearity was validated at seven different concentrations of each analyte in range of 0.625 to 500 µg/mL for compound 1, 0.625 to 200 µg/mL for compounds 2 – 4 and 6 – 8, and 25 to 2000 µg/mL for compound 5. Each analyte was analyzed at triplicated times at independent manners. Linearity regression was built for calibration curves with the correlation coefficients ranging from 0.9959 to 0.9998. The LOD and LOQ values were ranging from 0.0490 to 0.2403 µg/mL and 0.1365 to 0.8013 µg/mL, respectively (Table 1). This information expressed the well sensitivity of analysis method.
Sample preparation and extraction method
The dried sample was grinded into powder or pieces followed by sieving through a 250 µm2 sieve to ensure required sample homogeneity. The mixture solvent system was used as following: 30% methanol, 50% methanol, 70% methanol, 100% methanol, and 50% ethanol, 70% ethanol and 100% ethanol containing 20 µg/mL I.S. These solutions were analyzed by HPLC/PDA using above conditions of UV and mobile phase. Based on the quantity of standards amount per I.S., the extraction solvent of 50% methanol was selected. Then, this solvent system was further used for extraction of sonication and reflux method. With the high amount of calculated method according to standard peak area/I.S. area, the sonication extraction was selected for experiment. After that, extraction time was examined for 30, 45, 60, 75, and 90 minutes by sonication at room temperature. Results indicated that the analytes in sample were obtained at the same amounts for 60 and 75 minutes. Therefore, extraction time was controlled for 60 minutes. Thus, the extraction method was used as solvent system of 50% methanol containing 20 µg/mL I.S. by sonication for 60 minutes.
Precision and Accuracy
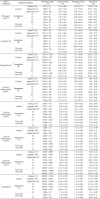
Intra-day (n = 5) and inter-day (n = 5) precisions were calculated by calculating low, medium, and high concentrations of working solutions of each marker compound. Values are represented as the relative standard deviation (RSD) as follows: RSD = [(SD/mean) × 100]. The precision experiment was performed by six successive injections, and the precisions were less than 2.18% in intra-day and 3.13% in inter-day. The accuracies of the method were in the range 89.76 – 114.97% in intra-day and 81.92 – 114.72% in inter-day, respectively. The method validation revealed that the obtained regression equations were linear for the marker compounds and this method was precise, accurate, and reliable for quantification of the eight marker compounds (1 – 8). The accuracy of the HPLC method was performed by spiking the known amounts of analytes into extract solution of Artemisiae Argyi Folium. After addition of known amounts of each analyte to the previously analyzed extract solution, recovery studies were examined. The results were shown in Table 2.
Robustness
The robustness is a measure of method's capability to remain unaffected small, but deliberate, variations in the method parameter. The robustness was evaluated for column species, column temperature, and flow rate. The results were shown in Table 3. Four analytical factors (N, k', α, and Rs) were compared at the column temperature of 25 ℃ with three different columns (Kinetex C18, Aegipak C18-L, and Capcell Pak C18). Results indicated some major differences in the factors depending on column. Changes in column temperatures (25, 30, and 35 ℃) were shown with the most efficiency for those factors at column temperature of 25 ℃. Different flow rates (0.8, 1.0, and 1.2 mL/min) were tested. All those factors of eight marker compounds were not significantly different. The flow rate of 1.0 mL/min exhibited the most efficiency. Thus, the optimized method was set on Kinetex C18 column at 25 ℃ with flow rate of 1.0mL/min (Table 3).
Stability
The stabilities of these marker compounds were investigated at 0, 1, 3, 7, 15, and 30 days. Under lightless temperature (25 ℃) and 4 ℃, all marker compounds (1 – 8) displayed stable with recovery ranging from 97.51 to 101.13%.
Result and Discussion
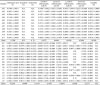
The developed analytical method was established. All peaks of marker compounds (1 – 8) revealed sufficient resolutions for all peaks and clearly expanded them to each other in the chromatogram. Therefore, each marker compound and sample was run in triplicate independently. Then, this HPLC/PDA analytical method was successfully applied to quantitate the contents of eight marker compounds (1–8) in two herbal drugs. The chromatograms and quantitative analysis results from this study may support the important information for discrimination between Artemisiae Argyi Folium and Artemisiae Iwayomogii Herba samples according to the quantities of eight marker compounds. Notably, two marker compounds, scopoletin (2) and hyperoside (3), were only found in Artemisiae Iwayomogii Herba samples with the average contents of 0.0094 and 0.1414% (w/w), respectively. While the marker compound, eupatilin (8), was only contained in Artemisiae Argyi Folium samples with the average content of 0.0390% (w/w). In addition, the average contents of other marker compounds, chlorogenic acid (1) (0.1398%, w/w), 3,4-di-O-caffeoylquinic acid (4) (0.1075%, w/w), 3,5-di-O-caffeoylquinic acid (5) (0.4004%, w/w), and 4,5-di-O-caffeoylquinic acid (7) (0.2008%, w/w), in dried weights of Artemisiae Argyi Folium samples were lower than those of chlorogenic acid (1) (0.2566%, w/w), 3,4-di-O-caffeoylquinic acid (4) (0.1493%, w/w), 3,5-di-O-caffeoylquinic acid, (5) (0.8204%, w/w), and 4,5-di-O-caffeoylquinic acid (7) (0.2537%, w/w) in Artemisiae Iwayomogii Herba samples, respectively. However, 1,5-di-O-caffeoylquinic acid (6) (0.0436%, w/w) marker compound in Artemisiae Argyi Folium samples revealed the higher content to those of it (0.0280%, w/w) in Artemisiae Iwayomogii Herba samples (Table 4). Significantly, the contents of scopoletin (2) and hyperoside (3) in Artemisiae Iwayomogii (I01–I15) Herba and eupatilin (8) in Artemisiae Argyi Folium (A01–A11) samples were relatively determined according to their different quantities detecting in these species. Therefore, these compounds may be beneficial for discriminating between Artemisiae Argyi Folium and Artemisiae Iwayomogii Herba.
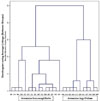
The pattern analysis of two herbal samples were experimented with by using four marker compounds including scopoletin (2), hyperoside (3), 1,5-di-O-caffeoylquinic acid (6), and eupatilin (8), and pattern recognitional tools (2D plot, Hierarchical Cluster analysis with interval Pearson's correlation and cluster between-group linkage method). From pattern plot, all the Artemisiae Argyi Folium (A01–A11) and Artemisiae Iwayomogii (I01–I15) Herba samples were successfully sorted into two groups (Fig. 3).
An accurate, precise, robust, and reliable analytical HPLC method was developed, validated, and successfully applied to quantify eight marker compounds (1 – 8) in Artemisiae Argyi Folium and Artemisiae Iwayomogii Herba samples using p-coumaric acid as an internal standard. Assays of methods are expected to be used for other herbal drugs in different species of Artemisia genus. This study successfully analyzed eight marker compounds of Artemisiae Herba as well as discriminated two species of this genus.
 XML Download