

 PDF
PDF ePub
ePub Citation
 Print
Print


Introduction
Quantitative nuclear magnetic resonance (qNMR) is a well-established technique, which international pharmacopoeias have adopted for purity and quantitative analyses of compounds. The qNMR method depends on comparing the area between one or more NMR peaks of the analyte and calibration standard (CS) to obtain the molar ratio of the analyte over the CS1 and has been applied in various fields.2345
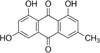
Emodin (1,3,8-trihydroxy-6-methylanthraquinone) (Fig. 1), is well known as the main active component of Fabaceae (Cassia spp.), Polygonaceae (Rheum, Rumex, and Polygonum spp.), and Rhamnaceae (Rhamnus and Ventilago spp.).6 Emodin also has various bioactivity such as antibacterial, antitumor, and antiviral activities; however it has also been reported to induce some toxic effects on the liver and kidneys.789
Various chromatographic methods have been used for the purity analysis of emodin. However, these methods have limitation because they do not detect impurity traces of solvents such as methanol, water, and ethanol, which does not have any response on other detectors such as UV, MS, and ELSD.10 Whereas, qNMR method was applied to overcome these limitations as it allows the simultaneous determination of the content of the compound and nature of the impurities.11 Also, the qNMR method is precise, time saving, structure reflecting, reproducible, and a one-step process that does not rely on targeted authentic references.121314
This study aims to optimize a qNMR method for purity analysis of emodin. The signal of emodin at δH 6.6 (H-7) was chosen for the quantification as it is well-separated from all other signals. Purity analysis of emodin by the qNMR method was validated and the result of qNMR was cross checked by using mass balance methods.
Experimental
Materials and reagents
Emodin was isolated from
Rheum rhabarbarum L., which was identified and provided by Professor Eun Kyoung Seo (Ewha Womans University, Seoul, Korea). Dimethyl sulfone (DMSO2, purity 99.73%) was used as the internal CS and was purchased from Sigma-Aldrich. Co. Ltd. (St Louis, MO, USA). Dimethyl sulfoxide (DMSO) + 0.05% V/V TMS (D, 99.9%) was obtained from Cambridge Isotope Laboratories, Inc. (Andover, MA, USA). For HPLC analysis, HPLC grade water and acetonitrile were supplied by J. T. Baker (Phillipsburg, NJ, USA). Distilled water was obtained from Youngling aquaMAX-Ultra system (Anyang, Gyeonggi-do, Korea), and formic acid was purchased from Sigma-Aldrich. Co. Ltd. For trace elements analysis, nitric acid was supplied by Daejung (Siheung, Gyeonggi-do, Korea). Merck ICP multi-element standard solution XVI and hydrochloric acid were purchased from Sigma-Aldrich. Co. Ltd.
Sample preparation
The qNMR samples were prepared using emodin and DMSO2 using the following protocol: 1.4 – 8.0 mg of emodin and 1.1 – 1.9 mg of DMSO2 were accurately weighed. Emodin and DMSO2 were dissolved in 500 µL of DMSO to form the sample solution from 0.3160 to 2.2619 (emodin/DMSO2, Table 1). All samples were transferred into 5 mm NMR tubes for analysis. For HPLC/UV analysis, emodin solutions were made at a concentration of 0.1mg/mL with methanol. Three samples (86.3, 92.6, and 98.7 mg) were accurately weighed for loss on drying analysis. For trace element analysis, three samples (22.3, 25.2, and 24.8 mg) were accurately weighed and put in glass test tubes. After then, the samples were wetted with 0.2 mL distilled water, 7.0 mL hydrochloric acid, and 2.3 mL nitric acid for acid preconditioning (hydrochloric acid to nitric acid ratio, 3 to 1). Three samples were heated to digest for 1 h at 30 ℃ and thereafter, for 2 h at 90 ℃ . After digestion, these samples were filtered through Advantec 110 mm filter paper, and the volumes of the samples were made up to 50 mL by using distilled water. Also, a Merck ICP multi-element standard solution XVI (100 ppm) was diluted to prepare five samples (100 ppm, 50 ppm, 25 ppm, 10 ppm, and 5 ppm) using 2% nitric acid for calibration.
NMR analysis
The 1H NMR spectrum was obtained by using Varian NMR systems 500 MHz equipped with 5 mm DB PFG Auto XDB Probe (Palo Alto, CA, USA). The 1H NMR spectrum was obtained under the following conditions: spectral width, 20 ppm; acquisition time, 2.0 s; relaxation delay, 16 s; pulse width, 30°; scan number, 16; and temperature, 298 K. For data processing, the NMR spectrum was phased and the integration was performed manually. The H-7 signal of emodin at δH 6.6 and the signal of DMSO2 at δH 3.0 were used for quantification. The spectra were processed in triplicate, and the average values were calculated. The purity of emodin was calculated from the following equation: where I, N, m, MW, and P denote the integration area, number of protons, gravimetric weight, molar weight and purity of emodin (x) and DMSO2 (s), respectively.

HPLC/UV analysis
HPLC analysis was performed with Waters ACQUITY UPLC (Milford, MA, USA) using a photodiode array detector with Waters Sample manager-FTN auto-sampler. An ACQUITY UPLC BEH C18 (2.1 × 100 mm, 1.7 µm) column was used and the injection volume was 2 µL. The mobile phase consisted of 0.05% formic acid in HPLC grade water (A) and acetonitrile (B) according to the following protocol: flow rate: 0.3 mL/min, 0 - 7.0min A/B (50/50) to A/B (0/100). The detection wavelength was 254 nm.
Loss on drying analysis
The volatile matter contents of emodin was measured by a Daihan Scientific dry chamber (Gwangmyeong, Gyeonggi-do, Korea). The weights of the vials and emodin were measured initially, and the three samples were placed in the drying chamber and dried under heat for 4 h at 105 ℃. After 4 h of drying, the weights of the vials and emodin were measured again. The difference in mass was used to calculate the volatile matter content.
Trace element analysis
Trace element analysis was performed with an Agilent 7700 inductively conducted plasma mass spectrometer (ICP-MS) system. The three samples and five different concentrations of ICP multi element standard solution for calibration were analyzed measuring the contents of the trace elements (Mg, Ca, Cr, Mn, Fe, Co, Ni, Cu, Zn, As, Se, Cd, Pb) based on the calibration curve.
Result and Discussion
Five different solvents, DMSO-d6, MeOH-d4, CDCl3, acetone-d6, and D2O were tested for selection of solvent. Among those solvents, D2O, MeOH-d4 and acetone-d6 were excluded for their poor solubility. CDCl3 was not chosen because of overlapping of the residual peak at 7.26 ppm. Therefore, DMSO-d6 was selected as the solvent for the qNMR testing of the purity of emodin.
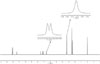
As shown in Fig. 2, emodin has seven signals in the 1H NMR spectrum (DMSO-d6): δH 12.12 (1H, s, 1-OH), 12.02 (1H, s, 8-OH), 11.37 (1H, s, 3-OH), 7.50 (1H, d, J = 1.5 Hz, H-4), 7.18 (1H, br s, H-2), 7.13 (1H, d, J = 2.4, H-5), 6.60 (1H, d, J = 2.4 Hz, H-7), 2.41 (3H, s, CH3). The signals at δH 12.12, 12.02 and 11.37 were exchangeable acidic protons, whereas those at δH 7.50 and 2.41 were overlapped by an impurity peak. The signals at δH 7.18 and 7.13 were close to each other. Among all these signals, the signal at δH 6.60 was clearly separated from the other signals of emodin. Consequently, the H-7 signal at δH 6.60 was selected for the quantification of emodin.
Nine compounds, namely 1,2,4,5-tetrachloro-3-nitrobenzene, 1,2,4,5-tetramethylbenzene, benzoic acid, duroquinone, 3,5-dinitrobenzoic acid, dimethylsulfone, potassium phthalate monobasic, calcium formate and maleic acid, were tested for use as the CS. Among them, 1,2,4,5-tetrachloro-3-nitro-benzene, 1,2,4,5-tetramethylbenzene, duroquinone, 3,5-dinitrobenzoic acid, potassium phthalate monobasic, and calcium formate were excluded because of their low solubility in DMSO-d6. Benzoic acid and maleic acid were not chosen because the signals of emodin at δH 7.48 (H-4) and δH 6.51 (H-7) overlapped with the benzoic acid signal at δH 7.5 and maleic acid signal at δH 6.2. On the other hand, DMSO2 was soluble in DMSO-d6 and the signal at δH 3.3 did not overlap with the signals of emodin in the 1H NMR spectrum. Therefore, DMSO2 was selected as the CS for the quantification of emodin.
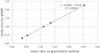
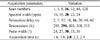
As can be seen from Fig. 2, no other signals are overlapped by the signal at δH 6.60 (d, H-7), and the 2D NMR data, including the HSQC technique confirmed that the signal at δH 6.60 is clearly separated. Therefore, the H-7 signal at δH 6.60 can be specifically used for quantification. To identify linearity, five model samples containing emodin and DMSO2 in different molar ratios were used. The molar ratio of emodin to DMSO2 determined by qNMR versus the gravimetric molar ratio is shown in Fig. 3. Linear regression yielded a correlation coefficient of 0.999 and a regression line of y = 0.8906x + 0.0111. The precision of the qNMR method was processed by six replicate measurements of the same sample continuously. The value of the relative standard deviation (RSD) was found to be within 0.09%, indicating good precision. The reproducibility of the qNMR method was performed by using six sample solutions of emodin and DMSO2 with different molar ratios independently and determined from the RSD values. The values of the RSD were found to be within 0.14%. All the data discussed above are summarized in Tables 2 and 3. Stability was monitored for 48 h at room temperature (298 K) by analyzing the same sample solution (emodin, 2.9 mg; DMSO2, 1.9 mg) at a 12 h interval. The value of the RSD was within 0.13% (Table 4). The accuracy of an analytical method expresses the closeness of agreement between the experimental and theoretical values of the molar ratio and is estimated by the recovery test. In this study, the recovery tests were performed by comparing the experimental and theoretical values with linearity samples. The average recovery was 98.49% and the RSD value was within 0.74% (Table 1). To evaluate the robustness of the method, all the important acquisition parameters such as pulse width (P1), acquisition time (AQ), spectral width (SW), relaxation delay (D1), scan numbers (NS), and temperature were examined stepwise in various ranges. Table 5 shows all the parameters after being processed and their variations. All the spectra were processed in triplicate, and the average values were calculated. RSD values were calculated using these average values.
Relaxation delay (D1) depends on the longitudinal relaxation time (T1). Generally, D1 is required to be five times larger than the longest T1 of the quantification protons when a 90° pulse is used.12 and the T1 values of the signals of DMSO2 at δH 3.0 and emodin at δH 6.60 were found to be 3.01 s and 2.84 s, respectively. The parameters of D1 were set by increasing and decreasing the value by 20% with 16 s (5× 3.01 s) as the central value. The values such as 2, 4, 40, and 60, which are very short and very long, were also included for checking the reliability. For D1 of 2, 5, 12, 14, 16, 18, 20, 40, and 60 s, the area ratio of emodin versus DMSO2 decreased for D1 increasing from 2 to 16 s and after 16 s became invariant. Therefore, D1 was set to be 16 s. The number of scans is one of the main parameters that is set when the signal to noise ratios are over 250.12 In this experiment, the scan numbers were varied as 1, 4, 8, 16, 32, and 64 to achieve sufficient sensitivity, and 16 scans were found to be sufficient. Temperature was set at room temperature (298 K), because the area ratio did not show significant difference from 293 K to 313 K. Moreover, the values of spectral width, pulse width, and acquisition time had no significant effect on the area ratio with the RSD values of 0.012%, 0.012% and 0.014%, respectively. Therefore, the spectral width, pulse width and acquisition time were set at average values (20 ppm, 30°, and 2.0 s, respectively).
Purity analysis of emodin was performed by using the qNMR method, followed by verification by using the HPLC/UV method. The average purity values of emodin analyzed by qNMR and HPLC-UV were in 90.45% and 96.57%, respectively. However, qNMR and HPLC-UV results had significant differences so that purity analysis of emodin was crosschecked by the mass balance method. The contents of organic impurities, volatile matter, and trace elements determined by the mass balance method are 3.43%, 4.92% and 0.17%, respectively. The average value of the purity of emodin as measured by mass balance method was 91.48%. These results corresponded closely with the results obtained by qNMR. The results are summarized in Table 6.
In this study, the purity analysis of emodin by applying qNMR was established and clearly validated. With this approach, the purity of emodin was easily and precisely analyzed. Furthermore, the results of qNMR analysis were compared with the HPLC-UV method; the difference between the results of qNMR and HPLC/UV was more than 6.1%. The reason behind the difference was the contents of volatile matter and trace elements, which did not have a response in the UV. For that reason, the purity of emodin determined by qNMR was crosschecked by the mass balance method. The purity analysis results using both the methods are in good agreement, with the bias less than 1.1%. Moreover, this methodology can provide several advantages for purity analysis of emodin. Firstly, qNMR method is easy and rapid because it just requires a short time and sample preparation is simple. Secondly, it is more specific, because the analysis is based on structure information and proton signals. Lastly, qNMR could recover the samples and did not require specific pure reference standards so that it has considerable potential for the purity analysis of natural products, which are not readily available. Therefore, qNMR is a valuable and reliable method for purity analysis of emodin.


 XML Download