Abstract
Purpose:
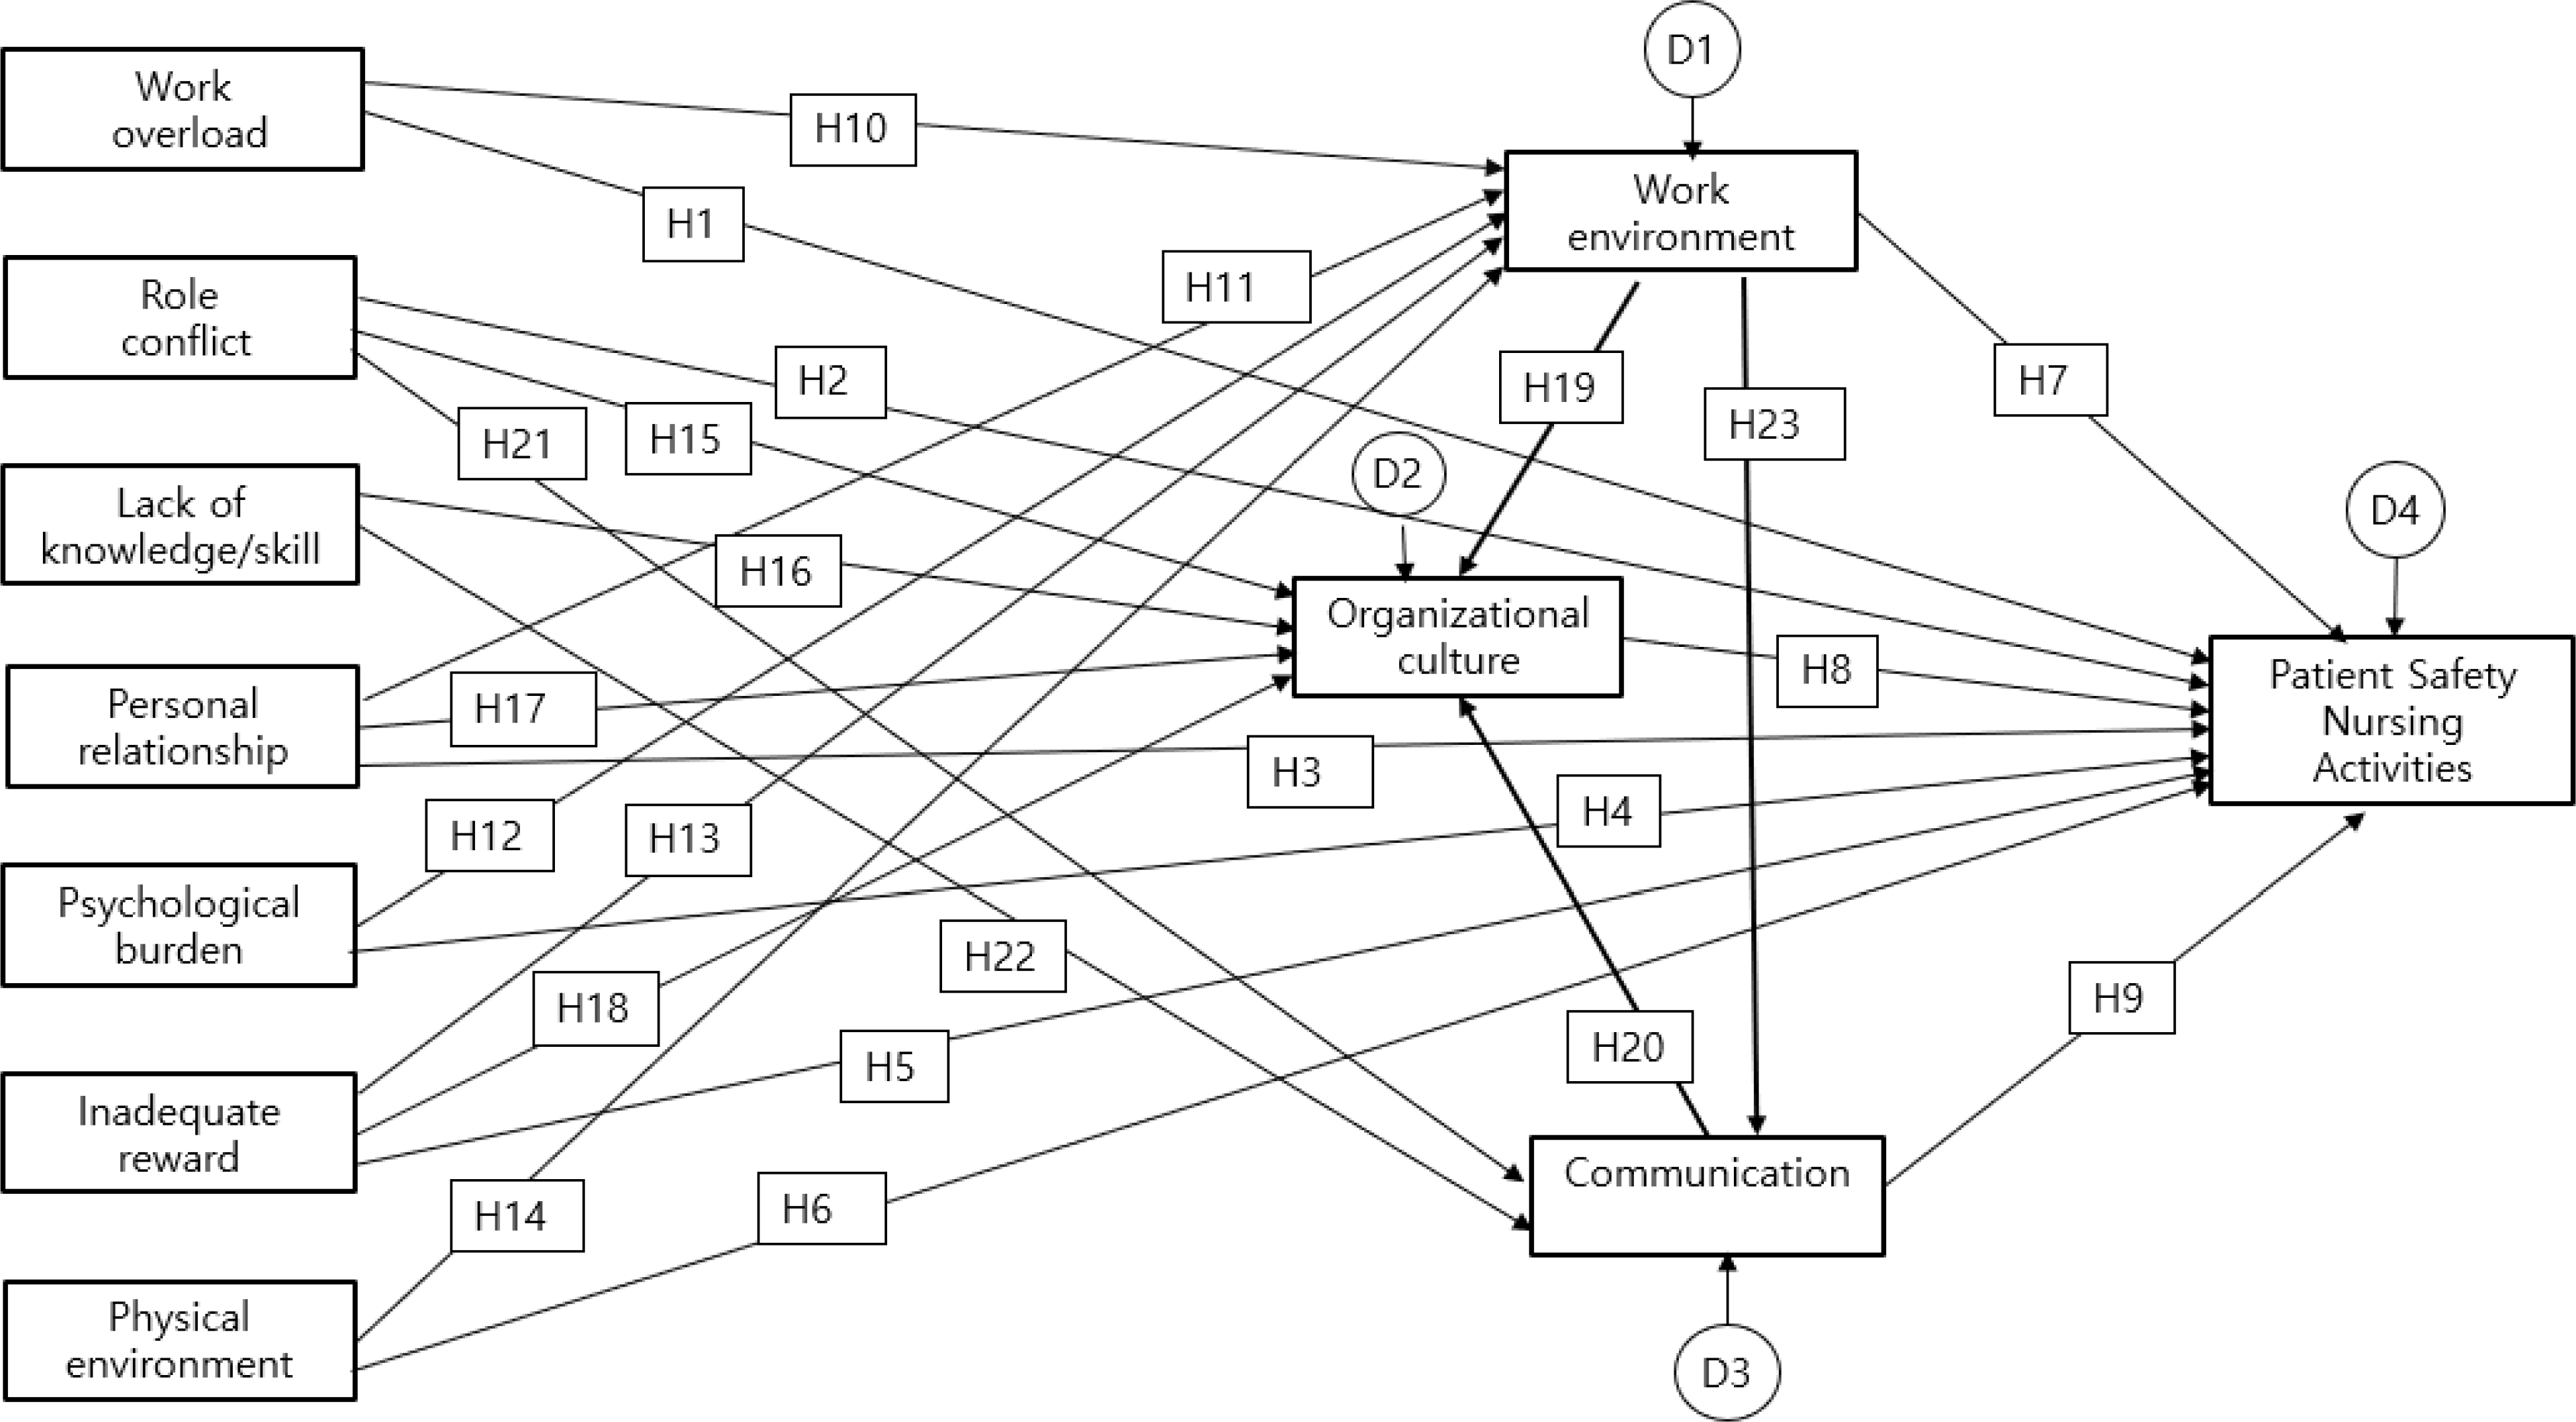
The objective of this study was to explore the causal relationships among staff nurses' job stress factors, patient safety culture perception, and patient safety nursing activities through path analysis.
Methods:
The participants, 275 staff nurses with over a year of experience working at a university hospital in Seoul, completed structured questionnaires. The data were collected from January 5 to February 28, 2018. The data analysis included descriptive statistics, t-test, ANOVA, Scheffé test and Pearson correlation coefficients using the SPSS/WIN 24.0 program, and path analysis & bootstrapping using AMOS 24.0 program.
Results:
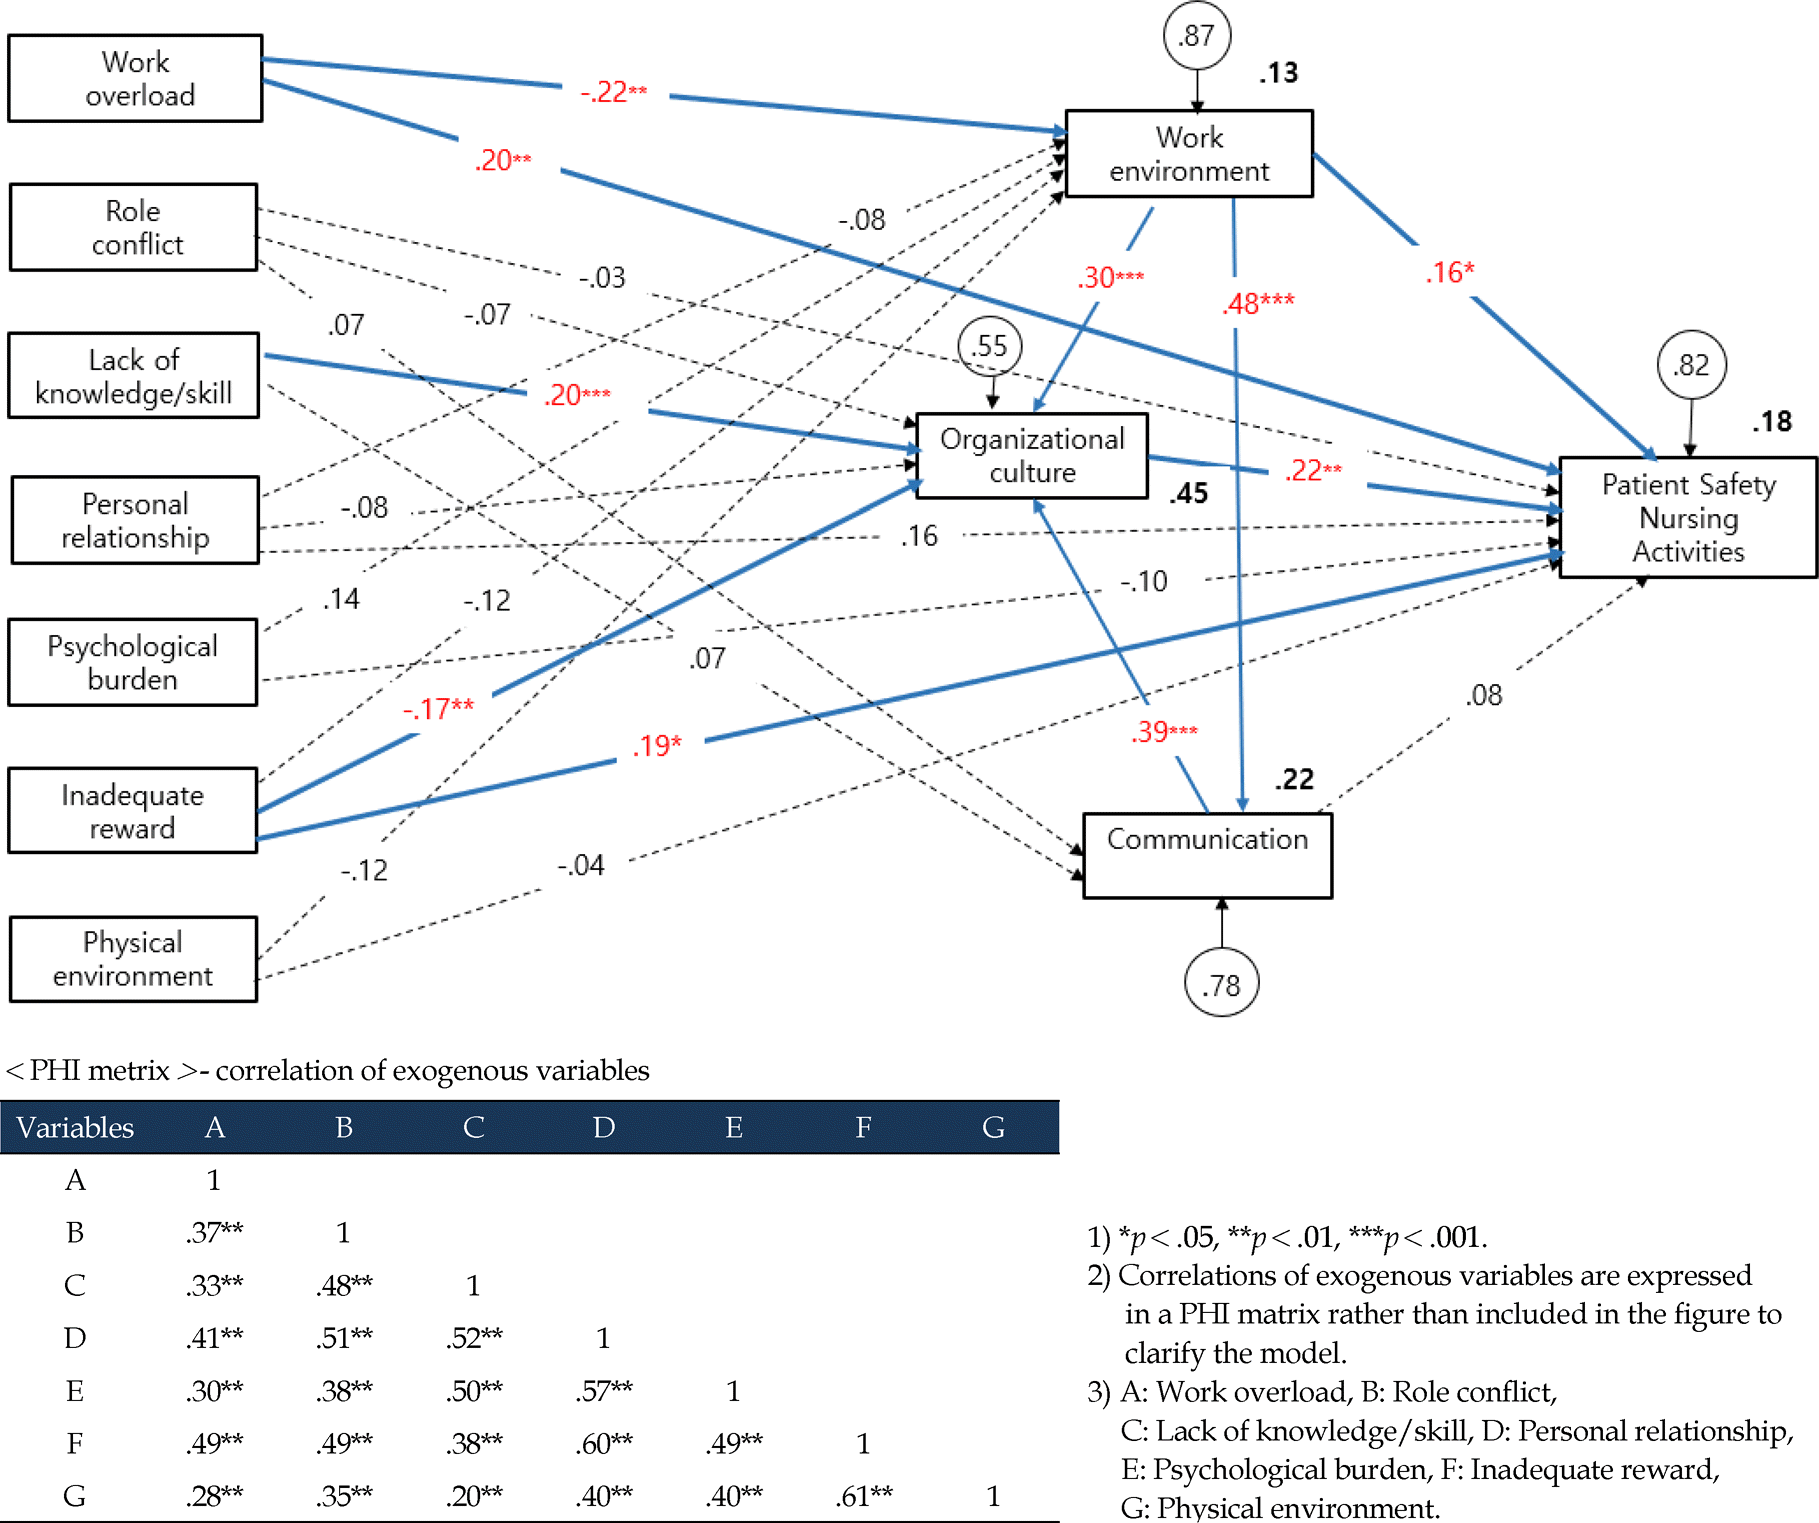
The path analyses of the hypothesized causal model showed a considerable explanatory power for each of the endogenous variables. About 45 percent of organizational culture was explained by work overload, lack of knowledge/skill, inadequate reward, work environment, and communication. The finding in this study confirmed the mediating effect of patient safety culture perception on the relationships between job stress factors and patient safety nursing activities.
Go to : 
REFERENCES
1. World Health Organization. Conceptual framework for the international classification for patient safety version 1.1: final technical report January2009. Geneva: World Health Organization;2010.
2. Wachter RM. Understanding patient safety. 2nd ed.New York, NY: McGraw-Hill Medical;2012.
3. Kim MR. Concept analysis of patient safety. Journal of Korean Academy of Nursing. 2011; 41(1):1–8. https://doi.org/10.4040/jkan.2011.41.1.1.

4. Sorra J, Gray L, Streagle S, Famolaro T, Yount N, Behm J. AHRQ Hospital survey on patient safety culture: User's guide. (Prepared by Westat, under Contract No. HHSA2902013000 03C). AHRQ Publication No. 15-0049-EF (Replaces 04-0041) [internet]. Rockville, MD: Agency for Healthcare Research and Quality;[updated January. 2016. cited March 01, 2019] Available from:. http://www.ahrq.gov/sites/default/files/wysiwyg/professionals/quality-patient-safety/patientsafetyculture/hospital/resources/hospcult.pdf.
5. Jeong J, Seo YJ, Nam EW. Factors affecting patient safety management activities at nursing divisions of two university hospitals. Korean Journal of Hospital Management. 2006; 11(1):91–109.
6. Ammouri AA, Tailakh AK, Muliira JK, Geethakrishnan R, Al Kindi SN. Patient safety culture among nurses. International Nursing Review. 2015; 62(1):102–110. https://doi.org/10.1111/inr.12159.

7. Kim JE, Kang MA, An KE, Sung YH. A survey of nurses' perception of patient safety related to hospital culture and reports of medical errors. Journal of Korean Clinical Nursing Research. 2007; 13(3):169–179.
8. Kim Y, Lee ES, Choi EY. Perception of patient safety culture of hospital nurses. Korean Journal of Hospital Management. 2013; 18(3):27–42.
9. Sammer CE, Lykens K, Singh KP, Mains DA. Lackan NA. What is patient safety culture? A review of the literature. Journal of Nursing Scholarship. 2010; 42(2):156–165. https://doi.org/10.111/j.1547-5069.2009.01330.x.
10. Jung SH, Choi ES. The impact of job stress on the patient safety nursing activity among nurses in small-medium sized general hospitals. Korean Journal of Occupational Health Nursing. 2017; 26(1):47–54. https://doi.org/10.5807/kjohn.2017.26.1.47.

11. Song EJ, Park YS, Ji HS, Lee HK. Factors affecting on the clinical nurse's safety nursing activity. Journal of Digital Convert-gence. 2016; 14(11):469–479. https://doi.org/10.14400/JDC.2016.14.11.469.

12. Nam MH, Kang SH. The cognition level on the patient safety and safety nursing activities among hospital nurses in Busan. Health and Social Science. 2010; 12(28):197–221.
13. Cho HA, Shin HS. A systematic review of published studies on patient safety in Korea. Journal of Korean Academy of Dental Administration. 2014; 2(1):61–82.
14. Ulrich B, Kear T. Patient safety and patient safety culture: Foundations of excellent health care delivery. Nephrology Nursing Journal. 2014; 41(5):447–456. 505.
15. Choi JH, Lee KM, Lee MA. Relationship between hospital nurses' perceived patient safety culture and their safety care activities. Journal of Korean Academy of Fundamentals of Nursing. 2010; 17(1):64–72.
16. Jung YI, Park IT, Lee SG, Choi YK. Assessing patient safety culture in Korean healthcare organizations. Seoul: Korea Institute for Healthcare Accreditation;2015.
17. Choi SR, Jung HS. Meta analysis about the causal factors and the effect of job-stress of clinical nurses. Korean Journal of Occupational Health Nursing. 2005; 14(1):71–82.
18. Choi KL, Heo SE, Moon DH. Convergence study on the influence of job stress of shift work nurses on nursing performance. Journal of the Korea Convergence Society. 2016; 7(4):107–121. https://doi.org/10.15207/JKCS.2016.7.4.107.

19. Kang JS, Lim JY. Effects of clinical nurses' resilience on job stress and burnout. The Journal of the Korea Contents Association. 2015; 15(11):263–273. https://doi.org/10.5392/jkca.2015.15.11.263.

20. Han KM, Kim TY. The effect of emotional labor, job stress and way of coping on the organizational commitment of nurses in a general hospital. Korean Journal of Stress Research. 2015; 23(1):39–48. https://doi.org/10.17547/Kjsr.2015.23.1.39.

21. Jang HM, Park JY, Choi YJ, Park SW, Lim HN. Effect of general hospital nurses' perception of patient safety culture and burnout on safety management activities. Journal of Korean Academy of Nursing Administration. 2016; 22(3):239–250. https://doi.org/10.11111/Jkana.2016.22.3.239.

22. Kim MJ, Gu MO. The development of the stresses measurement tool for staff nurses working in the hospital. Kanho Hakhoe Chi. 1984; 14(2):28–37.
23. Choi YJ. A study on the related factors of organizational commitment in hospital nurses [dissertation]. Seoul: Hanyang University;2009.
24. Cho YJ. A study on perception and performance for patient safety management in intensive care unit nurses [master's thesis]. Suwon: Ajou University;2012.
25. Jang HE. Song YS, Kang HY. Nurses' perception of patient safety culture and safety control in patient safety management activities. Journal of Korean Academy of Nursing Administration. 2017; 23(4):450–459. https://doi.org/10.11111/jkana.2017.23.4.450.
26. Woo JP. The concept and understanding of structural equation modeling. Seoul: Hannare Publishing Co.;2012.
27. Cho SD, Heo SE, Moon DH. A convergence study on the hospital nurse's perception of patient safety culture and safety nursing activity. Journal of the Korea Convergence Society. 2016; 7(1):125–136. https://doi.org/10.15207/JKCS.2016.7.1.125.

28. Kim MJ, Kim JK. A study on the relationships among perception about patient safety culture, patient safety competence, and safety nursing activities of emergency room nurses. The Journal of the Korea Contents Association. 2017; 17(10):268–279. https://doi.org/10.5392/JKCA.2017.17.10.268.
29. Bagozzi RP. Causal models in marketing. New York: Wiley;1980.
Go to : 
Table 1.
Differences between Variables according to General Characteristics (N=275)
Table 2.
Correlation between Measured Variables
Table 3.
Direct Effect, Indirect Effect and Total Effect (N=275)


 PDF
PDF ePub
ePub Citation
 Print
Print


 XML Download