

 PDF
PDF ePub
ePub Citation
 Print
Print


INTRODUCTION
Radiation therapy (RT) is critical in the management of primary thoracic malignancies, breast cancers, and lymphomas; however, radiation-induced cardiac toxicity is an important cause of morbidity and mortality in survivors.1)2)3)4) There is early development of coronary artery disease (CAD) after thoracic RT that may result in excess cardiac events and mortality.1)2)3)4)5) The incidence of ischemic cardiac events is estimated to increase linearly with mean heart dose (MHD) by 7.4% per Gray (Gy).6)7)
Radiation-related CAD often takes years or decades to manifest; therefore, most data regarding the effects of radiation on the heart are derived from patients treated using historical 2-dimensional planning techniques. Consequently, only crude estimations of the dose delivered to the heart and cardiac substructures are available.6)7) However, in the current 3-dimensional (3D) and 4-dimensional RT planning era, the precise dose to anatomic substructures can be calculated.8) Measuring radiation dose received to the coronary arteries in RT treatment plans may better predict the risk of CAD than whole heart parameters like MHD.9)10)
The purpose of this pilot study was to explore the association of CAD with coronary artery dose-volume measures from 3D RT treatment plans. All patients were treated with 3D RT treatment planning. The primary endpoints were presence or absence of coronary artery calcium (CAC) and manifestation of atherosclerosis associated with risk of a cardiac event and mortality.11)12)13)14)15) This approach will better illustrate the relationship between traditional cardiovascular risk factors, segmental coronary radiation dose volume, and coronary CAC.
METHODS
Patient cohort
After obtaining Institutional Review Board approval from 2006-2017, 20 consecutive patients who received RT to the thorax ≥ 1 year prior to undergoing CAC quantification at our institution were included in this retrospective observational study. RT must have used computed tomography (CT)-based planning to allow for reliable quantification of coronary artery dosimetry (Figure 1). Clinical data were retrospectively collected from the electronic medical record.
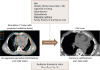 | Figure 1Comparison of 3D-RT plan CT with post-RT CAC score using CAC-DRS method. Cardiac risk factors and coronary radiation dose volumes measurements might play a role in development of atherosclerosis. 3D: 3-dimensional, CAC: coronary artery calcium, CT: computed tomography, DRS: data and reporting system, RT: radiation therapy.
|
CAC scan acquisition
CAC scans were acquired using a GE 64-slice LightSpeed VCT CT scanner (GE Healthcare, Milwaukee, WI, USA). For ECG-gated calcium scoring CT, the following protocol was used16): prospective ECG-triggering set at 75% of RR interval; scan range, carina to cardiac apex; peak voltage, 120 kVp; tube current modulation 210–500 mA; rotation time, 350 ms; temporal resolution, 175 ms; detector collimation, 64 × 0.5 mm; section thickness/increment, 2.5 mm/2.5 mm; reconstruction kernel, standard; field of view, 250 mm; matrix, 512 × 512.
Coronary artery calcium score quantification
The Agatston score method was used to quantify calcium in epicardial coronary arteries.17) Presence of calcium was defined as a plaque of ≥ 3 contiguous pixels (1 mm2) with density > 130 Hounsfield units (HU). Lesion score was calculated by multiplying the lesion area by the density factor derived from the highest HU.17) An experienced cardiac radiologist and level 3 cardiovascular CT cardiologist performed, directed, and supervised a researcher to determine CAC scores. These investigators were blinded to the radiation data. CAC scores were determined using an Aquarius Workstation (TeraRecon, Inc., San Mateo, CA, USA). To compare visual scores of RT treatment plans with CAC scans, visual CAC-data and reporting system (DRS) quantification was performed using severity categories, as previously described.18)
CAC-DRS categories
As established by an expert consensus document from the Society of Cardiovascular Computed Tomography, visual categories (V) used to assess coronary calcium burden are the following:
1. CAC-DRS V0 = no coronary calcifications seen
2. CAC-DRS V1 = mild coronary calcifications
3. CAC-DRS V2 = moderate coronary calcifications
4. CAC-DRS V3 = severe coronary calcifications
The second component in the nomenclature is the number of coronary vessels (N) with calcifications. For example, a non-gated chest CT with evident moderate coronary calcifications and calcification in 2 vessels should be assigned category CAC-DRS V2N2.
Pre-RT coronary artery calcification assessments
Patients in this cohort did not have gated-cardiac computed tomography (CCT) scans performed prior to RT. However, all patients had a non-contrast-enhanced simulation CT scan used for RT treatment planning. All simulation CT images were acquired using a large bore CT scanner. The tube potential was set at 120 kVp. Settings for tube current and exposure were set on a patient-by-patient basis per institutional protocols as a function of treatment disease site. The scan mode was helical. Burden of coronary calcification was evaluated by visual assessment of coronary calcification burden using CAC-DRS, as described by Hecht et al.18)
Radiation dosimetry
RT treatment plans were restored to the Pinnacle treatment planning system (Pinnacle3, Philips Medical Systems, Fitchburg, WI, USA). An experienced radiation oncologist who was blinded to the CAC score data contoured the heart and coronary vessels according to published atlases.8)19) Dosimetric data were retrieved from the treatment planning system.
Cardiac risk factors and dosimetric parameters
Cardiac risk factors that were considered included age, obesity (body mass index ≥ 30), history of previous cigarette smoking, hypertension, dyslipidemia, diabetes mellitus, and family history of premature coronary atherosclerosis. Dosimetric parameters were defined as: dmax = maximum dose; dmean = mean dose; Vx = volume of coronary artery receiving at least X Gy.
Statistical analyses
Spearman correlation coefficients were conducted to evaluate the correlation between CAC scores and dosimetric parameters and other continuous variables. Log transformation was performed, if needed. Data collected from all 4 coronary arteries were combined to give a total of 80 arteries in 20 patients. Analyses of these 80 arteries explored which dosimetric measures were most strongly associated with CAC score when controlling for each cardiac risk factor, age at RT, and time from RT to CCT. CAC scores were classified as either zero or non-zero, reflecting the absence or presence of calcification, respectively. Groups were compared using Fisher's exact test when appropriate. Log transformed dosimetric data and time from RT to CCT were used in the analysis. Generalized linear mixed models (GLIMMIX in SAS20)) with a binomial distribution were used to fit a logistic model that accounted for intra-subject correlation (4 coronary arteries from each patient). The predicted probabilities from GLIMMIX models were used for receiver operating characteristic (ROC) analyses. The area under the ROC curve (AUC) was computed to examine the performance of model prediction. Recursive partitioning and regression tree methods were used to identify a cut-point for continuous variables. Hypothesis tests were two-tailed. P-values < 0.05 were considered statistically significant. Analyses were conducted using SAS 9.4 (SAS, Cary, NC, USA) and S-Plus 8.2 (TIBCO Software Inc., Palo Alto, CA, USA) software.
RESULTS
Patient characteristics
The cohort was comprised of 20 patients with a total of 80 analyzed coronary arteries. As summarized in Table 1, patients were a median age of 53 years at the time of RT. The majority of patients were female (n = 14; 70%) and white (n = 13; 65%). Nine patients (45%) had ≥ 3 cardiac risk factors. Patients received RT for breast cancer (n = 10; 50%; n = 5 left-sided), lung cancer (n = 6; 30%), or lymphoma/myeloma (n = 4; 20%). Nine patients (45%) received doxorubicin, and 3 patients (15%) received trastuzumab. After RT, patients were followed for a median of 7 years (interquartile range [IQR] 6-10 years).
Table 1
Patient information
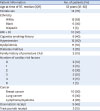
BMI: body mass index, CAD: coronary artery disease, IQR: interquartile range, RT: radiation therapy.
![]()
Pre-RT calcification assessments
Based on simulation CT scans performed immediately before RT, calcifications were present in 7 coronary arteries of 5 patients. During follow-up, one patient experienced an anterior acute myocardial infarction. The event occurred 9 years after RT. This patient had a history of hypertension, dyslipidemia, type 2 diabetes mellitus, and smoking (60 pack-years). She had pre-existing calcification of the left anterior descending artery (LAD) before RT. On a CCT performed 19 months following RT, the LAD had a CAC score of 237. This patient did not change categories when the 3D RT treatment plan CT was compared with the CAC scan using visual CAC-DRS categories. RT plan was V3N2 and CAC scan (post RT) was V3N2.
Comparison between pre-RT calcification and post-RT calcification
To compare changes in coronary calcification burden between RT treatment plans (pre-RT) with CAC scans (post-RT), CAC-DRS categories were used (Figure 2). In RT treatment plans (non-gated CT scans) there were 15 patients with CAC-DRS of 0, 3 patients in the V1N1 category, 1 patient in the V2N2 category, and 1 patient in the V3N2 category. After RT, CAC scans showed 11 patients with CAC-DRS of 0, 6 patients with V1N1, 1 patient with V3N2, and 2 patients with V3N3. All categories changed in number after RT. See Figure 3 for examples.
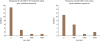 | Figure 2Changes in CAC-DRS categories in subjects (n = 20) before and after RT. Side to side comparison of changes in CAC-DRS in treatment plan (before RT) with calcium score scans (after RT). CAC: coronary artery calcium, DRS: data and reporting system, RT: radiation therapy.
|
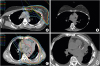 | Figure 3Axial slice from CCT scans and 3-dimensional RT plans demonstrate regional association between radiation dose and coronary calcification. (A) RT to left breast and regional lymph nodes was delivered 1 year before CCT in (B). Prescription dose was 50 Gy. This patient had history of hypertension and dyslipidemia. (B) CCT demonstrating calcification of LAD. LAD CAC score was 46.55. (C) Chemoradiation therapy was administered for non-small cell lung cancer 10 years prior to CCT in (D). Prescription dose was 70 Gy. This patient had history of hypertension, dyslipidemia, and cigarette smoking. (D) CCT demonstrating calcification of LAD and left circumflex artery. LAD CAC score was 318.05, and left circumflex CAC score was 255.43. CAC: coronary artery calcium, CCT: cardiac computed tomography, LAD: left anterior descending artery, RT: radiation therapy.
|
Radiation therapy information
The median RT prescription dose and fraction number were 60 Gy (IQR 44-66 Gy) and 30 fractions (IQR 24-33). The RT technique was 3D-conformal in 14 patients (70%), intensity modulated RT in 5 patients (25%), and proton therapy in 1 patient (5%). The MHD was a median of 3 Gy (IQR 0-13 Gy). Dose-volume parameters for each coronary artery are summarized in Table 2.
Table 2
Coronary artery dosimetry and coronary artery calcium score

Cx: circumflex, dmax: maximum dose, dmean: mean dose, IQR: interquartile range, LAD: left anterior descending, LM: left main, RCA: right coronary artery, Vx: volume of coronary artery receiving at least X Gy.
![]()
Coronary artery calcium scores
There were 9 patients with a CAC > 0 (mean age 56 years, range 29-72 years) and 11 patients with a CAC = 0 (mean age 52 years, range 36-68 years). There were no significant differences between groups regarding age at CAC scan (p = 0.29 by Wilcoxon-Mann-Whitney). CAC scans were performed at a median of 32 months after RT (IQR 20-61 months). Scans were performed either to investigate the cause of chest pain as part of a coronary CT (n = 8) or to screen asymptomatic patients (n = 12). CAC scores were assigned to each coronary artery, as summarized in Table 2. Of 80 coronary arteries in 20 patients, 14 arteries in 9 patients demonstrated calcifications (CAC > 0).
Correlation between radiation dosimetry and coronary artery calcium scores
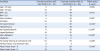
As shown in Table 3, increasing radiation exposure was associated with higher CAC scores. CAC score was significantly associated with multiple parameters, including the dmax, dmean, and V40 of coronary arteries. An association with other coronary artery dose-volume measures approached statistical significance. MHD was not significantly correlated with CAC score. In univariate analysis, MHD was not predictive of CAC.
Table 3
Correlations between coronary artery dosimetry and coronary artery calcium score

dmax: maximum dose, dmean: mean dose, LAD: left anterior descending, RCA: right coronary artery, SCC: Spearman correlation coefficient, Vx: volume of coronary artery receiving at least X Gy.
*p < 0.05, †p < 0.1.
![]()
Correlation between covariates and coronary artery calcium scores
CAC scores were significantly associated with known covariates. Most cardiac risk factors were highly associated with coronary calcification (Table 4). When analyzed as a continuous variable, CAC scores were significantly associated with the number of cardiac risk factors (left anterior descending: Spearman's correlation coefficient (SCC) = 0.7, p = 0.002; left circumflex: SCC = 0.5, p = 0.02; right coronary: SCC = 0.6, p = 0.005). Left main CAC poorly correlated with cardiac risk factors. When all 80 coronary arteries were analyzed together and CAC scores were considered as binary data (CAC score > 0 vs. CAC = 0), the number of cardiac risk factors was highly associated with CAC status (p < 0.0001).
Table 4
Risk factors by status of coronary artery calcification
![]()
Statistical modeling
Patients were grouped by presence or absence of diabetes, since this was the cardiac risk factor most associated with coronary calcification in a univariate model and with the highest odds ratio (OR) related to coronary calcification. Presence or absence of diabetes was also the only cardiac risk factor that achieved significance in the multivariate model. In a univariate logistic model including all 80 arteries, diabetes (OR, 9.26; 95% confidence interval [CI], 1.77–48.37) was the only variable significantly associated with CAC score > 0 (Table 5). Also, diabetes was the only risk factor with a trend towards significance (p = 0.05) in a multivariate generalized linear mixed model associated with presence of coronary calcification. There was a non-significant trend that age at RT was associated with CAC score on univariate analysis. The odds of CAC > 0 vs. CAC = 0 increased with age (OR, 1.07, p = 0.07). Conversely, there was no association between CAC score and time from RT to CCT (p = 0.9 based on the univariate logistic model).
Table 5
Univariate generalized linear mixed models examine association between each risk factor and coronary artery calcification

BMI: body mass index, CAD: coronary artery disease, CI: confidence interval, OR: odds ratio.
*p < 0.05.
![]()
Table 6 shows the final multivariable GLIMMIX models. These models included diabetes and coronary artery dose-volumes. CAC score was significantly associated with multiple parameters, including the coronary artery dosimetric parameters of dmax, dmean, and V50 – V5. All models were highly predictive of coronary calcification (each AUC > 0.8). The model that included V50 had the highest AUC estimate (0.89, 95% CI, 0.80– 0.97).
Table 6
Multivariable logistic models and ROC analyses explore association of radiation dosimetric parameters and presence of diabetes with subsequent coronary artery calcification
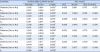
AUC: area under ROC curve, CI: confidence interval, dmax: maximum dose, dmean: mean dose, GLIMMIX: generalized linear mixed, ROC: receiver operating characteristic, Std err: standard error, Vx: volume of coronary artery receiving at least X Gy.
Cardiac risk factors were dichotomized as presence or absence of diabetes.
*p < 0.05, †highest AUC.
![]()
DISCUSSION
We have identified a moderate correlation between coronary artery radiation dose-volume measures and subsequent calcification scores. In contrast to previous studies based on crude estimations of cardiac dose, this study involved detailed analyses of radiation dose to the heart and individual coronary arteries in patients treated with 3D RT planning (Figure 1). Visual assessment of coronary artery calcification on non-gated CT scans predicts CAC score well on gated CCT scans.16)21)22)23) Thus, detection of coronary calcification on simulation CT scans using visual CAC-DRS provides an accurate estimation on the presence or absence of coronary calcium. Diabetes was the only cardiac risk factor strongly associated with CAC score in our cohort. However, after controlling for diabetes, radiation exposure dose volume measurements strongly predicted subsequent coronary artery calcification.
Our findings are consistent with other published results.9)10) Interestingly, in these studies, the risk of CAD was predicted more accurately by coronary artery dose-volume measures than by MHD. In our study, MHD correlated poorly with coronary CAC, but all coronary artery dosimetric parameters performed better. Most patients in our study were treated with 3D-conformal RT. In the modern era of advanced radiation techniques and highly conformal dose distribution, MHD may not be a reliable surrogate for dose to cardiac substructures. Therefore, dose to individual substructures should be evaluated during RT treatment planning. It is not sufficient to consider MHD alone; instead, we recommend careful assessment of which cardiac substructures are exposed.
In our study, the association of CAC score with radiation exposure occurred relatively soon after RT. Typically, CAD is considered a late adverse event. For example, in a large study of Hodgkin lymphoma survivors, the median time to clinically evident CAD was 19 years.7) Furthermore, other studies have demonstrated coronary artery calcification decades after RT.5)24) Conversely, in our study, CCT scans were performed at a median of only 32 months after RT. Notably, in our cohort, coronary calcification was observed almost exclusively in patients with traditional risk factors for CAD. Thus, we hypothesize that individuals with pre-existing risk factors may experience accelerated atherosclerosis after radiation exposure, which may be appreciable within just a few years after treatment.
Our work is not without limitations. First, we could not assess for an association of radiation dose with ischemic cardiac events because only one patient in our cohort experienced an event. This patient did not have a significant change in CAC-DRS category pre- and post-RT, and because we are unable to compare morphologic plaque changes in this study, we do not know which type of changes elicited this event. The presence of non-calcified atherosclerosis was not assessed, and Rademaker et al.5) suggests that RT causes both CAC and non-calcified CAD. Second, baseline CCT scans were not available, so CAC scores from before RT were unavailable. However, we did evaluate the presence of calcifications on simulation CT scans that were performed just before RT with the CAC-DRS method.18) Our findings suggest that measurement of coronary dose volume parameters and CAC-DRS might be useful in clinical practice. It may be reasonable to use coronary dose volumes to predict development of atherosclerosis and to use CAC-DRS to assess for changes and compare non-gated with gated non-contrast CT. Calcifications were appreciable in only 7 arteries before RT, compared with 14 arteries on subsequent CCT scans. Thus, calcification occurred after RT in a sizable proportion of cases. Furthermore, the significant association of regional CAC score with radiation exposure strongly suggests that radiation played a role in calcification. Third, we were unable to capture cardiac risk factors with granularity. For example, both a patient with well-controlled blood pressure on a single anti-hypertensive agent and a patient with uncontrolled blood pressure on multiple cardiac medications were classified in the same fashion as having hypertension. Fourth, we were unable to explore the effect of cardiac medications on outcome. It was impossible to reliably capture all cardiac medications that were used because cardiac disease was managed outside of our institution in many cases, and medications were frequently modified with variable documentation in our system. Fifth, we did not include an age-sex-matched control group without radiotherapy, and there was wide interval variability between RT treatment and the CAC scan (median 32 months, IQR = 20-61 months). However, as mentioned earlier, there were no significant differences between age at CAC scan and CAC score > 1 (p = 0.29 by Wilcoxon-Mann-Whitney). Sixth, this cohort consisted of patients who were selected for evaluation by CCT. Therefore, their risk of calcification may have been higher than that of unselected patients treated with thoracic RT. Lastly, the small sample size and event rate limited statistical analyses. Therefore, we are cautious with the conclusions and encourage further validation.
Conclusions
Conventional cardiac risk factors are the strongest predictor of CAC score; however, when controlling for these factors, radiation exposure is significantly associated with coronary calcification. Coronary calcifications were observed almost exclusively in patients with multiple conventional cardiac risk factors, especially diabetes. MHD correlated weakly with CAC score (which is currently used clinically to limit doses). Other coronary dose volume parameters correlated better with calcium score and were predictive. An implication of our hypothesis generating findings is that CAC quantification may be a useful screening tool to detect early, subclinical CAD after RT in high-risk individuals. There might be a role for baseline CAC scan evaluation in patients with cardiac risk factors. Cardiac substructures likely have various dose-toxicity relationships. The identification of dose-volume constraints for individual substructures may help guide modern RT planning and reduce progression of CAD in cancer survivors.
 XML Download