

 PDF
PDF ePub
ePub Citation
 Print
Print


INTRODUCTION
With the substantial recent progress in antiviral and antifibrotic therapy for chronic liver diseases, there is a growing need for noninvasive detection and quantification of hepatic fibrosis (12). Of late, ultrasound (US) elastography has been widely used for this purpose (3). Since the introduction of transient elastography (TE), a diverse array of US elastography techniques have moved from the technical domain to the clinical field. Many vendors have devised their own US elastography techniques, including point shear-wave methods such as Virtual Touch Quantification (VTQ; Siemens Healthineers, Erlangen, Germany) and ElastPQ (Philips Healthcare, Amsterdam, the Netherlands), and two-dimensional (2D) shear-wave imaging techniques such as Supersonic Shear Imaging (Aixplorer; SuperSonic Imagine, Aix-en-Provence, France) (3).
S-shearwave elastography (S-SWE; Samsung Medison Co., Ltd., Seoul, Korea) is a recently developed point shear-wave elastography method (4). It is based on the same technical principle as the other point shear-wave methodologies using acoustic radiation pulse impulse imaging techniques. It consequently benefits from the general advantages of point shear-wave techniques, including the presence of integrated B-mode US for proper selection of regions-of-interest (ROIs) and increased feasibility in patients with obesity or ascites (5). In addition, S-SWE provides a quality index to assess the reliability of measurements, i.e., a reliability measurement index (RMI) that provides information on the shape and amplitude of the propagated shear waves (67).
Given that liver stiffness (LS) measurements on a US elastography system are influenced by many technical factors (5), their diagnostic performance for hepatic fibrosis can differ according to the system (8). Furthermore, the cut-off values obtained with different US elastography systems are not directly interchangeable, as the frequencies of the shear waves differ according to the systems (59). Therefore, a newly introduced technique needs to be clinically validated with proper reference standards before being applied in the clinical field. A recent study revealed that the performance of S-SWE was comparable to that of the currently used point shear-wave US elastography technique of VTQ in the diagnosis of hepatic fibrosis (4). However, the study involved a single center and had a small study population, and the cut-off values for S-SWE were determined using TE measurements without any pathological diagnosis.
Thus, the purpose of this multicenter study was to prospectively validate the diagnostic value of the new point shear-wave elastography method, S-SWE, in the noninvasive assessment of liver fibrosis. This was performed using histological fibrosis grading and TE values as the reference standards.
Go to : 
MATERIALS AND METHODS
Study Design and Study Population
This study was a prospective multicenter single-arm study performed at four large centers in the Republic of Korea, namely, Asan Medical Center, Chung-Ang University Hospital, Konkuk University Hospital, and Seoul National University Hospital (ClinicalTrials.gov identifier: NCT03047707). It was approved by the Institutional Review Board of each participating center, and written informed consent was obtained from all participants.
The study was powered to determine if S-SWE shows a significant level of performance in the detection of severe fibrosis from a null hypothesis. According to a previous study, the sample area under the receiver operating characteristic (ROC) curve (AUC) of shear-wave elastogrpahy was 0.84 (4). The null hypothesis was set as 0.79 based on the following assumption. According to a meta-analysis (10), the mean AUC of VTQ for the diagnosis of severe fibrosis was 0.89 and it was assumed that, if the AUC of S-SWE was less than 0.79, i.e., an AUC difference greater than 0.10 from that of VTQ, S-SWE could be regarded as not satisfactory. Assuming an enrollment ratio of 1, a type I error of 0.05 and a type II error of 0.20, at least 598 patients were required. Assuming a drop-out rate of approximately 5%, the required sample size was 630 patients.
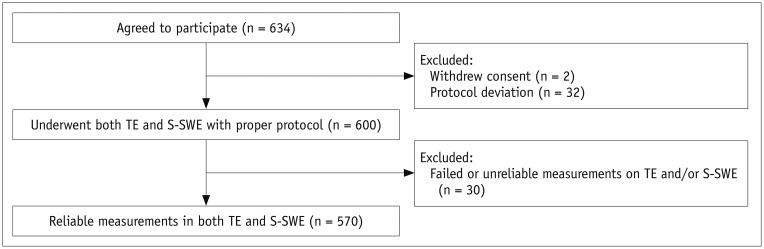
Between May 2017 and April 2018, 634 patients initially agreed to participate in the study. The following patients were included in the study: 1) patients with chronic liver disease or liver cirrhosis, those scheduled to undergo hepatectomy for suspected hepatocellular carcinoma (HCC) or living donation, or healthy volunteers; 2) those aged ≥ 18 years; and 3) those willing and able to give written informed consent. The following patients were excluded from the study: 1) patients with clinically suspected acute hepatitis or bile duct obstruction; 2) those with serum alanine aminotransferase > 5 times the upper normal limit within 3 months; 3) those who had previously undergone right hemihepatectomy or had received liver transplantation; and 4) patients with a large mass or infiltrative lesion in the right lobe of the liver (11).
For all participants, LS measurements were performed on both TE and S-SWE within a 3-month interval. TE or S-SWE were performed by dedicated operators in each hospital who had abundant clinical experience in TE or US elastography of the liver, ranging from 50 to 600 studies with 5–10 years of experience in TE and from 40 to 500 studies per year with 3–7 years of experience in US elastography. Before patient enrollment, all operators were educated about the study protocol with an emphasis on the blinding rule for other measurement methods and were given a manual of protocol procedures. The measurements were made after the patients fasted for at least 4 hours, and they were obtained by different operators who were blinded to the results of the other study. After excluding patients who had withdrawn consent (n = 2) and those with deviations in the data collection protocol (n = 32), 600 patients underwent both TE and S-SWE in accordance with the predefined study protocol (Fig. 1).
LS Measurement on S-SWE
S-SWE was performed on an RS80A® ultrasound system (Samsung Medison Co., Ltd.) using a convex probe (CA1-7A) in accordance with the recommendations of current international guidelines for point US shear-wave elastography (11). LS measurements were obtained using an intercostal approach, with the patient in a supine position with the right arm at maximum abduction. With reference to the real-time gray-scale image, ROIs were placed in the right lobe at a depth of approximately 20–40 mm from the liver capsule. Special attention was paid to avoid large vessels or focal lesions within the ROIs. The S-SWE measurements were expressed in kilopascals (kPa) with an automatically calculated RMI, which demonstrated the reliability of each measurement (6). The RMI ranged from 0 to 1.0, with an RMI ≥ 0.4 being considered acceptable according to the manufacturer's instruction. In this study, if 10 consecutive measurements with an RMI ≥ 0.4 and an interquartile range (IQR)/median (Med) ≤ 30% were obtained, the Med value was used as a representative value. In cases that did not satisfy the above criteria, five additional measurements were performed, and the auto-profile function was applied if IQR/Med was > 30% after a total of 15 measurements. This is a data editing tool provided by the manufacturer and is designed to sequentially remove data points that show maximum deviation from the Med until the IQR/Med is ≤ 30% or the number of remaining points is five. The S-SWE measurement was defined as an unreliable result if the final result after applying the auto-profile function had an IQR/Med > 30%. The S-SWE measurement was classified as a technical failure if no measurement with an RMI > 0.0 was obtained after at least 10 attempts.
Repeated Measurement of S-SWE
Healthy volunteers underwent three consecutive sessions of S-SWE: two sequential sessions by one radiologist followed by one additional session by another radiologist. The results of the first and second sessions were used to assess intra-observer variability, and those of the first and third sessions were used to assess inter-observer variability. The results of the first session were considered to be representative of the participant for the other analyses performed in this study.
LS Measurement by TE
TE was performed using a Fibroscan® system (Echosens, Paris, France) with an M probe according to the manufacturer's recommendations. Participants were laid in a supine position with the right arm at maximum abduction. Using TE, shear waves in the liver parenchyma were generated by a mechanical push and the velocity was measured at a depth of 25–65 mm below the skin surface (11). The LS measurement was expressed in kPa. A reliable TE measurement was defined by the acquisition of 10 valid measurements, a success rate ≥ 60%, and an IQR/Med of ≤ 30% (11). TE measurement was classified as a technical failure if no valid measurement was obtained after at least 10 attempts.
Classification of Liver Fibrosis Stages
Histological Results as a Reference Standard
For 107 patients with available specimens for histological analysis of hepatic fibrosis, a central pathology review was performed by one pathologist (with 8 years of experience in liver pathology) who was blinded to the results of S-SWE and TE. After reviewing the hematoxylin and eosin and Masson's trichrome stains, the pathologist scored the fibrosis stages according to the Metavir scoring system (12). Metavir scores of ≥ F2, ≥ F3, and F4 indicate significant fibrosis, severe fibrosis, and cirrhosis, respectively (12).
TE as the Reference Standard
In patients without histologic reference standards but with TE results (n = 463), LS values on TE were used to determine the hepatic fibrosis stages by applying the reference values suggested in previous studies (1314): the TE cut-off values for severe fibrosis (accounting for the ≥ F3 stage) and cirrhosis (accounting for the F4 stage) were > 9.5 kPa and > 12.5 kPa, respectively. In this study, we adopted the TE-based fibrosis stages as the reference standards for the diagnosis of ≥ F3 or F4, but not for ≥ F2, because the performance of TE for ≥ F2 classification has been reported to be relatively insufficient (131516). In addition, since TE cut-off values are considered to differ according to the etiology of the underlying liver disease, a subgroup analysis was performed for patients with chronic hepatitis B, the most common etiology in this study population. For the subgroup of chronic hepatitis B (n = 267), the TE cut-off values for severe fibrosis and cirrhosis were > 8.8 kPa and > 11.7 kPa, respectively, based on a meta-analysis (17).
Statistical Analysis
The rates of unsuccessful LS measurements (technical failure or unreliable results) on S-SWE and TE were compared using McNemar's test. Possible causes of unreliable measurements in each method were evaluated. S-SWE measurements for the different histological stages of hepatic fibrosis were compared using one-way analysis of variance followed by Tukey's honestly significant difference post-hoc test. Correlations between S-SWE measurements and the histologic stages of hepatic fibrosis were made using Spearman's correlation analysis. The diagnostic performances of S-SWE and TE for diagnosing severe fibrosis and cirrhosis were assessed using ROC curve analysis, with the histological results serving as the reference standards and comparisons being made using the Delong test. To avoid overestimation of the AUCs, 1000 bootstrap resamples were generated and the optimism-corrected AUCs were calculated. Cut-off S-SWE LS measurements for diagnosing severe fibrosis and cirrhosis were then determined on the basis of the ROC analysis. The sensitivity and specificity of the cut-off values for predicting hepatic fibrosis stages were calculated, with the TE values being used as the reference standards. The relationship between LS measurements on S-SWE and TE was assessed using Pearson's correlation analysis. Intra- and inter-observer variability in the S-SWE measurements was assessed using intraclass correlation coefficients (ICCs) and coefficient of variation (CV). ICCs of ≤ 0.20, 0.21–0.40, 0.41–0.60, 0.61–0.80, and > 0.80 were regarded as indicating poor, fair, moderate, strong, and excellent agreement, respectively. CVs of ≤ 10%, 11–25%, and ≥ 26% were regarded as indicating good, moderate, and poor agreement, respectively. In patients who underwent evaluations with the auto-profile function according to the study protocol, S-SWE LS measurements before and after auto-profile function were compared using paired t test.
Statistical analyses were performed using SPSS 21.0 (IBM Corp., Armonk, NY, USA) and R software version 3.4.0 (http://www.r-project.org). The R packages of pROC (an open-source package for R and S+ to analyze and compare ROC curves) and boot were used in this study. P values less than 0.05 were considered to indicate statistical significance.
Go to :
RESULTS
Study Population
Of the 600 patients who underwent both TE and S-SWE, TE was defined as a technical failure (n = 2) or as showing unreliable results (n = 25) in 26 participants, while S-SWE was defined as showing unreliable results in 4 participants. The results for one participant were defined as unreliable on both techniques. Thus, the frequency of unsuccessful LS measurements on TE was 4.5% (27/600), which was significantly higher than the 0.7% (4/600) on S-SWE (p < 0.001). For each technique, possible causes of unreliable results, including age, body mass index, the distance between the skin and liver capsule, sonic window, and echogenicity of the liver, were sought. Among these factors, there was no identifiable cause of technical failure either in TE (p = 0.335–0.927) or in S-SWE (p = 0.069–0.753). After excluding these 30 participants, the remaining 570 participants with reliable LS measurements on both TE and S-SWE were finally included for further analysis (Fig. 1). They were 488 patients with chronic liver disease or liver cirrhosis from various causes, 18 liver transplantation donors, and 64 healthy volunteers. Of these 570 participants, 107 underwent liver resection, liver transplantation, or needle biopsy within the 3 months following TE and S-SWE, according to their clinical needs. Details of the demographic and clinical characteristics of the study population are described in Table 1.
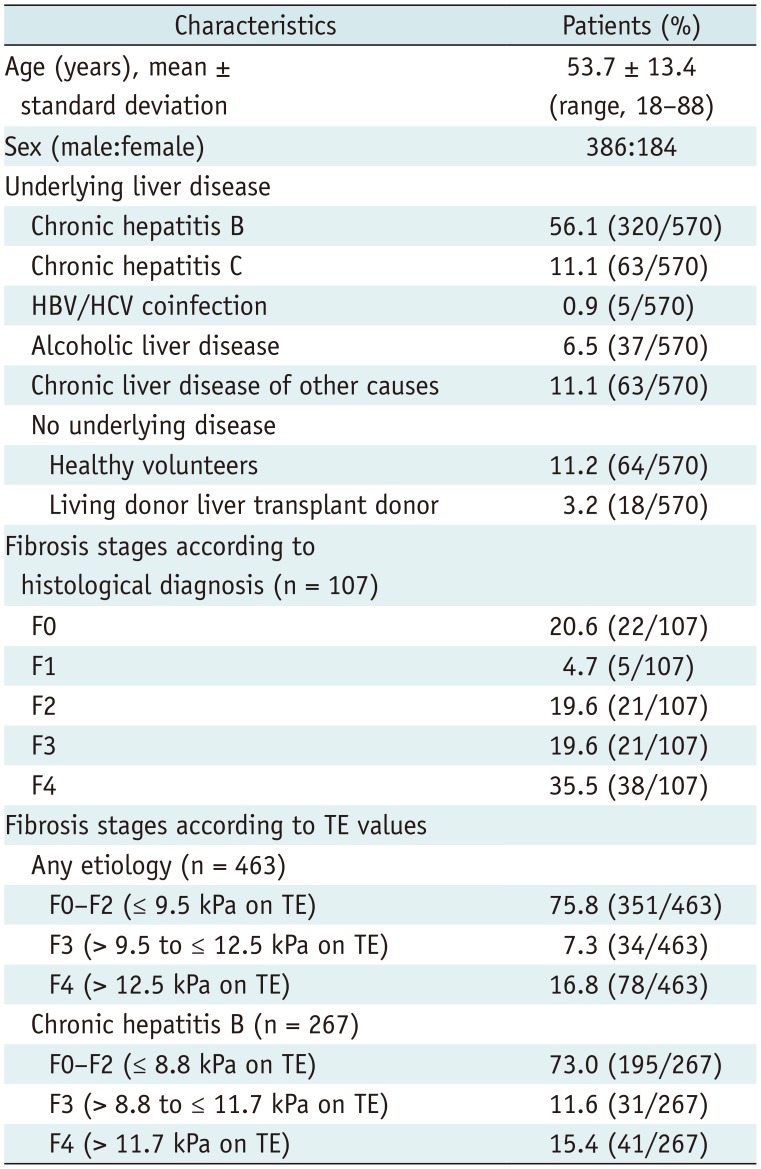
Table 1
Patient Characteristics
![]()
Liver Fibrosis Stages
Histological Results as the Reference Standard (n = 107)
On the basis of the results of the central pathology review (n = 107), 22, 5, 21, 21, and 38 patients were classified as having Metavir F0, F1, F2, F3, and F4 fibrosis stages, respectively (Table 1). Accordingly, 80 patients (74.8%) were classified as having ≥ F2, 59 patients (55.1%) as having ≥ F3, and 38 patients (35.5%) as having F4 stage fibrosis.
TE-Based Fibrosis Stages (n = 463)
Among patients without histologic reference standards but with TE results (n = 463), using the predefined cut-offs of > 9.5 kPa and > 12.5 kPa on TE for ≥ F3 and F4 stage fibrosis, respectively, 112 patients (24.2%) were classified as having severe fibrosis (F3, n = 34; and F4, n = 78) and 78 patients (16.8%) had cirrhosis (Table 1). For the subgroup of chronic hepatitis B patients (n = 267), based on TE cut-offs of > 8.8 kPa and > 11.7 kPa for ≥ F3 and F4 stage fibrosis, respectively, 72 patients (27.0%) were classified as having severe fibrosis (F3, n = 31; and F4, n = 41) and 41 patients (15.4%) as having cirrhosis (Table 1).
Correlations between LS Measurements on S-SWE and TE (n = 570)
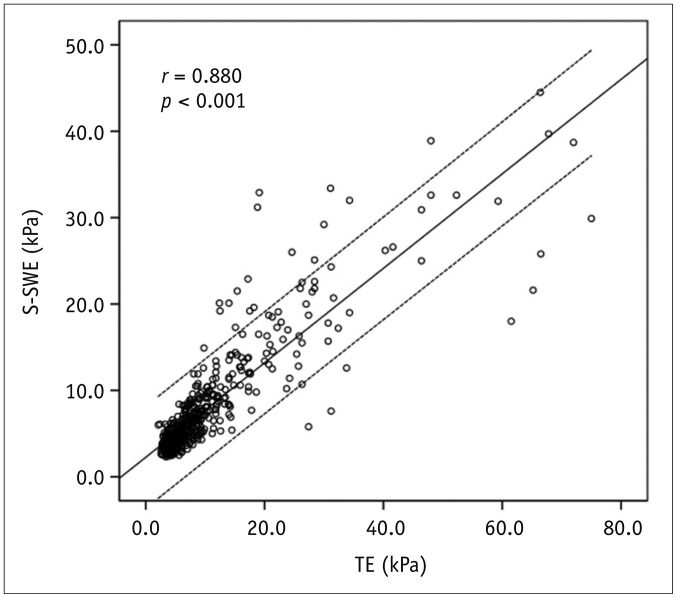
The LS measurements on S-SWE showed a significant correlation with those on TE (r = 0.880, p < 0.001) (Fig. 2).
Diagnostic Performance of S-SWE
Histological Results as the Reference Standard (n = 107)
S-SWE measurements differed significantly according to the histologic stages of hepatic fibrosis, with mean values (± standard deviation) of 4.5 (± 2.1), 5.9 (± 2.6), 8.4 (± 7.3), and 14.5 (± 10.0) kPa for F0/1, F2, F3, and F4, respectively (p < 0.001). A significant positive correlation was found between the S-SWE measurements and fibrosis stages of F0/1, F2, F3, and F4 on histologic assessments (rho = 0.665, p < 0.001).
Table 2 summarizes the AUCs of the S-SWE and TE measurements. For the diagnoses of ≥ F2, ≥ F3, and F4, the AUCs of S-SWE were 0.842, 0.844, and 0.850, respectively, and the optimism-corrected AUCs after internal validation by bootstrapping were 0.844, 0.845, and 0.850 (Table 2). On the basis of these data, the optimal cut-off values for LS measurements on S-SWE were > 7.0 kPa and > 9.7 kPa for ≥ F3 and F4, respectively (Table 3). Comparisons of the diagnostic performances of S-SWE and TE showed no statistically significant differences in the AUCs for the diagnoses of ≥ F2, ≥ F3, and F4 (Table 2).
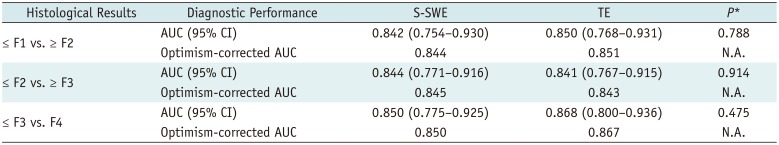
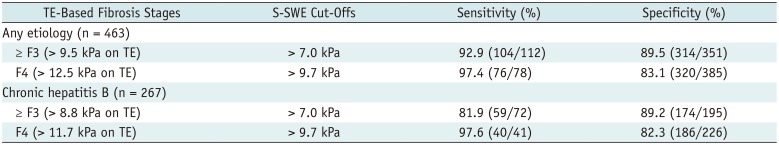
Table 2
Diagnostic Performance of S-SWE and TE in Differentiation of Histological Stages of Hepatic Fibrosis in 107 Patients
![]()
Table 3
Sensitivity and Specificity of S-SWE for Diagnosis of Hepatic Fibrosis Stages Using TE Values as Reference Standards
![]()
TE-Based Fibrosis Stages (n = 463)
The cut-off values derived from patients with a histological reference worked well when TE measurements were used as the reference for staging of hepatic fibrosis. For the prediction of TE-diagnosed stage ≥ F3 and F4 regardless of the etiologies of liver diseases, the S-SWE cut-off values of > 7.0 kPa and > 9.7 kPa, respectively, showed sensitivities of 92.9% (104/112) and 97.4% (76/78) and specificities of 89.5% (314/351) and 83.1% (320/385) (Table 3). Subgroup analysis of chronic hepatitis B showed that these cut-off values of S-SWE for ≥ F3 and F4 respectively, showed sensitivities of 81.9% (59/72) and 97.6% (40/41) and specificities of 89.2% (174/195) and 82.3% (186/226) (Table 3).
Intra- and Inter-Observer Agreement in LS Measurements on S-SWE (n = 64)
The LS measurements on S-SWE showed excellent intra-observer agreement with an ICC value of 0.848 (95% confidence interval [CI]: 0.762–0.905) and strong inter-observer agreement with an ICC value of 0.792 (95% CI: 0.657–0.874). CVs of intra-observer and inter-observer variability were 8.6% and 14.1%, indicating good and moderate agreement, respectively.
Auto-Profile Function in LS Measurements on S-SWE (n = 87)
In 87 patients, representative S-SWE values were determined by using the auto-profile function, and their mean LS measurement value was 8.6 kPa on S-SWE. In these patients, LS measurements before and after applying the auto-profile function were significantly different (p < 0.001) with a mean difference of 0.43 kPa (lower in after).
Go to :
DISCUSSION
This multicenter prospective study validated the diagnostic performance of a new point shear-wave elastography method, S-SWE, in the assessment of hepatic fibrosis. The study results showed that S-SWE provides good diagnostic performance in the staging of hepatic fibrosis, with a lower rate of unsuccessful LS measurements compared with TE. Furthermore, the LS measurements on S-SWE showed a good correlation with those on TE. The S-SWE cut-off values determined on the basis of histologic fibrosis stages were validated in a larger number of subjects by using TE findings as the reference standard. In addition, S-SWE showed reliable results in terms of intra- and inter-observer agreement.
In the staging of hepatic fibrosis with histological diagnosis as the reference standard, S-SWE yielded AUCs of 0.842, 0.844, and 0.850 for stages ≥ F2, ≥ F3, and F4, respectively. These AUCs were closely comparable to those of TE, the most validated shear-wave elastography technique for the assessment of hepatic fibrosis. Moreover, the AUCs of S-SWE in this study were similar to those of VTQ, which is another point shear-wave elastography technique, reported in a meta-analysis (10): AUCs of 0.84, 0.89, and 0.91 for stages ≥ F2, ≥ F3, and F4, respectively. Accordingly, our results suggest that S-SWE may be comparable to other previously used US elastography methods for the assessment of hepatic fibrosis.
We believe that this is the first study to use histological reference data to propose cut-off values for S-SWE LS measurements. These cut-off values of > 7.0 kPa for stage ≥ F3 and > 9.7 kPa for stage F4 resulted in high sensitivities and specificities in the prediction of TE-based fibrosis stages in all the etiologies of underlying liver diseases as well as in a subgroup of patients with chronic hepatitis B. However, these S-SWE cut-off values (7.0 kPa and 9.7 kPa, for the detection of ≥ F3 and F4, respectively) were substantially lower than the widely used TE cut-off values of > 9.5 kPa for stage ≥ F3 and > 12.5 kPa for stage F4. These differences in the LS measurements may be caused by differences in the physical properties of the push pulses and tracking pulses of the different shear-wave elastography methods. Similar differences have been also reported in previous studies comparing point shear-wave elastography, 2D shear-wave elastography, and TE (1819), and even between different point shear-wave elastography methods (2021). Thus, the absolute values of LS measurements on S-SWE and TE cannot be used interchangeably. However, despite significant differences in the measured values, we found a strong positive correlation between LS measurements on S-SWE and TE. Accordingly, in addition to the staging of liver fibrosis, S-SWE has the potential to be used for the same clinical applications as TE, such as the prediction of clinically significant portal hypertension (22) and assessment of the risk of HCC development (2324), although the performance of S-SWE has yet to be validated for each application.
In this study, S-SWE showed higher rates of reliable LS measurements than did TE (unsuccessful measurements in 0.7% of cases on S-SWE vs. 4.5% on TE). This can be explained by the fact that S-SWE, as a point shear-wave elastography method, is integrated with B-mode US, which can aid in the proper selection of ROIs, and is more feasible in patients with obesity or ascites (5). This result is in agreement with that of a recent meta-analysis showing that point shear-wave elastography techniques have a higher rate of reliable LS measurements than does TE (8). However, it should also be pointed out that we only used an M probe for TE. The use of an XL probe specifically designed for obese patients can decrease the rate of unsuccessful measurement and technical failures on TE. According to Vuppalanchi et al. (25), 1641 examinations with TE yielded a failure rate of 3.2% and 3.9% unreliable results using both M and XL probes.
For each measurement, S-SWE provides the RMI quality index, which allows assessment of the reliability of measurements with regard to the shape and amplitude of the propagated shear waves (6). Given that shear-wave velocity is the physical quantity measured in US elastography and that LS values are estimated from the shear-wave velocity, the quality of the propagated shear waves detected on the US system is very important for obtaining reliable measurements. Thus, the information on the quality of the shear-wave propagation enables users to filter out unreliable measurements in an easy and intuitive way (7). With the S-SWE system, measurements with low RMI values can be canceled out when a representative value is calculated. In addition, we assumed that the auto-profile function of S-SWE system can be also helpful to reduce measurement failure by eliminating deviated data points. In this study, removal of the data points showing the most deviation significantly reduced the Med of LS measurements. Thus, further study is warranted to investigate the effects of this approach on the diagnostic performance for hepatic fibrosis staging.
Intra- and inter-observer agreements in elastography LS measurements are of great importance for longitudinal follow-up of hepatic fibrosis. Previous studies have commonly reported good reproducibility for commercially available shear-wave elastography methods (18262728). For example, the ICCs for intra- and inter-observer agreements of VTQ, which use point shear-wave techniques, ranged from 0.90 to 0.915 and from 0.81 to 0.941, respectively (1829). Our S-SWE study results also showed excellent intra-observer agreement and strong inter-observer agreement, which suggests that S-SWE can provide reproducible LS measurements. However, the ICCs for intra- and inter-observer agreements in this study were lower (0.848 and 0.792, respectively) than those in a previous single-center study of S-SWE (0.99 and 0.98, respectively) (4). Considering that measurement reproducibility can be relatively inferior in a homogeneous population (30), this result may be explained by the differences in the study population between the two studies. Our study assessed inter- and intra-observer agreements in healthy volunteers (n = 64) while the previous study assessed these values in patients with chronic liver disease with different stages of hepatic fibrosis (4).
There are several limitations to this study. First, not all the patients included in this study had histological reference standards for their hepatic fibrosis staging. Therefore, while the S-SWE cut-off values were determined on the basis of histological results in a subgroup (n = 107), these values were validated on TE-based staging (n = 463). However, in recent practice, liver biopsy has not been routinely performed for the diagnosis of hepatic fibrosis, and TE has become widely accepted as a noninvasive alternative to histological assessment (1331). Second, the cut-off values for ≥ F2 could not be validated in this study, since the performance of TE for stage ≥ F2 has been reported to be relatively insufficient (131516). This can be attributed to the same reason as the first limitation, because not all the patients had histologic reference standards.
In conclusion, for the assessment of LS, the new point shear-wave elastography method of S-SWE shows good correlation with TE and provides good diagnostic performance in the prediction of hepatic fibrosis stages, with a lower rate of unsuccessful LS measurements compared with TE.
Go to :
 XML Download