

 PDF
PDF ePub
ePub Citation
 Print
Print


INTRODUCTION
Traumatic anosmia is a common disorder following head injury and is known to affect approximately 5–14.5% of patients with head trauma (12). Traumatic anosmia has been shown to affect the patients' quality of life (3). Although olfactory dysfunction after trauma is thought to be mostly caused by a direct damage to the olfactory nerve and the associated nerve center (4), a traumatic incident without any structural abnormality can also lead to clinically overt olfactory dysfunction (5).
Functional magnetic resonance imaging (fMRI) can be used to measure the functional activity or functional connectivity in patients with smell disorders and can enhance our fundamental understanding of how the olfactory system works (6789). Therefore, findings from fMRI studies may lead to better prognostication and improved treatment strategies (6789). Previous fMRI studies have demonstrated that the administration of odors results in decreased activation of the olfactory brain regions in patients with smell disorders and olfactory dysfunction (6101112). While task-based fMRI can provide additional information regarding brain function, task instructions can be difficult for patients with olfactory dysfunction due to accompanying cognitive problems. Furthermore, odor-stimulated task-based fMRI studies have provided various results due to the heterogeneity of olfactory tasks, overlapping functional areas responsible for sniffing and olfaction, and habituation of the olfactory systems (13).
Unlike task-based fMRI, resting-state fMRI (rs-fMRI) appears to be a promising evaluation tool for understanding the functional activity and connectivity without specific stimuli or tasks (14). In this respect, rs-fMRI may have additional benefits compared to odor-stimulated taskbased fMRI for the evaluation of olfactory dysfunction in patients with smell disorder. rs-fMRI studies on olfactory dysfunction have been rarely reported to date, specifically in those with post-traumatic anosmia (715). Therefore, the objective of this study was to investigate the differences in the functional connectivity between patients with traumatic anosmia and healthy controls using rs-fMRI. We hypothesized that patients with traumatic anosmia would have specific disruptions in the network connectivity within the whole brain as well as in the olfactory networks when compared to healthy controls and that these alteration patterns would be related to the symptom severity.
MATERIALS AND METHODS
Study Population
This prospective study was approved by the ethics committee of Konkuk University Medical Center. Sixteen patients (mean age, 43.2 ± 10.2 years; 11 males) with traumatic anosmia were included in the study between November 2012 and May 2014. The inclusion criteria were as follows: 1) presentation within 2 years of head injury; 2) fulfilment of criteria for anosmia based on the Korean Version of the Sniffin' stick (KVSS) II test; and 3) age between 18 and 65 years. The exclusion criteria were as follows: 1) history of olfactory impairment; 2) history of sinonasal disease; or 3) current nasal symptoms. All patients completed psychophysical olfactory testing, including the KVSS I and II, and underwent nasal endoscopy to exclude the possibility of obstructive olfactory loss.
Twelve healthy controls (mean age, 26.8 ± 8.4 years; 8 males) were also recruited from the local community. The inclusion criteria for healthy controls were as follows: 1) normal olfactory function; 2) no brain lesions or prior head trauma; and 3) no history of psychiatric or neurologic diseases. All study participants were right-handed. All participants provided written informed consent prior to study participation.
Clinical Olfactory Assessment
An otorhinolaryngologist with 17 years of clinical experience performed the endoscopic examination of the nasal cavity and the clinical olfactory performance testing in all patients to ensure that patients met the criteria for anosmia. Clinical olfactory performance measures included the KVSS I and II. The KVSS I test is a modified Sniffin' stick test optimized for Korean patients, which includes odors familiar to Korean individuals, and the KVSS II is the Korean equivalent of the Sniffin' stick test (1617). Clinical diagnosis of anosmia was based on the KVSS II scores; total scores between 0–20 were classified as anosmia, scores of 20.25–27 were classified as hyposmia, and scores of 27.25–48 were classified as normosmia (1617).
MRI Acquisition
All participants underwent MRI using a 3T MR scanner (Signa HDxT; GE Healthcare, Milwaukee, WI, USA) with an 8-channel head coil. High spatial resolution T1-weighted three-dimensional (3D) anatomic images were obtained in the axial plane using a fast-spoiled gradient echo sequence (repetition time [TR]: 7.8 ms; echo time [TE]: 3.0 ms; matrix: 256 × 256; flip angle: 13°; number of sections: 134; field of view: 240 × 240 mm2; section thickness: 1.3 mm).
rs-fMRI was performed in the axial plane using a gradient-echo echo-planar imaging (EPI) sequence (TR: 2000 ms; TE: 30 ms; matrix: 64 × 64; flip angle: 90; number of sections: 40; field of view: 240 × 240 mm; section thickness: 3.5 mm; scan of volume: 800) with a voxel size of 3.75 × 3.75 × 3.5 mm.
fMRI Data Pre-Processing
fMRI data pre-processing was performed using SPM12 (Wellcome Trust Centre for Neuroimaging, London, UK) and in-house codes of MATLAB R2016b (MathWorks, Natick, MA, USA). The first three volumes of each dataset were discarded to allow for equilibration effects. We performed slice timing correction to realign fMRI slices of each scan to the first slice that was the reference slice based on its relative timing within the entire scan. Then, spatial realignment was performed to remove movement artifacts from the fMRI data. Scans were spatially realigned to a reference scan in order to revise any spatial mismatches caused by movement (18). We chose the first scan as the reference scan and used the default option of SPM12 (quality: 0.9; separation: 4; smoothing: 5; interpolation: 2nd degree). fMRI scans from each subject were then co-registered to their T1-weighted 3D anatomic images (19). The default option of SPM12 (objective function: normalized mutual information; histogram smoothing: 7) was used here as well. Next, steps were taken to reduce the noise signals. All scans were temporally band-pass filtered (0.01–0.08 Hz) to remove slow signal drifts (2021). Brain tissues were segmented using the co-registered T1-weighted MRI scans, and white matter and cerebrospinal fluid signals were extracted. We linearly regressed out the white matter and cerebrospinal fluid signals, while the linear temporal trends and motion parameters acquired from the realignment step (six parameters) were also considered as nuisance parameters. Finally, we performed spatial normalization to the EPI template with a 2-mm slice thickness of the MNI space (Montreal Neurological Institute: International Consortium for Brain Mapping) and spatial smoothing with the 4-mm full-width at half-maximum Gaussian kernel.
Brain Networks
In this study, we used a total of 279 functional areas for brain network analysis. We further added the olfactory network to the pre-defined whole brain network.
First, the pre-defined whole brain network suggested by Jonathan Power and colleagues was constructed with 264 functional areas (22). Those areas were then divided into 12 predefined well-known networks, involved in different cognitive processes. Among the 264 functional areas, 33 areas with uncertain network classifications were also included (22). Next, the olfactory network was defined by statistical localization (23). The olfactory network was comprised of 21 functional areas including the piriform cortex, insular cortex, prefrontal cortex, and anterior cingulate/frontal cortex (Supplementary Table 1). All regions-of-interest (ROIs) were near-sphere in shape (3 × 3 × 3 cube with an additional voxel on the center of each face, total 33 voxels) and located at their center. Six ROIs from the pre-defined whole brain network were discarded as they overlapped with the ROIs from the olfactory network. A final check was performed to ensure there were no overlapping voxels between the ROIs.
Functional Connectivity and Whole Brain Network Analysis
Functional connectivity was measured as the Pearson correlation coefficient between the ROI time-series. The whole brain network with 279 × 279 connectivity was constructed. We used binary network type for calculating the network properties, where the connectivity of p value < 0.05 (positive and significant correlation) takes the value of 1, otherwise the connectivity takes the value of 0 (24).
Two network properties were measured to explore functional integration and segregation (2526). Global efficiency is a measure of how efficiently a network exchanges information. Global efficiency has been suggested as a measure of functional integration and is calculated as the inverse of the harmonic mean of the shortest path length in the network:
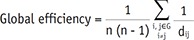
Where dij is the shortest path length connecting nodes i and j, and G represents the graph.
Modularity is a statistical unit that quantifies the degree of network subdivision into clearly delineated modules. The Louvain community detection algorithm was applied to construct modules in the network (27). The Louvain algorithm optimizes and constructs the modules to maximize the modularity of the network.

Where n is the number of all edges in the graph, Kij is the binary value of the edge between nodes i, and j. ki and kj are the number of the edges attached to nodes i and j. ci and cj represent the modules of the nodes and δ is a simple delta function.
Structural MRI Analysis
A neuroradiologist with 20 years of experience who was blinded to the clinical data assessed the images from the T1-weighted fast-spoiled gradient echo sequence for structural brain abnormalities. For assessment, multi-planar reformatted images as well as original axial images were used. When tissue loss was present, the maximal dimension of the tissue loss was measured on a picture archiving and communication system (Centricity Enterprise Imaging, GE Healthcare, Barrington, IL, USA).
Statistical Analyses
To compare the demographic variables between patients with anosmia and healthy controls, the nonparametric Mann–Whitney test and Fisher's exact test were used due to our small sample size using the Statistical Package for the Social Sciences (SPSS, version 23.0, IBM Corp., Armonk, NY, USA). P values less than 0.05 were considered to be statistically significant.
Statistical analysis for the rs-fMRI data was performed in MATLAB using in-house codes. All group comparisons were tested using a two sample t test after controlling for age difference between the groups. The age effect unaffected by the disease was estimated by linear regression for the healthy controls and was controlled for both groups (28). Individual functional connectivity was tested using Student's t distribution and was transformed into p values to determine whether the functional connectivity was significant in the brain networks. Functional connectivity comparison within networks was further tested in consideration for multiple comparisons. False discovery rate (FDR) was controlled in the olfactory network comparison (2930). For the other comparisons, we adopted a cluster-wise inference method, a degree-based statistic to find clusters significantly influenced by the disease (31). Finally, multiple linear regression was used to evaluate the explanatory power of the network properties in predicting the behavioral scores of patients.
RESULTS
Demographics and Clinical and Imaging Features
The mean age of the patients with traumatic anosmia was significantly greater than that of healthy controls (p < 0.001), with no significant difference in the sex ratio (p = 1.000). The mean time between head injury and clinical consultation was 9.6 months (range, 3–24 months) in the anosmia group. Four of the 16 patients exhibited focal encephalomalacia on the structural MRI, with the maximum dimension ranging from < 1.0 cm in 3 patients to approximately 3.0 cm in one patient; the lesions were located at both gyri recti (n = 1), the left gyrus rectus (n = 2), or the right gyrus rectus (n = 1). The patient with the largest lesion showed involvement of the left medial orbital gyrus as well. There were no additional structural abnormalities in the brains of all subjects. In patients with anosmia, the mean KVSS II score was 9.44 ± 3.7 (range, 3–15), indicating that all patients met the diagnostic criteria for anosmia.
Changes in Olfactory Network in Patients with Traumatic Anosmia
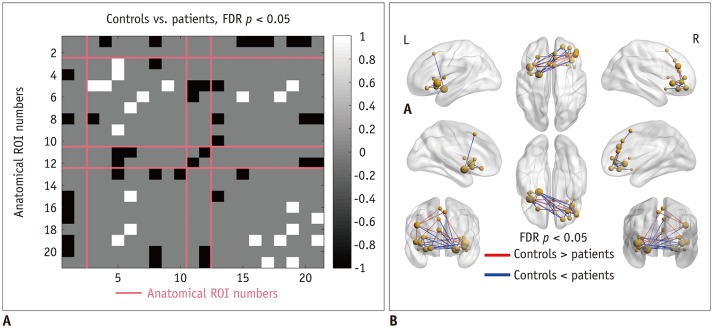
Compared with healthy controls, patients with anosmia exhibited different patterns of connectivity in the olfactory network (Fig. 1). Intra-cluster connectivity was decreased in patients, specifically in the insular cortex and anterior cingulate/frontal cortex (FDR-corrected p < 0.05). Inter-anatomical-cluster connectivity (across piriform cortex, insular cortex, prefrontal cortex, anterior cingulate/frontal cortex) was increased in the patients compared with that in the healthy controls (FDR-corrected p < 0.05).
Comparison of Whole Brain Functional Connectivity
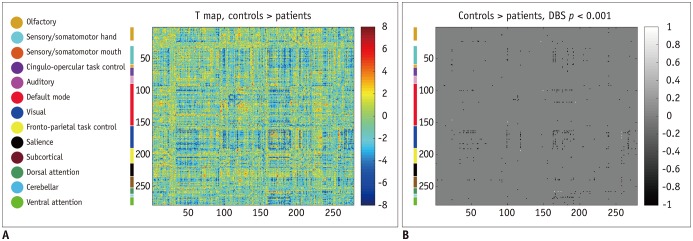
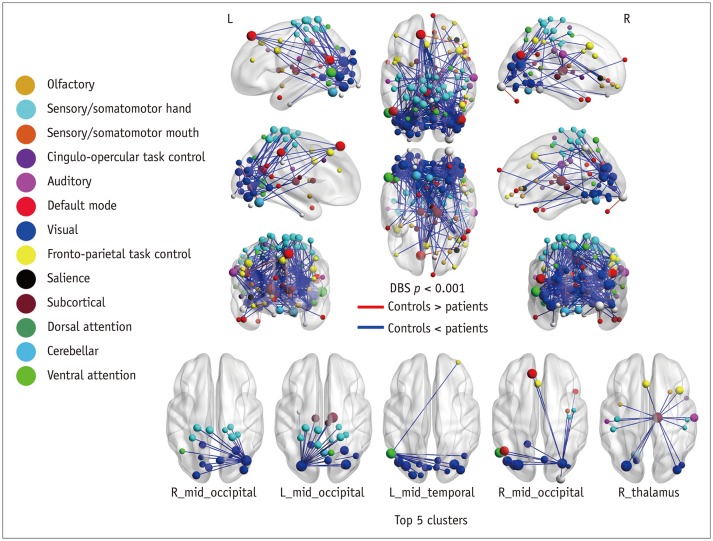
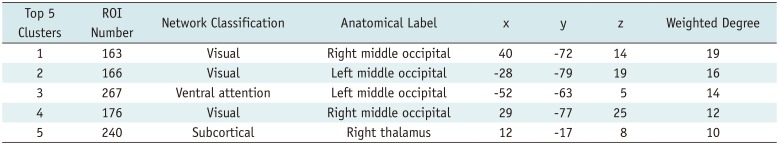
Patients with traumatic anosmia showed increased connectivity in most brain regions (Figs. 2, 3) compared with that in healthy controls. Furthermore, the functional connectivity in the patients was primarily increased among the thalamic and sensory networks (visual and somatomotor hand) compared with the healthy controls (Table 1).
Comparison of Functional Network Organization
Compared with healthy controls, patients with traumatic anosmia showed significantly increased global efficiency (0.753 ± 0.056 vs. 0.704 ± 0.042) (p = 0.019) and decreased modularity (0.165 ± 0.044 vs. 0.245 ± 0.054) (p < 0.001) in the whole brain network.
Correlation between Network Parameters and KVSS II Score
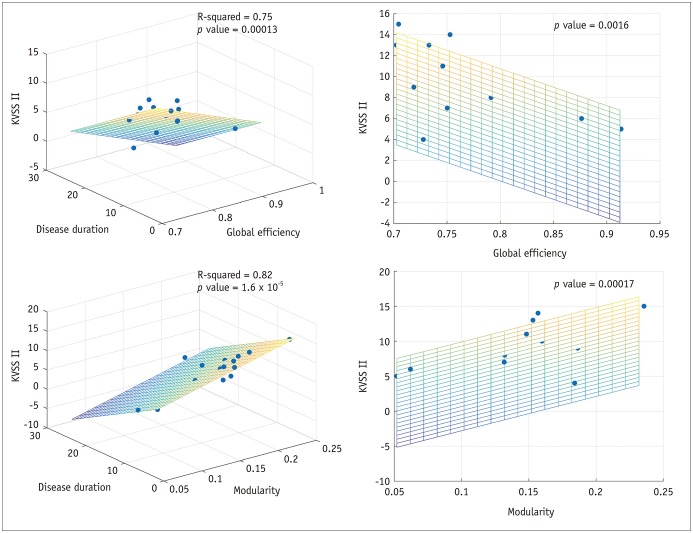
In patients with traumatic anosmia, the global efficiency of the whole brain network was significantly correlated with the KVSS II score (r2 = 0.71, p = 0.002) and remained significant after controlling for disease duration (r2 = 0.75, p < 0.001) (Fig. 4). Modularity of the whole brain network was also significantly associated with the KVSS II score (r2 = 0.79, p < 0.001) and remained significant after controlling for disease duration (r2 = 0.82, p < 0.001).
DISCUSSION
In this study, we demonstrated that the intra-network connectivity of the olfactory network was decreased in patients with anosmia compared with that in healthy controls, whereas the inter-network connectivity of both olfactory and whole-brain networks was increased. These findings may suggest that the compensatory mechanism, which is based on the recruitment of other brain areas, partly plays a role in the evolution of traumatic olfactory dysfunction as previously suggested in many neurodegenerative and psychiatric diseases (323334).
Indeed, there is strong evidence supporting brain plasticity in response to pathological damage induced by various insults (34), as well as in the case of olfactory dysfunction (3235). The results of a previous study on anosmia revealed diverse network changes, involving mostly non-olfactory regions, the prefrontal areas, the left inferior frontal gyrus, and the left premotor cortex (35). In addition to plasticity as it relates to functional loss, the reorganization and establishment of new connections have been demonstrated at the cognitive level of the olfactory system, although the underlying mechanisms behind the plasticity of the olfactory system are still under investigation (3536). Furthermore, a structural analysis in patients with traumatic anosmia has also revealed paradoxical increases in gray matter volume according to disease duration (32), giving another line of evidence for the compensatory mechanism after olfactory dysfunction. Therefore, we believe that an impaired activation of the olfactory network, manifesting as a decreased intra-network connectivity of the olfactory network, may induce a compensatory activation of other networks as observed in our study.
However, our finding is not entirely consistent with the observations of previous studies that investigated the effects of olfactory disorders or neurodegenerative disorders presenting as olfactory dysfunction at the early stage. They reported a decreased activation in the olfactory areas of the brain, using odor-stimulated task-based fMRI (612). Yet, the functional connectivity and network properties beyond the olfactory areas have not been studied until recently. Kollndorfer et al. (7) first reported task-based fMRI connectivity analysis, which revealed decreased functional connectivity in the somatosensory and integrative networks as well as the olfactory network. In contrast to the previous report, we observed that functional connectivity was prominently increased in the motor and visual cortex in addition to the inter-network connectivity of the olfactory network and that in the somatosensory networks. This discrepancy may be due to differences in the study methodology, as the previous study used task-related fMRI for the olfactory, integrative, and somatosensory networks, whereas we analyzed the whole brain connectivity with 279 different functional networks while using rs-fMRI for the first time.
To clearly understand the dynamic interaction among different brain regions, we performed a graph theory-based network analysis, which can offer a better understanding of the local and global organization of resting-state networks (37). Specifically, we used two of the most popular measures: global efficiency and modularity. Global efficiency indicates how effectively information is integrated across the entirety of the networks. Conversely, modularity indicates how effectively information is integrated between immediate neighboring brain regions of a given network node (38).
We found that global efficiency was increased while modularity (modular organization) was decreased in patients with traumatic anosmia compared with those in healthy controls. With respect to modularity, our finding is consistent with previous observations showing that modularity decreases with normal aging (3940), neuropsychiatric disorders, such as schizophrenia (41), and preclinical Alzheimer's disease (42). Modularity can be large when nodes are maximally connected within a module, but minimally connected between modules (42). Accordingly, the decreased modularity in the patients with traumatic anosmia indicates a less distinctive functional modular structure than that in the normal group, and this alteration of network could be a manifestation of a compensatory mechanism either from an increase in intermodular connections, a decrease in intramodular connections, or a combination of both (40).
The increased global efficiency of the resting-state connectivity in patients can be explained by the increased functional connectivity of the whole brain networks for adapting to the local damage responsible for olfactory core dysfunction. In many networks, modularity and global efficiency are inversely related and this is consistent with what we observed in our study (43). As the brain is a complex network, an increased global efficiency with decreased modularity reflects a less organized connectivity and a more random network (44). We speculated that although the brain of patients with traumatic anosmia attempts to overcome impairment derived from olfactory dysfunction by increasing the functional connectivity both within and outside the olfactory network, disorganized and increased randomization within the networks may hinder the perfect compensation to these damages.
When interpreting our findings, however, we should not ignore the potential effect of concomitant brain pathology from non-olfactory traumatic brain injury. It has been reported that diffuse microstructural and functional changes can be present even without overt structural abnormality in patients with mild traumatic brain injury (4546). The reported results of these invisible changes, however, are inconsistent in terms of functional connectivity. Some studies reported decreased global efficiency and increased modularity in patients with mild traumatic brain injury and posttraumatic stress disorder (4748). Conversely, several recent studies reported an increase in the resting functional connectivity after traumatic concussion relative to the controls (4950), which is in line with our findings. Thus, our findings may represent a pattern of the dynamics behind functional connectivity changes following trauma as well as a representation of the olfactory dysfunction itself.
It is worth noting that global efficiency and modularity were found to have a significant correlation with the severity of olfactory dysfunction based on the KVSS II score in our study. This suggests that a lower degree of organization in the brain network, expressed as decreased modularity and increased global efficiency, is correlated with the clinical severity in traumatic anosmia. This may support the claim that olfactory dysfunction is the major contributor to the connectivity changes observed in our study. Furthermore, given the relationship between these two measures and the clinical severity, we believe that these two measures can be used as imaging biomarkers to objectively evaluate the clinical status of subjects with traumatic anosmia in the future.
There are several limitations in this study. Although this study recruited a relatively small study population, we found statistically significant differences in the rs-fMRI analysis, even after multiple comparison corrections. Second, the difference in the age between the groups might have contributed to the results, but we included the age as a covariate in the analyses to minimize the effect of age differences. Furthermore, there was a significant correlation between disease severity and rs-fMRI derived parameters, indicating that the changes in the anosmia group are likely induced by the disease itself rather than aging. Third, cerebromalacia in the orbitofrontal cortex was present, albeit in a small number from the whole population and this might subsequently have affected the connectivity changes in the rs-fMRI.
In conclusion, we present rs-fMRI evidence of traumatic anosmia-induced connectivity changes in the global functional networks and olfactory functional networks. These findings suggest that rs-fMRI parameters, by revealing more widespread functional damage than previously expected, may serve as potential biomarkers for traumatic anosmia.
 XML Download