INTRODUCTION
Left Ventricular Functional Assessment
Visual Assessment
I. What-to-see
1. Anatomy of the left ventricle (LV), left ventricular outflow tract (LVOT), and aortic root can be evaluated using cine images.
2. Global and segmental motion of the LV can be assessed.
3. Hemodynamic information such as shunt flow, valvular stenosis or regurgitation, flow acceleration at the LVOT, and evidence of constrictive physiology can be assessed.
II. How-to
1. Check all cine images, validate using different planes, and evaluate the presence of artifacts.
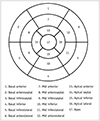
2. LV function is evaluated in terms of global and segmental aspects, and segmental wall motion is evaluated based on the segmental wall thickness at systole. The evaluation uses the standard LV segmentation nomenclature (Fig. 1) (15). Wall motion is classified as hyperkinetic, normokinetic, hypokinetic, akinetic, or dyskinetic (16).
Quantitative Assessment
II. How-to
1. General
A. Evaluate the stack of short-axis cine images using computer analysis software.
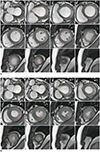
B. Acquire contours of endocardial and epicardial borders at both the ED and ES phases (Fig. 2).
C. If a chemical shift artifact occurs, the epicardial border is drawn in the middle of the chemical shift artifact line (17).
D. LV ED and ES images are acquired at the largest and the smallest LV blood volume, respectively.
E. The reader must check the appropriateness of automatic contour delineation (when used).
2. LV volumes
A. Papillary muscles should be included with the myocardium. However, some evaluation tools do not draw its contour, but rather recognize it as a chamber volume. Inclusion or exclusion of papillary muscles should be mentioned (1819).
B. LVOT should be included as the part of LV blood volume. The drawing contour should be included in the outflow tract to the level of the aortic valve cusps.
C. Because of the tendency of the mitral valve to apex in the systole phase (the so-called basal descent), assessing the basal slice requires caution during evaluation. If the blood volume surrounded by the myocardium in the basal slice is less than 50%, this space is considered to be the left atrial cavity. Some evaluation tools automatically check the systolic atrioventricular ring descent.
3. LV mass
A. Calculation: (Total epicardial volume - total endocardial volume) × specific density of the myocardium (1.05 g/mL) (17).
B. Papillary muscles are myocardial tissue and should be included, particularly in cases of myocardial hypertrophy. The inclusion or exclusion of papillary muscles should be mentioned (18).
C. Base and apex: Most basal slices contain a small crescent of basal lateral myocardium without ventricular blood volume, and this myocardium should be included in the LV mass. In addition, most apical slices may contain myocardium without a blood cavity, and the epicardial contour should be considered for LV mass evaluation.
4. Quick assessment
A. In the absence of significant regional variations, a quick calculation can be performed without the use of analysis software.
B. A rotational long-axis view (e.g., 2-chamber and 4-chamber views) allows for faster evaluation and is not limited by basal descent. The assessment technique should be mentioned in the report.
-
C. Calculation
1) In general, two calculation formulae are used (2021), as indicated below.
2) A single long-axis equation: LV volume = 0.85 × (LVarea)2 / LVlength. This is performed using a 4-chamber view. The calculation requires both ED and ES phases. The LVarea is a straight line connecting the endocardial contour of the medial and lateral portions of the base. The LVlength is the length from the base to the endocardial border of the apex.
3) A biplane equation: LV volume = 0.85 × (LVarea1 × LVarea2) / LVlength. Both 4-chamber and 2-chamber views are used, similar to the single long-axis equation, except that both the LVarea1 and LVarea2 are measured in each view, respectively.
-
D. The cavity diameter and LV wall thickness can be obtained as follows (22).
1) For measurements in a short-axis image, measure at the base just below the papillary muscle tip.
2) In a 3-chamber image, measurements are made on the LV minor axis plane showing the mitral cordae at the base of the papillary muscle tip.
3) Both methods have good reproducibility, and the 3-chamber method is the most comparable to echocardiography.
III. Pitfalls
1. If there is an alteration in the axis of the cine image due to a disease that can cause structural changes in the heart (e.g., valvular or ischemic heart disease), it is necessary to confirm whether measurement of the axis is appropriate.
2. If the cine image does not contain sufficient LV apex and base, the measured value may be incorrect.
3. If the cine slice thickness or gap is large, the measured value may be inaccurate. It is recommended that the slice thickness and gap should be kept within 10 mm.
Right Ventricular Functional Assessment
Visual Assessment
I. What-to-see
1. Evaluate the anatomy of the RV, right ventricular outflow tract (RVOT), global or regional wall motion, and wall thickness (17).
2. Check for shunt flow, valvular stenosis, or regurgitation.
3. Hemodynamic interactions between the LV and RV (e.g., constrictive physiology) may also be assessed.
II. How-to
1. Identify all cine images and determine whether the axis is distorted by using two different planes and whether the ventricle that you want to evaluate contains enough from the apex to the base at systole and diastole. Check for the presence of an artifact.
-
2. Wall assessment
A. Evaluate global or regional wall motions and classify them as normokinetic, hypokinetic, or dyskinetic.
B. If regional wall motion abnormality is observed, mention whether the location is the infundibulum, body, or apex.
C. Measure the wall thickness at the atrial middle portion of the RV free wall in the ED phase (optional).
Quantitative Assessment
I. What-to-see
1. Evaluate ED volume, ES volume, EF, and SV of RV of both measured and BSA-indexed values (23).
II. How-to
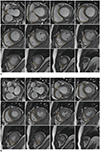
1. Assess the contiguous stack of short-axis or transaxial cine images using analysis software (Figs. 3, 4). Transaxial cine images offer the best plane to identify the tricuspid valve plane and have good reproducibility. However, in clinical practice, the LV as well as RV are often assessed together and often evaluated by the short axis, known as the best plane for LV assessment (2425).
2. For accurate quantification, it is important to choose the ED and ES phases appropriately. Select the ED and ES phases when the RV size is the largest and smallest, respectively. This may be different from the ED and ES phases of the LV.
3. When contouring the endocardial border, draw the inner boundary of the RVOT well and make it possible to include the pulmonary valve directly underneath. When contouring the basal slice, use at least two different planes to ensure that the RV cavity is well-contained. Trabeculae and papillary muscles are commonly included in the RV cavity, which contributes to reproducibility. This is different from the LV assessment method (17).
4. In general, the RV mass is rarely evaluated, so the epicardial border is usually not drawn.
5. LV assessment values can be used to validate the measured values, and if there is no intracardiac or extracardiac shunt, the LV and RV SVs are approximately the same.
III. Pitfalls
1. It is difficult to grasp the endocardial border around the RVOT and the pulmonary valve in both the transaxial and short-axis cine images, and it takes time to become skilled at doing this.
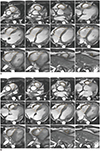
2. It is difficult to distinguish whether the space seen in the basal slice of the short-axis cine is the RV or right atrium, reducing reproducibility. Therefore, it is recommended to refer to other planes as well (Fig. 5).
3. When there is a disease that can cause structural alteration of the RV (e.g., tricuspid regurgitation or pulmonary hypertension), the LV and RV axes are different from each other, and accurate assessment may be difficult with a short-axis cine. In this case, it is better to use the transaxial plane or to obtain the short-axis cine images for the RV axis again.
Flow Imaging
Visual Assessment
II. How-to
1. Display both magnitude and velocity map side-by-side using the stack or cine mode. If possible, also display the corresponding cine images (gradient echo or steady-state free precession).
2. Check in- or through-plane acquisitions of the velocity map.
3. The direction, dimensions and time courses of flow can provide useful information regarding disease etiology (e.g., abnormal flow jet in coarctation of the aorta [Fig. 6], valvular regurgitation, or intracardiac shunt) (2627).
Quantitative Assessment
I. What-to-see
1. Directly measures the direction, volume, and velocity of blood flow in the blood vessel or heart.
2. There are two kinds of parameters: directly calculated and secondarily derived.
3. Directly calculated parameters include forward volume, reverse volume, and velocity (mean or peak).
-
4. Derived parameters are as follows (17):
5. In congenital heart disease or valve disease, hemodynamic information can be obtained using various flow parameters as follows (Table 1).
II. How-to
1. Display both magnitude and velocity maps side-by-side using a stack or cine mode.
2. Make sure there are no aliasing artifacts (i.e., the VENC is too low) or low-contrast images (i.e., the VENC is too high) (17).
3. Draw a line along the boundary of the blood vessel or heart structure to be measured on each phase or the magnitude image along whole-cardiac phases. Make sure that the noise outside the vessels or heart is not included.
4. Baseline-correction can be applied in the software or using a phantom (3031).
III. Pitfalls
1. Generally, the area of flow may be slightly larger than that drawn in the magnitude images.
2. When reporting peak velocities, some pitfalls should be considered. First, the software package may have a different method of calculating the peak velocity (measuring one-pixel value vs. averaging several adjacent pixels). Second, if the imaging plane does not properly include the vena contracta, flow imaging will not reflect the true peak velocity. Third, the peak velocity from flow imaging can be underestimated, particularly at a lower spatial resolution.
MR Angiography
Visual and Quantitative Assessments
II. How-to
1. Review multiplanar reformation (MPR), maximum intensity projection and volume-rendering images.
-
2. Thoracic aorta
A. The widest diameter is measured using a double-oblique MPR image perpendicular to the blood flow and measured at the standardized level (3233).
B. Measurements should preferably be done in the diastole phase.
C. Describe wall irregularities, if present.
D. Comparison between non-contrast and contrast-enhanced MR angiography is useful for evaluating vessel wall thickening or intramural thrombosis (34).
-
3. Pulmonary artery and vein
-
4. Coronary artery
A. Describe anomalous origin or course of the coronary artery, if present.
B. Stenosis extent: coronary artery stenosis of more than 50% is described as significant, and stenosis less than 50% as insignificant (37).
III. Pitfall
1. When measuring the sinus or sinotubular junction level of the aorta, electrocardiography-gating can be used to avoid under- or over-estimation (17).
Sample Report
Postoperative Tetralogy of Fallot
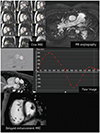
I. Imaging findings (Fig. 7):
-
1. Morphological evaluation of cine MR, MR angiography, and delayed enhancement images
-
2. Ventricular function on cine MRI
-
3. Flow quantification on flow MRI
A. Flow volume: Ascending aorta, 34.0 mL; superior vena cava, 18.3 mL; descending aorta, 16.3 mL
B. RPA, 22.3 mL (net volume); regurgitant fraction, 33.2%
C. LPA, 13.0 mL (net volume); regurgitant fraction, 46.7%
D. Main pulmonary artery, 33.3 mL (net volume); regurgitant fraction, 44.2%
E. RPA + LPA, 35.3 mL
F. Percentage of flow to the RPA and LPA—RPA:LPA = 63%:37%


 PDF
PDF ePub
ePub Citation
 Print
Print






 XML Download