

 PDF
PDF Citation
 Print
Print


INTRODUCTION
Neuroblastoma is the most common extracranial solid tumor in children. The clinical behavior of neuroblastoma is highly complex and heterogeneous. Some tumors either regress spontaneously or mature into a benign tumor without any treatment, whereas others progress rapidly and refractory to any treatment. These extensive and metastatic tumors frequently show high-level amplification of the MYCN locus. MYCN amplification is the genetic aberration that is most consistently and strongly correlated with poor outcome. Its association with poor outcome is not altered by otherwise favorable disease characteristics.12
Chemotherapy using cytotoxic drugs kills tumor cells by provoking apoptosis in sensitive tumors.34 Early response to induction chemotherapy has prognostic significance in childhood cancer, such as acute lymphoblastic leukemia and bone tumors.5678 Moreover, a recent report suggested that the degree of tumor volume reduction in the early phase of induction chemotherapy was also prognostic in patients with high-risk neuroblastoma.9 In this context, understanding the expression profile of pro-apoptotic or anti-apoptotic regulatory molecules in tumor cells might be crucial not only for evaluating drug sensitivity, but also for predicting long-term treatment outcomes.
The neurotrophins (NTs), including nerve growth factor, brain-derived neurotrophic factor, NT-3, and NT-4/5, and their preferred receptors, tropomyosin receptor kinases (TrkA, TrkB and TrkC) are anti-apoptotic and proto-oncogenic molecules.1011121314 NT/Trk signaling regulates neural development and maintenance of the neural network.1315 However, these molecules have also been shown to play a critical role in the tumorigenesis of neuronal or neuroendocrine origin cancers.1617 The first evidence for this role was reported in neuroblastoma and its association with MYCN amplification is often addressed in the literature.181920 Among several NT receptors, TrkC has emerged as an interesting research topic for its unusual properties of both an oncogene and a tumor suppressor. These features can be explained by the hypothesis that TrkC is a dependence receptor triggering the apoptosis signal pathway in the absence of its ligand (NT-3); it also provides a survival advantage in the presence of NT-3 by inactivating TrkC-induced apoptosis.1721222324252627 However, TrkC's preferential ligand NT-3 has never been of central interest. No study has been conducted on the clinical relevance of its expression despite some evidence of its existence and action independent of TrkC in tumors.132124262829 For these reasons, we analyzed NT-3 expression in 240 patients with neuroblastoma to investigate the clinical significance of NT-3 itself.
METHODS
Patients and tumor evaluation
A total of 240 patients who were newly diagnosed with neuroblastoma from May 1997 to November 2015 were enlisted for this study, and paraffin-embedded tissues were collected. Medical records of all patients were reviewed retrospectively. Tumor staging using the International Neuroblastoma Staging System and disease extent was evaluated by imaging studies such as computerized tomography (CT), magnetic resonance imaging (MRI), 131I- or 123I-metaiodobenzylguanidine (MIBG) scan, technetium99 bone scan, and bone marrow biopsy specimens. MYCN amplification was determined by competitive polymerase chain reaction (PCR), quantitative reverse transcription PCR, or fluorescence in situ hybridization. Tumors were classified as having favorable or unfavorable pathology according to the International Neuroblastoma Pathology Classification. Levels of serum lactic dehydrogenase, ferritin, neuron-specific enolase, and urine vanillylmandelic acid were measured routinely at diagnosis. Risk stratification was based on age, stage, and MYCN amplification status. Stage 1, 2, and 4S tumors were stratified into the low-risk group if MYCN was not amplified, whereas stage 4 tumors in patients older than 12 months (until 2008) or 18 months (since 2009) or any tumors with amplified MYCN were classified as the high-risk group. The intermediate-risk group includes all other tumors not mentioned above.
Treatment protocol
Excisional biopsy of the primary tumor was preferred for diagnosis if the tumor was resectable. Otherwise, incisional or percutaneous needle biopsy was performed, and definitive tumor resection was delayed until after six chemotherapy cycles were completed. A combination of CEDC (cisplatin + etoposide + doxorubicin + cyclophosphamide) and ICE (ifosfamide + carboplatin + etoposide) regimens were used for induction chemotherapy in an alternating manner. Low-risk patients underwent surgery with (stage 2) or without (stage 1) six cycles of preoperative or postoperative chemotherapy. Intermediate-risk patients received nine cycles of chemotherapy followed by differentiation therapy with 13-cis-retinoic acid. For high-risk patients, tandem high-dose chemotherapy and autologous stem cell transplantation (HDCT/auto-SCT) with total body irradiation (until 2008) or high-dose 131I-MIBG (12 or 18 mCi/kg) treatment (from 2009) followed by local radiation therapy, differentiation therapy, and immunotherapy using interleukin-2 were applied after nine cycles of induction chemotherapy.
Tumor volume measurement
Tumor volume was measured at diagnosis and after three cycles of induction chemotherapy by summing manually drawn areas on CT or MRI scans multiplied by slice thickness using computer software (Advantage Workstation, Volume Share version 2.0; GE Healthcare, Madison, WI, USA). The percent tumor volume after three cycles of chemotherapy were then calculated and compared with primary tumor volume at diagnosis. This manner of measurement was verified and used in previous reports from our centers.9
Real-time quantitative PCR
Total RNA was extracted using RNeasy mini kit (Qiagen, Hilden, Germany). A 1ug of total RNA RT-PCR was transcribed using the QuantiTect Reverse Transcription kit (Qiagen) and performed by RT2 profiler PCR array (Qiagen) which includes NT-3′s primer, using a real-time PCR instrument (Applied Biosystems, CA, USA). The cycle threshold fluorescence values are calculated using the SDS 2.4 software (applied Biosystems). The relative expression of NT-3 was normalized to housekeeping genes. PCR conditions are used; hold for 10 minutes at 95°C, followed by 40 cycles of 15 seconds at 95, and 1 minute at 60°C.
Immunohistochemistry
NT-3 stain
After fixing and embedding the tissue, samples cut with 3 μm thickness were deparaffinized and rehydrated. The samples were pretreated with envision FLEX target retrieval solution by PR Link instrument. The sections were incubated with peroxidase-blocking solution for 5 minutes and then incubated with NT-3 antibody (1:100 dilution; Abcam Inc., Cambridge, UK) overnight at 4°C. Following incubation with horseradish peroxidase (HRP)-conjugated secondary antibodies of the DAKO EnvisionTM detection kit (DAKO, Glostrup, Denmark) for 50 minutes at room temperature, a chromogen reaction was done using 3,3′-diaminobenzidine (DAB), and counterstaining was performed with hematoxylin for 30 seconds.
TrkC stain
Specimens were sectioned at 3 μm and stained on positively charged glass slides. Deparaffinization, rehydration, and antigen retrieval were performed using ER1 (prediluted; pH 6.0) antigen retrieval solution on the Bond-max Leica automated slide stainer (Leica Biosystem, Melbourne, Australia) for 40 minutes at 97°C. The sections were incubated with peroxidase-blocking solution for 10 minutes and then incubated with primary Anti-NTRK3/TRKC Antibody (IHC-plus™ LS-B2176, 1:500, LifeSpan Biosciences, Seattle, USA), for 60 minutes at room temperature followed by incubation with polyclonal rabbit anti-goat immunoglobulins/HRP for 60 minutes at room temperature. The sections were developed with DAB, counterstained with hematoxylin for 30 seconds.
Interpretation
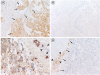
The immunostained sections were reviewed by a senior pathologist in order to determine positivity in the tumor tissue (Fig. 1).
Fig. 1
Representative immunostaining of NT-3 and TrkC. (A) A case of neuroblastoma positive for NT-3. Neuroblasts are positive for NT-3 (arrows), in contrast to stroma cells negative for it. (B) A case of neuroblastoma negative for NT-3. (C) A case positive for TrkC. Neuroblasts are positive for TrkC, while non-neoplastic lymphocytes are negative for it (arrow heads). (D) A case negative for TrkC. Neuroblasts are negative for TrkC (arrows), whereas non-neoplastic chromaffin cells in adrenal medulla are positive for TrkC (arrow heads).
NT-3 = neurotrophin-3, TrkC = tropomyosin receptor kinase C.
Statistics
Patients were categorized into two groups according to the presence or absence of NT-3 expression. Pearson's χ2 test and Fisher's exact test were used to compare differences in NT-3 expression with respect to known prognostic factors. For comparison of early treatment response, the degree of tumor volume reduction was analyzed by Mann-Whitney U test. For univariate survival analysis, overall survival (OS) and progression-free survival (PFS) rates with standard errors were estimated by Kaplan-Meier curves. The log-rank test was used to compare survival rates between NT-3 negative and positive patients. Multivariate analyses comprising known prognostic factors for progression-free survival were performed using the Cox regression. All statistical tests were 2-sided. P values less than 0.05 were considered statistically significant.
RESULTS
Patient characteristics
The median age at diagnosis of all 240 patients (135 boys and 105 girls) was 22 months (range, 0–210 months), and the most common primary site was the abdomen (185 patients). There were 72, 60, and 108 low-risk, intermediate-risk, and high-risk patients, respectively. Fifty-two (21.8%) patients had MYCN amplified tumors. The median follow-up duration among 240 patients was 75 months (range, 0–223 months) from diagnosis. The 5-year OS and PFS rates were 82.8% ± 2.5% and 81.7% ± 2.6%, respectively.
Clinical significance of NT-3 expression in all patients
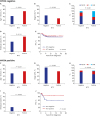
Positive NT-3 expression was observed in 97 (40.4%) of 240 patients. The association between NT-3 expression and known prognostic factors are presented in Table 1 and Fig. 2A-D. NT-3 expression was associated with older age (> 18 months) at diagnosis (P < 0.001), localized tumors (P = 0.033), and more differentiated histology (P < 0.001). However, there was no difference in MYCN amplification between patients with NT-3 expression and those without. Percent residual tumor volume after three cycles of chemotherapy was used as a surrogate marker of early treatment response. There was no difference in the degree of tumor volume reduction between patients with NT-3 expression and those without (Fig. 2E). Also, there was no significant difference in the 5-year OS and PFS rates between patients with NT-3 expression and those without (OS, 84.3% ± 3.7% vs. 81.8% ± 3.3%, P = 0.752; PFS, 86.7% ± 3.6% vs. 78.2% ± 3.6%, P = 0.082) (Fig. 2F). We also performed Q-RT-PCR in 56 patients to analyze the association between NT-3 mRNA expression and clinical variables. We classified patients into two groups (high expression above median versus low expression below median) and compared their association with known prognostic variables. The results were similar to those seen in the comparison between the immuno-histochemical NT-3 positive and negative groups. Also, there was no significant difference in early response to chemotherapy between the two groups. Lengths of follow-up were too short to compare long-term clinical outcomes in these patients because mRNA extraction was possible only in patients diagnosed recently.
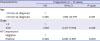
Table 1
Characteristics of patients at diagnosis according to NT-3 expression
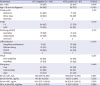
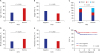
Fig. 2
Clinical significance of NT-3 expression. NT-3 expression was associated with (A) older age at diagnosis, (B) localized tumors, and (C) more differentiated histology. (D) However, there was no difference in the proportion of MYCN amplification according to NT-3 expression. (E, F) There was no difference in degree of tumor volume reduction or PFS between patients with NT-3 expression and those without.
NT-3 = neurotrophin-3, GNB = ganglioneuroblastoma, D = differentiated, PD = poorly differentiated, UD = undifferentiated, PFS = progression-free survival.
Clinical significance of NT-3 expression according to MCYN amplification
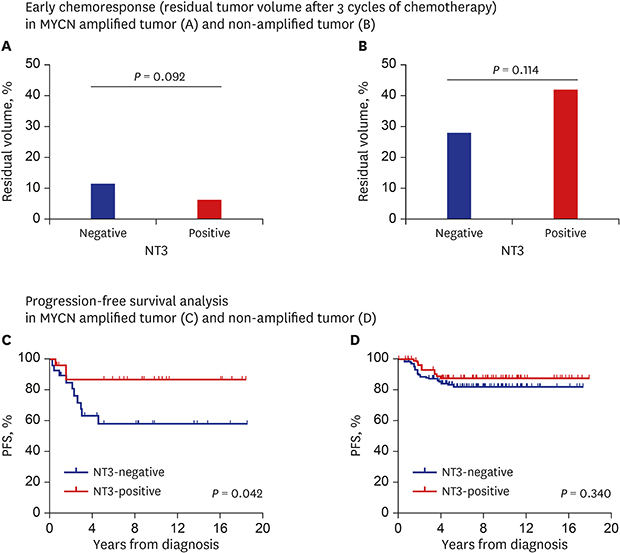
Different types of NT receptors are expressed depending on the status of MYCN amplification.193031 Therefore, we re-analyzed the clinical relevance of NT-3 expression by dividing patients into two subgroups according to MYCN amplification. In subgroup analysis according to MYCN amplification, there was a similar association between NT-3 expression and clinicopathologic parameters except pathology, regardless of MYCN amplification status. However, the significance of these associations was reduced in patients with MYCN amplified tumors (Fig. 3A-C vs. Fig. 3F-H). Interestingly, treatment results differed between the two groups. While the percent residual tumor volume at the early phase of induction chemotherapy had a tendency to be higher with NT-3 expression in patients with MYCN non-
Fig. 3
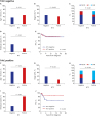
Clinical significance of NT-3 expression in subgroup analysis according to MYCN amplification.
(A-C vs. F-H) There was similar association between NT-3 expression and clinicopathologic parameters, such as age at diagnosis and stage regardless of MYCN amplification status. However, treatment results differed between the two groups. (D, I) While percent residual tumor volume at early phase of induction chemotherapy tended to be higher if NT-3 was expressed in patients with MYCN non-amplified tumors, it was lower in patients with MYCN amplified tumors with borderline significance. (E, J) Furthermore, while there was no difference in PFS according to NT-3 expression in patients with MYCN non-amplified tumors, patients with MYCN amplified tumors showed better PFS if NT-3 was expressed.
NT-3 = neurotrophin-3, GNB = ganglioneuroblastoma, D = differentiated, PD = poorly differentiated, UD = undifferentiated, PFS = progression-free survival.
amplified tumors (P = 0.114) (Fig. 3D), it was lower in patients with MYCN amplified tumors with borderline significance (P = 0.092) (Fig. 3I). Furthermore, while there was no difference in PFS according to NT-3 expression in patients with MYCN non-amplified tumors (Fig. 3E), patients with MYCN amplified tumors showed significantly better PFS if NT-3 was expressed (86.9% ± 7.1% vs. 58.2% ± 10.3%, P = 0.042) (Fig. 3J). Multivariable Cox analysis revealed that NT-3 was an independent risk predictor of PFS with statistical significance along with older age (> 18 months) at diagnosis in patients with MYCN amplified tumors (hazard ratio, 0.246; 95% confidence interval, 0.061–0.997; P = 0.050, Table 2).
Table 2
Multivariate analysis of risk factors for progression in MYCN amplified neuroblastoma
Clinical significance of NT-3 expression according to TrkC expression
Different treatment outcomes (early treatment response and PFS) according to NT-3 expression were found in patients with MYCN amplified tumors, as described above. We hypothesized that these results may be due to different NT receptor profiles between patients with or without MYCN amplification. To verify this hypothesis, expression of TrkC, the primary receptor for NT-3, was analyzed. TrkC expression showed similar associations with known prognostic factors as those observed with NT-3 expression (Table 3 and Fig. 4A-C). However, MYCN amplification was rarely found in patients with TrkC expression (Table 3 and Fig. 4D). In addition, TrkC expression was associated with a poorer early treatment response (Fig. 4E), although there was no difference in PFS (Fig. 4F). Next the clinical relevance of NT-3 expression was compared for patients with and without TrkC expression. NT-3 expression showed similar associations with known prognostic factors irrespective of TrkC expression although the significance of these associations was somewhat reduced in patients without TrkC expression (Fig. 5A-C vs. Fig. 5F-H). However, there was opposite early treatment response according to NT-3 expression between patients with and without TrkC expression. Percent residual tumor volume at the early phase of induction chemotherapy was lower if NT-3 was expressed in patients without TrkC expression with borderline significance (P = 0.053) (Fig. 5D). Conversely, it was higher in patients with TrkC expression (P = 0.023) (Fig. 5I). However, unlike the early treatment response result, there was no difference in PFS according to NT-3 expression irrespective of TrkC expression (Fig. 5E and J).
Table 3
Characteristics of patients at diagnosis according to TrkC expression
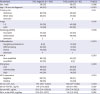
Values are presented as number (%) or median (range).
TrkC = tropomyosin receptor kinase C, INPC = International Neuroblastoma Pathology Classification, PD = poorly differentiated, UD = undifferentiated, NT-3 = neurotrophin-3, LDH = lactate dehydrogenase, NSE = neuron-specific enolase, VMA = vanillylmandelic acid.
Fig. 4
Clinical significance of TrkC expression. (A-C) TrkC expression showed similar associations with known prognostic factors as those observed in NT-3 expression. (D) However, MYCN amplification was rarely detected in tumors with TrkC expression. (E, F) In addition, TrkC expression was associated with poorer early treatment response, although there was no difference in PFS.
TrkC = tropomyosin receptor kinase C, GNB = ganglioneuroblastoma, D = differentiated, PD = poorly differentiated, UD = undifferentiated, PFS = progression-free survival, NT-3 = neurotrophin-3.
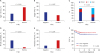
Fig. 5
Clinical significance of NT-3 expression in subgroup analysis according to TrkC expression. (A-C vs. F-H) NT-3 expression showed similar associations with known prognostic factors irrespective of TrkC expression. However, there was opposite early treatment response according to NT-3 expression between patients with TrkC expression and those without. (D, I) While the percent residual tumor volume at early phase of induction chemotherapy was lower if NT-3 was expressed in patients without TrkC expression with borderline significance, it was higher in patients with TrkC expression. (E, J) However, there was no difference in PFS according to NT-3 expression irrespective of TrkC expression.
TrkC = tropomyosin receptor kinase C, NT-3 = neurotrophin-3, GNB = ganglioneuroblastoma, D = differentiated, PD = poorly differentiated, UD = undifferentiated, PFS = progression-free survival.
DISCUSSION
This study investigated NT-3 expression and its association with clinical features at diagnosis and treatment response/outcomes in neuroblastoma. It suggests that NT-3 expression in neuroblastoma has its own clinical significance independent of TrkC expression, and its prognostic significance differs depending on the status of MYCN amplification and/or TrkC expression.
Most studies that examined the role of NT/NT receptors in neuroblastoma focused on the clinical significance of NT receptor expression, considered one of prognostic factors.1222 Among several NT receptors, TrkC has been covered in numerous studies as its distinctive features unlike other NT receptors. TrkC is a tyrosine kinase receptor and it was expected to behave as a proto-oncogene. However, TrkC acts as a tumor suppressor in various cancers, including neuroblastoma, medulloblastoma, and colon cancer and its expression was reported to be associated with good prognosis.17182122252632 This paradox has been explained by the proposal that TrkC is a dependence receptor that triggers apoptosis in the absence of a ligand.2124 Our results support the clinically dependent nature of TrkC because the early response to induction chemotherapy was poorer in patients with TrkC/NT-3-co-expressing neuroblastoma than in patients with only TrkC-expressing neuroblastoma.
Meanwhile, our study suggests that NT-3 has its own clinical significance independent of TrkC. The relevance of NT-3 expression with clinicopathologic variables was not altered whether TrkC was expressed or not, although the degree of significance varied. More importantly, NT-3 expression was suspected to be a good prognostic marker in patents with MYCN amplified neuroblastoma, and these results were not explained by the absence of TrkC expression with MYCN amplification only. A possible explanation is that NT-3 might develop pro-apoptotic signals mediated through other NT receptors because NT-3 can bind and activate other receptors such as TrkA, TrkB and p75NTR.132829333435 Specifically, p75NTR might be a candidate receptor to elucidate our results. The p75NTR receptor creates apoptosis signals in the absence of Trk receptors while apoptosis is inhibited when it is co-expressed with Trk receptors.133031
Targeting of NTs or Trk receptors is considered novel adjuvant chemotherapy. There is some evidence that selective or pan-Trk inhibitors such as lestaurtinib enhance the antitumor efficacy of chemotherapy, and clinical trials of some inhibitors are underway.3637 NT-3 interference also has evidence of antitumor effect in both in vitro and in vivo studies.24 However, according to our results, those treatments should be applied selectively because they may be either therapeutic or pathogenic under different circumstances. There should be clear demonstration and explanation of interaction between each NT and various NT receptors in neuroblastoma. The role of MYCN amplification in expression and interaction of NT/NT receptors should also be explored.
Our study has some limitations. First, this is an observational study without functional studies on molecular biological mechanisms to explain how these unexpected results may be observed. Second, we evaluated gene expression mostly in protein level based on immunohistochemistry because mRNAs should be extracted from fresh tissue, which was possible only in patients who were diagnosed recently. Third, we evaluated only NT-3 and TrkC expression in this study. It is necessary to explore the clinical relevance of various types of NTs and NT receptors in the future study. Nonetheless, our study showed some unexpected and important findings.
In summary, we demonstrated that NT-3 expression has its own clinical significance in neuroblastoma independent of its receptor, TrkC. NT-3 expression is associated with older age at diagnosis, localized tumors, more differentiated histology, better (poorer) early treatment response in the absence (presence) of its primary receptor TrkC, and significantly better PFS in MYCN amplified neuroblastoma. Therefore, NT-3 expression should be carefully appreciated before interpreting its clinical meaning. Furthermore, the status of MYCN amplification and NT receptor profile should be verified when NT-3 is considered a therapeutic target.
 XML Download