

 PDF
PDF ePub
ePub Citation
 Print
Print


Abstract
Purpose
This study was conducted to identify the differences in symptoms, depression, intimacy and quality of life (QOL), and the factors influencing QOL in men with prostate cancer undergoing androgen deprivation therapy (ADT).
Methods
This study used a cross-sectional, descriptive research design. Data were collected using a self-report questionnaire from 122 men with prostate cancer undergoing ADT. The data collection period was from November 19, 2018 to February 25, 2019. Data were analyzed using t-tests, χ2 tests, Fisher's exact tests, 4-way ANOVA and multiple regression.
Results
The mean age of the men was 70.3±7.3. There were statistically significant differences in urinary, bowel, sexual and hormonal symptoms according to treatment duration (F=23.74, p<.001). Factors influencing QOL explained 55% of the variance (adjusted R2=.55, p<.001). These factors were depression (β=-.52, p<.001), intimacy (β=.23, p=.001), ADT duration (β=-.17, p=.011), economic status middle (β=.23, p=.006), high (β=.29, p=.001) and sleep (β=.15, p=.023).
Go to : 
References
1. National Cancer Information Center. https://www.cancer.go.kr. [Assessed June 2, 2019].
2. Grunfeld EA, Halliday A, Martin P, Drudge-Coates L. Andropause syndrome in men treated for metastatic prostate cancer: a qualitative study of the impact of symptoms. Cancer Nurs. 2012; 35:63–9.
3. Benedict C, Traeger L, Dahn JR, Antoni M, Zhou ES, Bustillo N, et al. Sexual bother in men with advanced prostate cancer undergoing androgen deprivation therapy. J Sex Med. 2014; 11:2571–80.

4. Lee M, Jim HS, Fishman M, Zachariah B, Heysek R, Biagioli M, et al. Depressive symptomatology in men receiving androgen deprivation therapy for prostate cancer: a controlled comparison. Psychooncology. 2015; 24:472–7.
5. Sevilla C, Maliski SL, Kwan L, Connor SE, Litwin MS. Long-term quality of life in disadvantaged men with prostate cancer on androgen-deprivation therapy. Prostate Cancer Prostatic Dis. 2012; 15:237–43.
6. Baker H, Wellman S, Lavender V. Functional quality-of-life outcomes reported by men treated for localized prostate cancer: a systematic literature review. Oncol Nurs Forum. 2016; 43:199–218.
7. Donovan KA, Gonzalez BD, Nelson AM, Fishman MN, Zachariah B, Jacobsen PB. Effect of androgen deprivation therapy on sexual function and bother in men with prostate cancer: a controlled comparison. Psychooncology. 2018; 27:316–24.
8. Baguley BJ, Skinner TL, Leveritt MD, Wright OR. Nutrition therapy with high intensity interval training to improve prostate cancer-related fatigue in men on androgen deprivation therapy: a study protocol. BMC Cancer. 2017; 17:1.
9. Ahmadi H, Daneshmand S. Androgen deprivation therapy: evidence-based management of side effects. BJU Int. 2013; 111:543–8.
10. Yang GJ, Kang JH, Suh IS, Kim HY. Health-related quality of life and depression after radical prostatectomy or hormonal therapy. Asian Oncol Nurs. 2013; 134:248–55.
11. Watts S, Leydon G, Birch B, Prescott P, Lai L, Eardley S, et al. Depression and anxiety in prostate cancer: a systematic review and metaanalysis of prevalence rates. BMJ Open. 2014; 4:e003901.
12. Cho HM, Yoo EK. Effects of depression, family support on resilience in patients with gynecological cancer. J Korea Soc Wellness. 2015; 10:183–95.
13. Colloca G, Colloca P. The effects of social support on health-related quality of life of patients with metastatic prostate cancer. J Cancer Educ. 2016; 31:244–52.
14. Kim SC. Characteristics of prostate cancer that underwent prostatectomy at young age [dissertation]. Ulsan: Ulsan Univ.;2010.
15. Wei JT, Dunn RL, Litwin MS, Sandler HM, Sanda MG. Development and validation of the expanded prostate cancer index composite (EPIC) for comprehensive assessment of health-related quality of life in men with prostate cancer. Urology. 2000; 56:899–905.
16. Chung KJ, Kim JJ, Lim SH, Kim TH, Han DH, Lee SW. Development and validation of the Korean version of expanded prostate cancer index composite: questionnaire assessing health-related quality of life after prostate cancer treatment. Korean J Urol. 2010; 51:601–12.
17. Radloff LS. The CES-D scale: a self-report depression scale for research in the general population. Appl Psychol Meas. 1977; 1:385–401.
18. Chon KK, Choi SC, Yang BC. Integrated adaptation of CES-D in Korea. Korean J Health Psychol. 2001; 6:59–76.
19. Lee KH. A measure of marital intimacy. J Korean Home Econ Assoc. 1995; 33:235–49.
20. Alibhai SM, Breunis H, Timilshina N, Naglie G, Tannock I, Krahn M, et al. Long-term impact of androgen-deprivation therapy on physical function and quality of life. Cancer. 2015; 121:2350–7.
21. Punnen S, Cowan JE, Chan JM, Carroll PR, Cooperberg MR. Long-term health-related quality of life after primary treatment for localized prostate cancer: results from the CaPSURE registry. Eur Urol. 2015; 68:600–8.
22. Lee SJ, Lee YS, Kim YE. The degree of elderly sexual desire and their attitudes towards sex. Korean J Clin Soc Work. 2013; 10:1–21.
23. Tripp DA, Verreault P, Tong S, Izard J, Black A, Siemens DR. Biopsychosocial impact of prostate cancer and androgen-deprivation therapy. Can Urol Assoc J. 2017; 11:338–43.
24. Oh SY, Ryu EJ. Educational needs for sexual health and its effect on depression and the quality of life in patients with prostate cancer. Asian Oncol Nurs. 2015; 15:163–70.
25. Nead KT, Sinha S, Yang DD, Nguyen PL. Association of androgen deprivation therapy and depression in the treatment of prostate cancer: a systematic review and metaanalysis. Urol Oncol. 2017; 35:664. .e1–9.
26. Beck AM, Robinson JW, Carlson LE. Sexual values as the key to maintaining satisfying sex after prostate cancer treatment: the physical plea-sure-relational intimacy model of sexual motivation. Arch Sex Behav. 2013; 42:1637–47.
27. Lee I. The effect of communication on marital adjustment of cancer patients and their spouses-focusing on the actor effect and partner effect. Korean J Soc Welf. 2011; 63:179–205.
28. Nam K, Tae Y, Kim C, Lee S. Influence of uncertainty and uncertainty appraisal on quality of life in prostate cancer patients after prostatectomy. Asian Oncol Nurs. 2017; 17:45–55.
29. Jun SS, Kim DH, Kim MY. Sleep disturbance in prostate cancer patients. J Korean Acad Fundam Nurs. 2010; 17:169–76.
30. Gagliano-Jucá T, Travison TG, Nguyen PL, Kantoff PW, Taplin ME, Ki-bel AS, et al. Effects of androgen deprivation therapy on pain perception, quality of life, and depression in men with prostate cancer. J Pain Symptom Manage. 2018; 55:307–317.e1.
Go to :
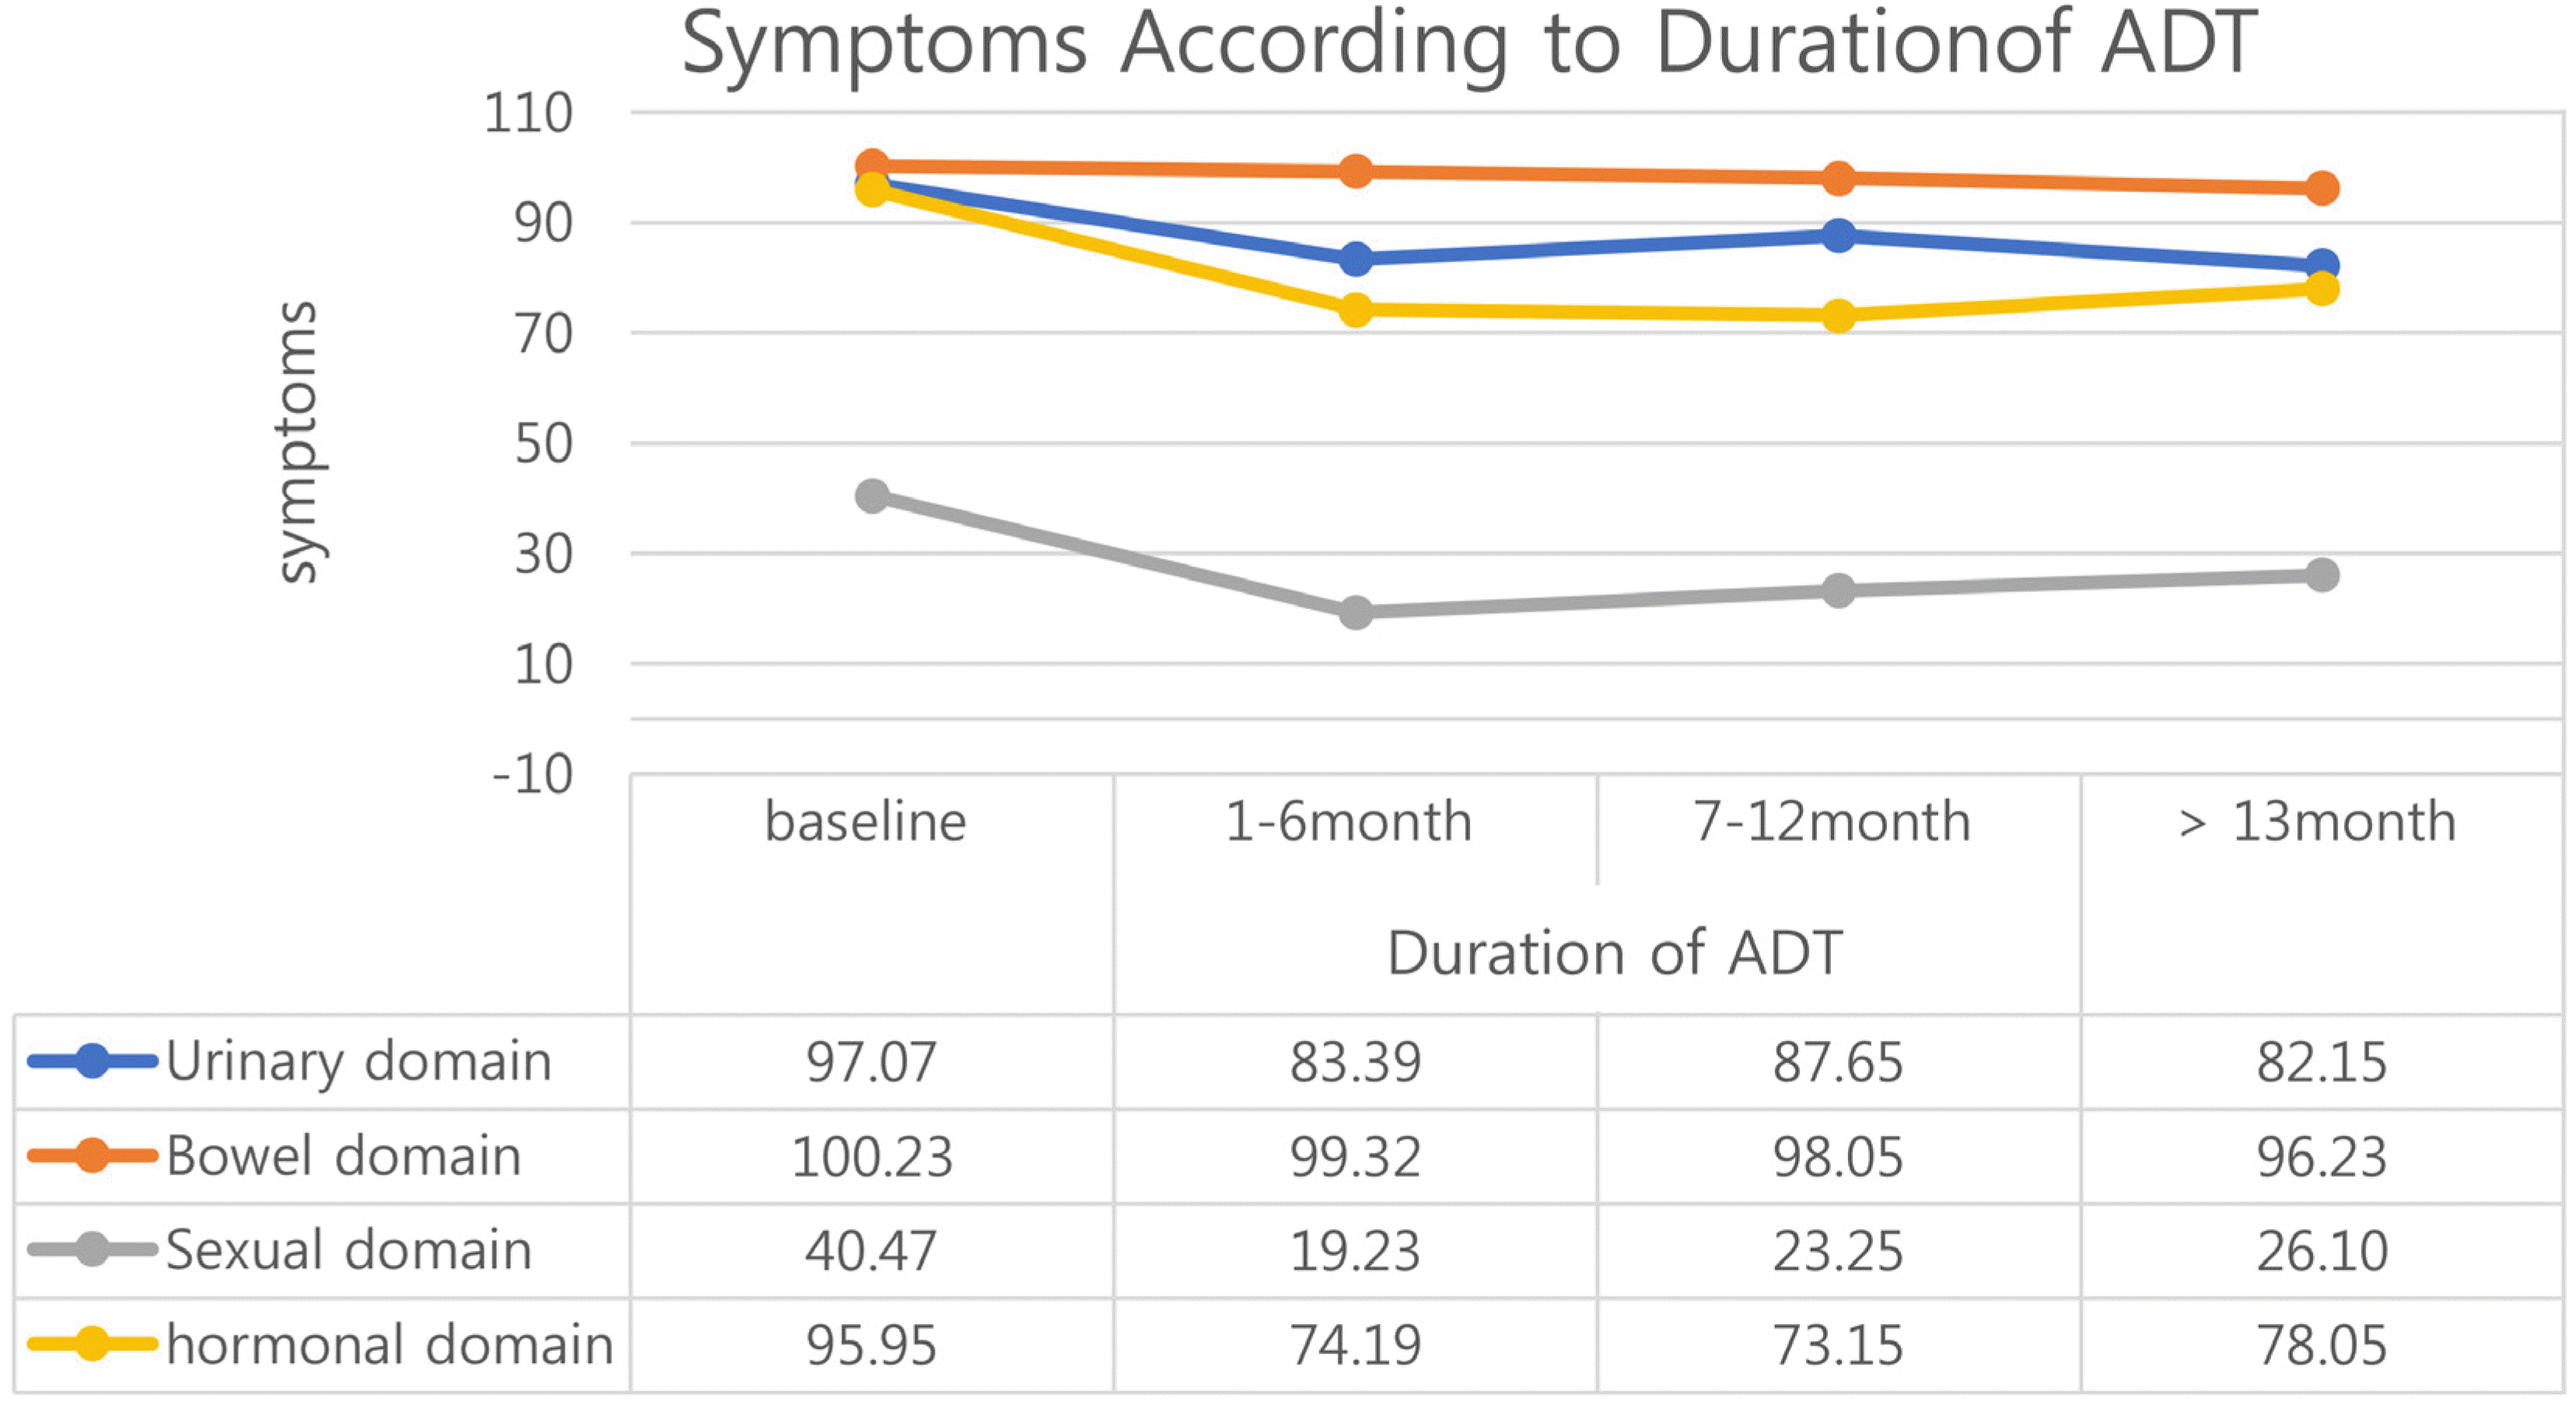
Table 1.
Homogeneity Tests on Participant's Characteristics (N= 122)
Table 2.
Descriptive Statistics of Symptoms, Depression, Intimacy, and Quality of Life (N= 122)
Table 3.
Comparisons of Physical Symptoms, Depression, Intimacy, and Quality of Life* (N= 122)
Table 4.
The Influencing Factors on Quality of Life (N=122)
 XML Download