Journal List > J Clin Neurol > v.15(4) > 1134812

Yoo, Chung, Lee, Sohn, and Kang: The Influence of Body Mass Index at Diagnosis on Cognitive Decline in Parkinson's Disease

Abstract

Background and Purpose

Associations between alterations in body mass index (BMI) and cognitive function have been reported in Parkinson's disease (PD). We investigated whether the BMI at a PD diagnosis is associated with cognitive decline and the future development of dementia.

Methods

We recruited 70 patients with de novo PD who underwent neuropsychological testing every 3 years and were followed up for more than 6 years. We classified patients into the following three groups based on their BMI at the diagnosis: under-/normal weight (n=21), overweight (n=22), and obese (n=27). We evaluated differences in the rate of cognitive decline over time among the groups using linear mixed models and the conversion rate to dementia using survival analysis.

Results

The obese patients with PD showed a slower deterioration of global cognitive function as well as language and memory functions than did the under-/normal-weight group during the 6-year follow-up. The three BMI groups showed different rates of conversion to dementia (log-rank test: p=0.026). The combined overweight and obese group showed a lower risk of developing dementia compared with the under-/normal-weight group (hazard ratio= 0.36, 95% CI=0.12–0.82, p=0.046).

Conclusions

We have demonstrated that a higher-than-normal BMI at the time of a PD diagnosis has a protective effect against the deterioration of cognitive function and the conversion to dementia.

INTRODUCTION

Alterations in body mass index (BMI) and body weight are known to be associated with Parkinson's disease (PD) and its various motor and nonmotor symptoms.12 However, a clear correlation between BMI and PD has not yet been established. Patients with PD were found to have a lower BMI than controls in a meta-analysis,1 while overweight and normal-weight individuals were more prevalent in the PD group in another cross-sectional study.3 There have also been conflicting reports on whether patients with PD gain or lose weight between before and after their diagnosis. One prospective study found that patients with PD lost weight compared with several years before the diagnosis,4 while a case–control study found no changes in BMI after the onset of PD,5 and a community-based study observed weight gain during early PD.6
The association between BMI and cognitive function has been investigated in numerous healthy and diseased populations. In cognitively normal populations, the association between BMI and cognitive function varies with age. A higher BMI in midlife is associated with a higher risk of dementia, whereas the association is reversed in late life.7 In patients with mild cognitive impairment (MCI) or Alzheimer's disease (AD), a lower BMI is associated with faster cognitive decline and a higher risk of developing dementia.89 PD patients whose BMI or weight decreased during follow-up showed a worse baseline cognition or a faster cognitive decline than those who maintained a stable BMI or weight.101112 However, no studies have examined in detail the pattern of deterioration in each cognitive domain according to BMI in patients with PD.
Therefore, the aim of this study was to determine whether the BMI at the diagnosis in patients with de novo PD influences the subsequent cognitive decline and the future development of dementia. We also investigated the pattern of cognitive dysfunction in terms of the overall cognitive ability and the ability in each cognitive domain over 6 years of follow-up.

METHODS

Study design and patients

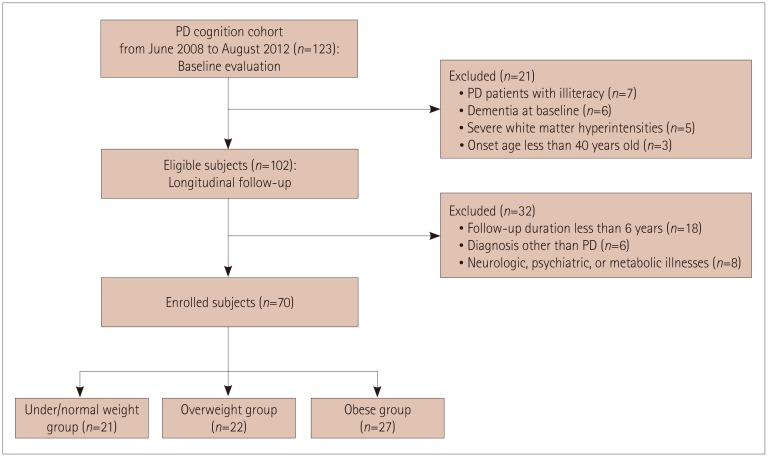
This retrospective cohort study enrolled patients with PD from the Movement Disorders outpatient clinic in the Yonsei University Severance Hospital. We enrolled 123 drug-naïve patients in the PD cognition cohort who between June 2008 and August 2012 had completed baseline evaluations including neuropsychological tests (NPs), brain MRI, and N-[3-(18F)fluoropropyl]-2β-carbon ethoxy-3β-(4-iodophenyl) nortropane (18F-FP-CIT) PET. The patients were followed up longitudinally while they underwent NPs every 3 years. At the baseline evaluation, we excluded patients with PD who were illiterate, already met the criteria for dementia, had severe white-matter hyperintensities (WMHs),13 or had developed PD when younger than 40 years (n=3). During the longitudinal follow-up we further excluded patients from among the 102 eligible patients who had follow-up durations shorter than 6 years, were diagnosed with disorders other than PD, or had neurological or psychiatric illnesses or medical comorbidities that affect cognition. We finally enrolled 70 patients with PD who had been followed up for more than 6 years and underwent regular NPs every 3 years. The enrollment flowchart for the study patients is presented in Fig. 1.
PD was diagnosed based on the clinical diagnostic criteria of the United Kingdom PD Society Brain Bank.14 All patients showed excellent responses to dopaminergic medication and had decreased dopamine transporter availability on 18F-FP-CIT scans. The Institutional Review Board of Yonsei University Severance Hospital approved this study (IRB No. 4-2016-0210). Written informed consent was obtained from all subjects who participated in this study.

Clinical assessment

The baseline height and weight were measured in all patients at their initial visits, from which the BMI was calculated. According to the revised Asia-Pacific BMI criteria of the World Health Organization for western Pacific regions, BMI was classified as follows based on Asians tending to have larger amounts of abdominal fat at lower BMIs15: underweight, BMI<18.5 kg/m2; normal weight, BMI ≥18.5 and <23 kg/m2; overweight, BMI ≥23 kg/m2 and <25 kg/m2; and obese, BMI ≥25 kg/m2. We divided the patients with PD into the following three groups: under-/normal weight, BMI <23 kg/m2 (n=21); overweight, BMI ≥23 and <25 kg/m2 (n=22), and obese, BMI ≥25 kg/m2 (n=27). The underweight participants were pooled with the normal-weight group because there were only three patients who had a BMI below 18.5 kg/m2.
We evaluated parkinsonian motor symptoms during a drug-naïve state at the time of 18F-FP-CIT PET scan acquisition using the Unified Parkinson's Disease Rating Scale (UPDRS) activities of daily living (UPDRS-II) and motor (UPDRS-III) subscales. We classified patients with PD according to clinical phenotypes into tremor-dominant or postural-instability/gait-difficulty parkinsonism.16 Other clinical indicators that could affect cognitive function were also measured, including the Beck Depression Inventory (BDI) for depression17 and the Cross-Cultural Smell Identification Test (CCSIT) for olfactory function.18 The levodopa-equivalent dose (LED) was calculated according to a previously described method.19

MRI scan acquisition and parameters

All MRI scans were acquired using a Philips 3-T scanner (Philips Intera, Philips Medical System, Best, the Netherlands) with a SENSE head coil (SENSE factor=2). Based on MRI images, we assessed visual rating scales of medial temporal atrophy (MTA) using Scheltens' scale (grade 0–4)20 and WMHs using the Fazekas scale (score 0–3 for periventricular and deep WMHs).13 The method used for MRI scan acquisition and the MRI parameters are described in detail in the Supplementary Material (in the online-only Data Supplement)

Neuropsychological evaluation and assessment of cognitive function

All patients underwent a standardized and comprehensive neuropsychological battery, the Seoul Neuropsychological Screening Battery,21 which covers five cognitive domains: 1) digit-span task and Stroop test for the attention domain, 2) the Korean version of the Boston Naming Test for the language domain, 3) the Rey-Osterrieth Complex-Figure Test (RCFT) copying and pentagon-drawing test for the visuospatial domain, 4) the Seoul Verbal Learning Test and RCFT (both immediate recall, 20-min delayed recall, and recognition) for the memory domain, and 5) the clock-drawing test and the Controlled Oral Word-Association Test for the frontal executive domain. Standardized z-scores are available for all scorable tests based on age- and education-matched norms. We considered a score for each cognitive item as abnormal when it was more than 1.5 SDs lower than the mean. Composite scores of each cognitive domain were calculated by dividing the sum of the z-scores by the number of tests. We calculated the following three summary scores to assess global cognitive performance: global z-score composite derived by averaging all z-scores, total Mini Mental State Examination (MMSE) score, and Clinical Dementia Rating Sum of Boxes (CDR-SOB).
PD with intact cognition was considered to be present when a subject had impairment on fewer than two items of the NP. PD with MCI was diagnosed based on level II criteria in accordance with the Movement Disorder Society Task Force guideline.22 PD patients with MCI reported subjective cognitive complaints and showed no evidence for abnormality when performing the activities of daily living, as judged both clinically and based on the Instrumental Activities of Daily Living scale. Patients were diagnosed with Parkinson's disease dementia (PDD) if they fulfilled its clinical criteria.23

Statistical analyses

Differences in demographics and NP results among the BMI groups were determined using nonparametric analysis. The Kruskal-Wallis test was used for continuous variables, and the obtained data were expressed as mean±SD values, while Pearson's χ2 test was applied to categorical variables, and the obtained data were expressed as a numbers and percentages. We used a linear mixed model with random and fixed effects to evaluate differences in the cognitive decline rate according to the BMI groups while adjusting for the age at PD onset, sex, years of education, UPDRS motor scores, and clinical phenotype. Post-hoc between-group and between-time comparisons were performed when the cognitive performance was found to differ after applying repeated measures. We performed a Kaplan-Meier analysis of the probability of progression to PDD and used a log-rank test to compare the Kaplan-Meier plots of the groups. Post-hoc subgroup analyses were performed using Bonferroni correction. The hazard ratio (HR) for converting to PDD was calculated using a Cox proportional-hazards model with covariates of age at PD onset, sex, years of education, and UPDRS motor score.

RESULTS

Baseline clinical and imaging characteristics

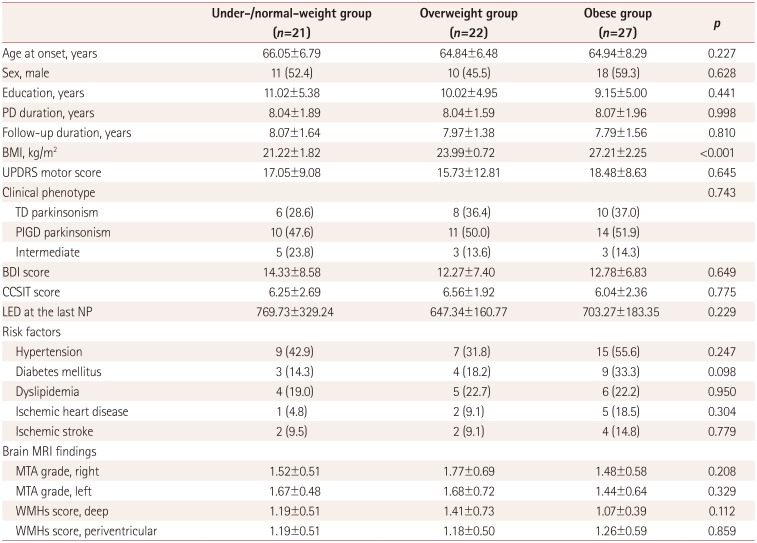
The clinical and imaging characteristics of the patients with PD are summarized in Table 1. All clinical variables including age, sex, years of education, disease and follow-up durations, UPDRS motor score, CCSIT score, BDI score, LED at the last NP, number of vascular risk factors, MTA grade, and WMHs score did not differ across the BMI groups.

Neuropsychological profiles

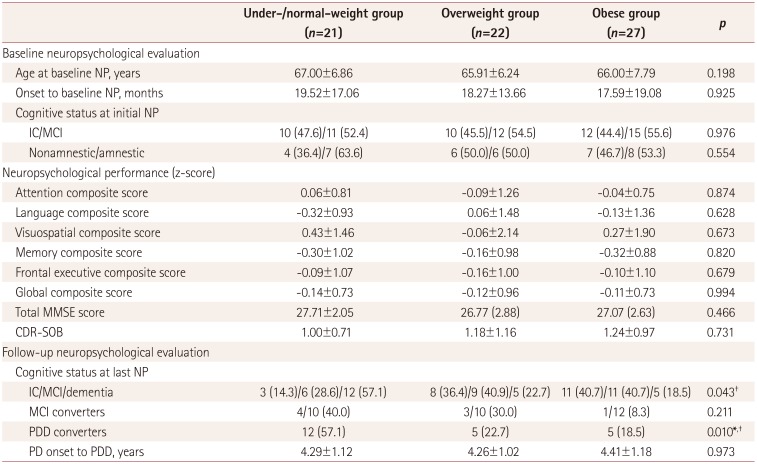
Table 2 presents the neuropsychological profiles of the patients with PD. There were no differences between the BMI groups in the distributions for the cognitive status and amnestic components at the initial neuropsychological evaluation, while there were differences in those for the cognitive status at the last NP. The proportion of those who converted to dementia during the follow-up period was higher in the under-/normal-weight group than in the overweight and obese groups, while all BMI groups contained comparable proportions of those who converted to MCI. There were no significant differences in age at the initial NP, the duration from PD onset to the baseline NP, or in the performance in each cognitive domain and global cognitive function at baseline. The duration from PD onset to PDD conversion did not differ among the PDD converters in the groups.

Comparison of the progression of cognitive decline

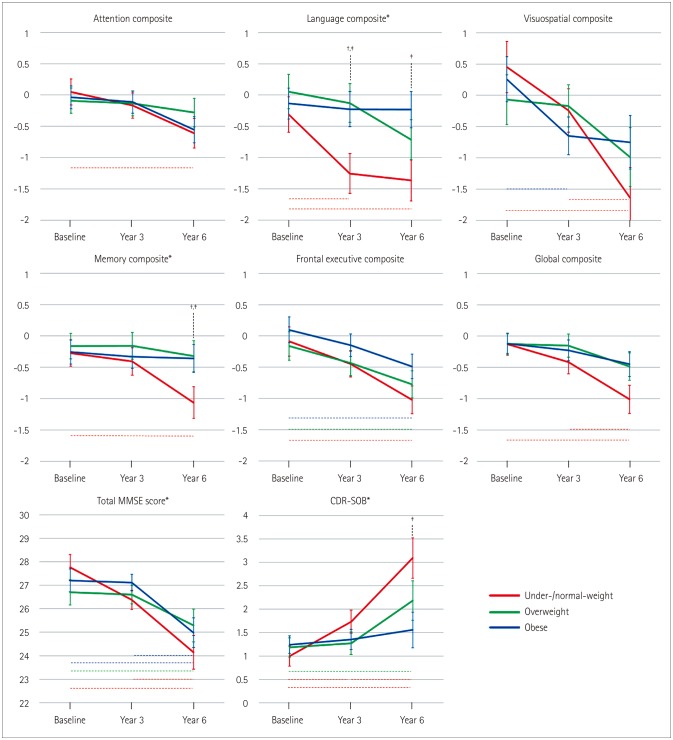
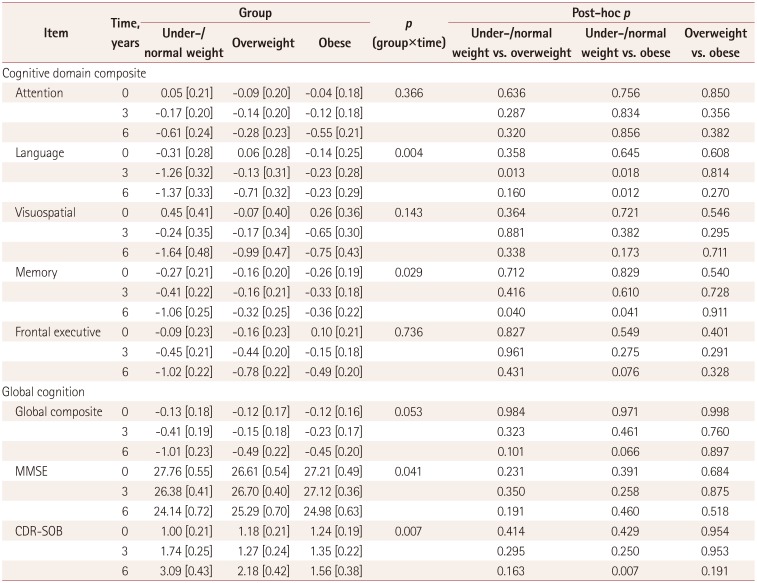
The longitudinal changes in cognitive function were compared in patients with PD grouped according to BMI (Table 3 and Fig. 2). A linear mixed model showed that the rates of decline in language, memory, total MMSE scores, and CDR-SOB differed between the BMI groups. After post-hoc analysis of the between-group comparison, the overweight and obese groups performed better in language function at the 3-year follow-up compared to the under-/normal-weight group. The language function at the 6-year follow-up was better in the obese group than the under-/normal-weight group. The overweight and obese groups showed a better cognitive performance in memory tasks at the 6-year follow-up compared to the under-/normal-weight group. The obese group showed a slower progression in CDR-SOB compared to the under-/normal-weight group at the 6-year follow-up. There were no differences between the overweight and obese groups in cognitive function at the 3-year and 6-year follow-up NPs.
The post-hoc analysis of the between-time comparisons revealed that the under-/normal-weight group showed significant deterioration in all cognitive domains and global cognition over 6 years. The overweight group showed significantly worse cognitive performance in frontal executive function, lower MMSE score, and higher CDR-SOB at the 6-year follow-up compared to baseline. The obese group experienced a significant decline in visuospatial function at the 3-year follow-up compared to baseline, in frontal executive function at the 6-year follow-up compared to baseline, and in total MMSE score at the 6-year follow-up compared to both baseline and the 3-year follow-up.

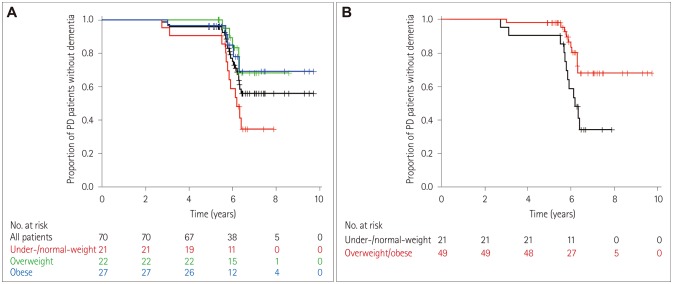
BMI as a predictor of conversion to PDD Kaplan-Meier analyses were applied to the time to PDD

Kaplan-Meier analyses were applied to the time to PDD conversion among the overall patients with PD and within the three BMI groups (Fig. 3). The conversion rate to dementia in de novo patients with PD was 31.4% (n=22) during 6 years of follow-up, which is similar to the rate found in a previous 20-year longitudinal study (Fig. 3A).24 The BMI groups showed different conversion rates to dementia (by log-rank test, p=0.026) (Fig. 3A). After a post-hoc between-group comparison, the overweight group (by log-rank test, p=0.001) and the obese group (by log-rank test, p=0.002) had significantly lower rates of conversion to dementia than the under-/normal-weight group. When combining the overweight and obese groups, PD patients with BMI ≥23 kg/m2 had a lower conversion rate to dementia than did those with BMI <23 kg/m2 (by log-rank test, p=0.007) (Fig. 3B). After adjusting for the age at PD onset, sex, years of education, and UPDRS motor score, the HR of the combined overweight and obese groups was 0.36 (95% CI=0.12–0.82, p=0.046) compared to the under-/normal-weight group.

DISCUSSION

The present study evaluated whether the degree of cognitive decline is dependent on the BMI at the diagnosis in patients with de novo PD. Our major findings were as follows: 1) the baseline demographic and neuropsychological characteristics did not differ across BMI groups in patients with PD, except for the proportion of those who converted to dementia being lower in the overweight and obese groups than in the under-/normal-weight group; 2) the overweight and obese groups showed slower progression of cognitive decline in global cognitive function as well as language and memory domains, which are typically involved in AD rather than PD;25 and 3) being overweight or obese was associated with a significantly lower risk of conversion to PDD compared to being underweight or normal weight. These findings indicate that a higher BMI at the diagnosis may serve as a protective factor against cognitive decline in PD.
The relationship between BMI and cognition in PD has rarely been investigated. There are two reports that PD patients with decreased BMI or weight loss within the first 6 months to 2 years after the diagnosis showed a faster cognitive decline, based on the MMSE or its modified version being used to measure cognitive function.1011 Another study made serial measurements of the body weights of patients with PD over 6 years, and found that weight loss was associated with lower scores on the baseline symbol digit modalities test,12 which primarily measures information processing speed.26 The present study evaluated the performance in each cognitive domain as well as global cognition among subjects grouped into BMI tertiles. We found that being overweight or obese at the time of PD diagnosis was closely related to slower declines in language and memory functions as well as general cognitive function, and that the difference in cognitive decline became clear over the 6-year follow-up. This indicates that a higher-than-normal BMI may play a protective role in the progression of cognitive decline in PD.
We evaluated differences in the effects of BMI in each cognitive domain in the presence of PD. Conflicting results have been found for the relationship between BMI and each cognitive domain in normal populations. Obesity was associated with memory, verbal fluency, and visual motor speed,2728 but also better performance on attention, reasoning tasks, and visuospatial ability.2729 Such heterogeneous results may be attributable to differences between the subjects regarding age, sex, cognitive status, nutritional status, and risk factors. The cognitive domains that are related to body weight or nutritional state have therefore remained unclear. In this study we demonstrated that PD patients with higher-than-normal BMI showed significantly reduced declines in language and memory functions, which are generally acknowledged to be the domains of cognitive dysfunction in patients with AD.25 Additionally, overweight and obese patients with PD were less likely to progress to PDD.
Amyloid-beta seems to be related to cognitive decline or aggregated cortical alpha-synuclein burden in patients with PD.3031 Moreover, the patterns of brain atrophy in AD have been known to predict cognitive decline in PD.32 An autopsy study linked AD neuropathological changes with low and declining BMI.33 The presence and burden of biomarkers such as cerebrospinal fluid and PET imaging of cerebral amyloid and tau have been associated with lower BMI in individuals with normal cognition and MCI.34 In PD, the amyloid burden is more closely associated with cognitive function in PDD than it is in nondementia PD.3536 All of the BMI groups in our study exhibited comparable cognitive profiles as well as MTA grades at baseline, and showed different cognitive declines during the follow-up. Together our findings suggest that PD patients with a higher BMI at the diagnosis are less susceptible to AD or a neuropathological burden compared to those with a low-to-normal BMI, resulting in slower cognitive decline and a lower rate of conversion to dementia.
A particularly intriguing finding was the significant deterioration in visuospatial and frontal executive functions among the cognitive domains measured in the overweight and obese groups. This suggests that the cognitive decline in these domains occurred independently of the BMI at the diagnosis and reflects a characteristic cognitive decline in PD. Previous longitudinal studies identified that memory and frontal executive functions consistently deteriorated,37 while visuospatial function deteriorated significantly in only some studies.38 Considering our findings together, any prominent deterioration in memory function may differ depending on the effects of BMI or concomitant AD pathology. Since impairments in frontal executive and visuospatial functions are demonstrable in Lewy-body disease and distinguishable features from AD,39 we can also speculate that BMI does not affect the cognitive domains specific to PD, but rather the domains related to AD. Further research is needed into the association between BMI and pathological markers in PD, including amyloid or alpha-synuclein.
The exact pathomechanism underlying the effect of BMI on cognition in PD is still unknown. It is also unclear whether altered cognition directly leads to changes in BMI, or whether variations in BMI accelerate or decelerate the rate of cognitive decline. Obesity can exert detrimental effects on vascular pathology, neuroinflammation, oxidative stress, and neuroendocrine regulation, and can negatively impact the cognitive performance.40 A higher BMI has been reported to be associated with brain atrophy in widespread cortical regions.41 Meanwhile, protective effects of BMI on cognition can be explained by substances such as insulin-like growth factor-1 and leptin, whose levels are higher in patients with a higher BMI and are associated with good cognitive function.4243 Higher BMI has also been suggested to be a modulator of functional connectivity of the default mode network, thus conferring protective effects on cognition.44 This suggests that the BMI at a diagnosis of PD can affect the subsequent cognitive decline, rather than being a co-occurring phenomenon or a result of cognitive dysfunction.
This study was subject to several limitations. First, we analyzed a relatively small sample, which limits the generaliz-ability of the results. However, we applied strict inclusion and exclusion criteria, and closely followed the cognitive function of the included patients with PD for longer than 6 years. Second, underweight patients with PD were pooled with those of normal weight due to the smallness of the sample, and so we could not evaluate the potential influence of being underweight at baseline on cognitive decline. Third, we did not measure BMI when performing the follow-up NPs, and so we could not evaluate the relationship between BMI changes and cognitive deterioration. Regular longitudinal follow-ups of the BMI and cognition of PD patients are necessary to draw definitive conclusions about the association between BMI and cognition in PD. Fourth, a substantial number of patients was excluded during the longitudinal follow-up, which might have biased the results. Because several factors could affect cognition, applying strict exclusion criteria was important to investigating the independent relationship between BMI and cognitive decline. It can be argued that the 18 patients who were followed up for shorter than 6 year would have been free of dementia at the final follow-up. Actually, 14 patients did not participate in the first follow-up NP, and so we could not evaluate their changes in cognitive function. Only one of four patients who underwent the first 3-year follow-up NP had converted to dementia, and that patient was in the under-/normal-weight group, which was found to be the most-vulnerable group for dementia conversion. However, it is unlikely that these features would have affected the overall results of this study. Finally, we did not evaluate the socioeconomic status of the study participants, which could be associated with BMI45 and cognitive status.46 How socioeconomic status is defined has varied among previous studies, and socioeconomic status is a comprehensive concept that encompasses income, educational level, and occupation.47 In contrast, we only investigated the years of education at the time of cohort enrollment, which might be a reasonable and stable measure of socioeconomic status.48 The years of education did not differ among the groups in our study (p=0.441), and we included education as a covariate in all of the linear mixed models and survival analyses. However, future studies should evaluate the economic, educational, and occupational components of the socioeconomic status together.

Acknowledgements

This study was supported by a grant of the Korea Health Technology R&D Project through the Korea Health Industry Development Institute (KHIDI), funded by the Ministry of Health & Welfare, Republic of Korea (grant number: HI16C1118).

Notes

Author Contributions:

  • Conceptualization: Han Soo Yoo, Suk Yun Kang.

  • Data curation: Han Soo Yoo, Seok Jong Chung, Phil Hyu Lee, Suk Yun Kang.

  • Formal analysis: Han Soo Yoo, Suk Yun Kang.

  • Funding acquisition: Phil Hyu Lee.

  • Investigation: Han Soo Yoo, Phil Hyu Lee.

  • Methodology: Han Soo Yoo, Seok Jong Chung.

  • Project administration: Young H. Sohn, Suk Yun Kang.

  • Resources: Phil Hyu Lee, Young H. Sohn.

  • Supervision: Suk Yun Kang.

  • Validation: Phil Hyu Lee, Young H. Sohn, Suk Yun Kang.

  • Visualization: Han Soo Yoo, Suk Yun Kang.

  • Writing—original draft: Han Soo Yoo, Suk Yun Kang.

  • Writing—review & editing: Han Soo Yoo, Suk Yun Kang.

Conflicts of Interest: The authors have no potential conflicts of interest to disclose.

References

1. Van der Marck MA, Dicke HC, Uc EY, Kentin ZH, Borm GF, Bloem BR, et al. Body mass index in Parkinson's disease: a meta-analysis. Parkinsonism Relat Disord. 2012; 18:263–267. PMID: 22100523.
crossref
2. Aiello M, Eleopra R, Rumiati RI. Body weight and food intake in Parkinson's disease. A review of the association to non-motor symptoms. Appetite. 2015; 84:204–211. PMID: 25453591.
crossref
3. Morales-Briceño H, Cervantes-Arriaga A, Rodríguez-Violante M, Calleja-Castillo J, Corona T. Overweight is more prevalent in patients with Parkinson's disease. Arq Neuropsiquiatr. 2012; 70:843–846. PMID: 23175195.
crossref
4. Chen H, Zhang SM, Hernán MA, Willett WC, Ascherio A. Weight loss in Parkinson's disease. Ann Neurol. 2003; 53:676–679. PMID: 12731005.
crossref
5. Ragonese P, D'Amelio M, Callari G, Di Benedetto N, Palmeri B, Mazzola MA, et al. Body mass index does not change before Parkinson's disease onset. Eur J Neurol. 2008; 15:965–968. PMID: 18637822.
crossref
6. Vikdahl M, Carlsson M, Linder J, Forsgren L, Håglin L. Weight gain and increased central obesity in the early phase of Parkinson's disease. Clin Nutr. 2014; 33:1132–1139. PMID: 24423747.
crossref
7. Fitzpatrick AL, Kuller LH, Lopez OL, Diehr P, O'Meara ES, Longstreth WT Jr, et al. Midlife and late-life obesity and the risk of dementia: cardiovascular health study. Arch Neurol. 2009; 66:336–342. PMID: 19273752.
crossref
8. Cronk BB, Johnson DK, Burns JM. Alzheimer's Disease Neuroimaging Initiative. Body mass index and cognitive decline in mild cognitive impairment. Alzheimer Dis Assoc Disord. 2010; 24:126–130. PMID: 19571736.
crossref
9. Buchman AS, Wilson RS, Bienias JL, Shah RC, Evans DA, Bennett DA. Change in body mass index and risk of incident Alzheimer disease. Neurology. 2005; 65:892–897. PMID: 16186530.
crossref
10. Kim HJ, Oh ES, Lee JH, Moon JS, Oh JE, Shin JW, et al. Relationship between changes of body mass index (BMI) and cognitive decline in Parkinson's disease (PD). Arch Gerontol Geriatr. 2012; 55:70–72. PMID: 21763014.
crossref
11. Lorefält B, Ganowiak W, Pålhagen S, Toss G, Unosson M, Granérus AK. Factors of importance for weight loss in elderly patients with Parkinson's disease. Acta Neurol Scand. 2004; 110:180–187. PMID: 15285776.
crossref
12. Wills AM, Li R, Pérez A, Ren X, Boyd J. NINDS NET-PD Investigators. Predictors of weight loss in early treated Parkinson's disease from the NET-PD LS-1 cohort. J Neurol. 2017; 264:1746–1753. PMID: 28712000.
crossref
13. Fazekas F, Chawluk JB, Alavi A, Hurtig HI, Zimmerman RA. MR signal abnormalities at 1.5 T in Alzheimer's dementia and normal aging. AJR Am J Roentgenol. 1987; 149:351–356. PMID: 3496763.
crossref
14. Gibb WR, Lees AJ. The relevance of the Lewy body to the pathogenesis of idiopathic Parkinson's disease. J Neurol Neurosurg Psychiatry. 1988; 51:745–752. PMID: 2841426.
crossref
15. WHO Expert Consultation. Appropriate body-mass index for Asian populations and its implications for policy and intervention strategies. Lancet. 2004; 363:157–163. PMID: 14726171.
16. Stebbins GT, Goetz CG, Burn DJ, Jankovic J, Khoo TK, Tilley BC. How to identify tremor dominant and postural instability/gait difficulty groups with the movement disorder society unified Parkinson's disease rating scale: comparison with the unified Parkinson's disease rating scale. Mov Disord. 2013; 28:668–670. PMID: 23408503.
crossref
17. Beck AT, Ward CH, Mendelson M, Mock J, Erbaugh J. An inventory for measuring depression. Arch Gen Psychiatry. 1961; 4:561–571. PMID: 13688369.
crossref
18. Doty RL, Marcus A, Lee WW. Development of the 12-item Cross-Cultural Smell Identification Test (CC-SIT). Laryngoscope. 1996; 106:353–356. PMID: 8614203.
19. Tomlinson CL, Stowe R, Patel S, Rick C, Gray R, Clarke CE. Systematic review of levodopa dose equivalency reporting in Parkinson's disease. Mov Disord. 2010; 25:2649–2653. PMID: 21069833.
crossref
20. Scheltens P, Leys D, Barkhof F, Huglo D, Weinstein HC, Vermersch P, et al. Atrophy of medial temporal lobes on MRI in “probable” Alzheimer's disease and normal ageing: diagnostic value and neuropsychological correlates. J Neurol Neurosurg Psychiatry. 1992; 55:967–972. PMID: 1431963.
crossref
21. Ahn HJ, Chin J, Park A, Lee BH, Suh MK, Seo SW, et al. Seoul Neuropsychological Screening Battery-dementia version (SNSB-D): a useful tool for assessing and monitoring cognitive impairments in dementia patients. J Korean Med Sci. 2010; 25:1071–1076. PMID: 20592901.
crossref
22. Litvan I, Goldman JG, Tröster AI, Schmand BA, Weintraub D, Petersen RC, et al. Diagnostic criteria for mild cognitive impairment in Parkinson's disease: Movement Disorder Society Task Force guidelines. Mov Disord. 2012; 27:349–356. PMID: 22275317.
crossref
23. Dubois B, Burn D, Goetz C, Aarsland D, Brown RG, Broe GA, et al. Diagnostic procedures for Parkinson's disease dementia: recommendations from the movement disorder society task force. Mov Disord. 2007; 22:2314–2324. PMID: 18098298.
crossref
24. Hely MA, Reid WG, Adena MA, Halliday GM, Morris JG. The Sydney multicenter study of Parkinson's disease: the inevitability of dementia at 20 years. Mov Disord. 2008; 23:837–844. PMID: 18307261.
crossref
25. Weintraub S, Wicklund AH, Salmon DP. The neuropsychological profile of Alzheimer disease. Cold Spring Harb Perspect Med. 2012; 2:a006171. PMID: 22474609.
crossref
26. Langdon DW, Amato MP, Boringa J, Brochet B, Foley F, Fredrikson S, et al. Recommendations for a Brief International Cognitive Assessment for Multiple Sclerosis (BICAMS). Mult Scler. 2012; 18:891–898. PMID: 22190573.
crossref
27. Gunstad J, Lhotsky A, Wendell CR, Ferrucci L, Zonderman AB. Longitudinal examination of obesity and cognitive function: results from the Baltimore longitudinal study of aging. Neuroepidemiology. 2010; 34:222–229. PMID: 20299802.
crossref
28. Fedor A, Gunstad J. Higher BMI is associated with reduced cognitive performance in division I athletes. Obes Facts. 2013; 6:185–192. PMID: 23594505.
crossref
29. Kuo HK, Jones RN, Milberg WP, Tennstedt S, Talbot L, Morris JN, et al. Cognitive function in normal-weight, overweight, and obese older adults: an analysis of the Advanced Cognitive Training for Independent and Vital Elderly cohort. J Am Geriatr Soc. 2006; 54:97–103. PMID: 16420204.
crossref
30. Gomperts SN, Locascio JJ, Rentz D, Santarlasci A, Marquie M, Johnson KA, et al. Amyloid is linked to cognitive decline in patients with Parkinson disease without dementia. Neurology. 2013; 80:85–91. PMID: 23243071.
crossref
31. Lashley T, Holton JL, Gray E, Kirkham K, O'Sullivan SS, Hilbig A, et al. Cortical alpha-synuclein load is associated with amyloid-beta plaque burden in a subset of Parkinson's disease patients. Acta Neuropathol. 2008; 115:417–425. PMID: 18185940.
32. Weintraub D, Dietz N, Duda JE, Wolk DA, Doshi J, Xie SX, et al. Alzheimer's disease pattern of brain atrophy predicts cognitive decline in Parkinson's disease. Brain. 2012; 135:170–180. PMID: 22108576.
crossref
33. Buchman AS, Schneider JA, Wilson RS, Bienias JL, Bennett DA. Body mass index in older persons is associated with Alzheimer disease pathology. Neurology. 2006; 67:1949–1954. PMID: 17159099.
crossref
34. Vidoni ED, Townley RA, Honea RA, Burns JM. Alzheimer's Disease Neuroimaging Initiative. Alzheimer disease biomarkers are associated with body mass index. Neurology. 2011; 77:1913–1920. PMID: 22105948.
crossref
35. Mashima K, Ito D, Kameyama M, Osada T, Tabuchi H, Nihei Y, et al. Extremely low prevalence of amyloid positron emission tomography positivity in Parkinson's disease without dementia. Eur Neurol. 2017; 77:231–237. PMID: 28285306.
crossref
36. Winer JR, Maass A, Pressman P, Stiver J, Schonhaut DR, Baker SL, et al. Associations between tau, β-amyloid, and cognition in Parkinson disease. JAMA Neurol. 2018; 75:227–235. PMID: 29228071.
crossref
37. Pirogovsky-Turk E, Moore RC, Filoteo JV, Litvan I, Song DD, Lessig SL, et al. Neuropsychiatric predictors of cognitive decline in Parkinson disease: a longitudinal study. Am J Geriatr Psychiatry. 2017; 25:279–289. PMID: 27838315.
crossref
38. Stepkina DA, Zakharov VV, Yakhno NN. Cognitive impairments in progression of Parkinson's disease. Neurosci Behav Physiol. 2010; 40:61–67. PMID: 20012495.
crossref
39. Jellinger KA, Korczyn AD. Are dementia with Lewy bodies and Parkinson's disease dementia the same disease? BMC Med. 2018; 16:34. PMID: 29510692.
crossref
40. Yates KF, Sweat V, Yau PL, Turchiano MM, Convit A. Impact of metabolic syndrome on cognition and brain: a selected review of the literature. Arterioscler Thromb Vasc Biol. 2012; 32:2060–2067. PMID: 22895667.
41. Shaw ME, Sachdev PS, Abhayaratna W, Anstey KJ, Cherbuin N. Body mass index is associated with cortical thinning with different patterns in mid- and late-life. Int J Obes (Lond). 2018; 42:455–461. PMID: 28993708.
crossref
42. Calvo D, Gunstad J, Miller LA, Glickman E, Spitznagel MB. Higher serum insulin-like growth factor-1 is associated with better cognitive performance in persons with mild cognitive impairment. Psychogeriatrics. 2013; 13:170–174. PMID: 25913765.
crossref
43. Atti AR, Palmer K, Volpato S, Winblad B, De Ronchi D, Fratiglioni L. Late-life body mass index and dementia incidence: nine-year follow-up data from the Kungsholmen Project. J Am Geriatr Soc. 2008; 56:111–116. PMID: 18028342.
crossref
44. Hsu CL, Voss MW, Best JR, Handy TC, Madden K, Bolandzadeh N, et al. Elevated body mass index and maintenance of cognitive function in late life: exploring underlying neural mechanisms. Front Aging Neurosci. 2015; 7:155. PMID: 26347646.
crossref
45. Kim J, Sharma SV, Park SK. Association between socioeconomic status and obesity in adults: evidence from the 2001 to 2009 Korea national health and nutrition examination survey. J Prev Med Public Health. 2014; 47:94–103. PMID: 24744826.
crossref
46. Duncan GJ, Magnuson K. Socioeconomic status and cognitive functioning: moving from correlation to causation. Wiley Interdiscip Rev Cogn Sci. 2012; 3:377–386. PMID: 26301469.
crossref
47. Galobardes B, Shaw M, Lawlor DA, Lynch JW, Davey Smith G. Indicators of socioeconomic position (part 1). J Epidemiol Community Health. 2006; 60:7–12.
crossref
48. Li X, Sundquist J, Sundquist K. Socioeconomic and occupational groups and Parkinson’s disease: a nationwide study based on hospitalizations in Sweden. Int Arch Occup Environ Health. 2009; 82:235–241. PMID: 18427829.
crossref

Supplementary Materials

The online-only Data Supplement is available with this article at https://doi.org/10.3988/jcn.2019.15.4.517.

SUPPLEMENTARY MATERIAL

MRI acquisition and parameters
jcn-15-517-s001.pdf
Fig. 1

Flowchart of the study patients with PD. PD: Parkinson's disease.

jcn-15-517-g001
Fig. 2

Repeated-measures graphs for comparison of cognitive function among patients with PD grouped according to body mass index. *Significant group×time interaction. Significant difference between under-/normal-weight and overweight groups. Significant difference between under-/normal-weight and obese groups. Colored dot lines indicate a significant difference between the neuropsychological tests in the respective groups. CDR-SOB: Clinical Dementia Rating Sum of Boxes, MMSE: Mini Mental State Examination, PD: Parkinson's disease.

jcn-15-517-g002
Fig. 3

Kaplan-Meier curves showing the cumulative probability of not developing dementia according to the duration of PD. A: The probability of being free of dementia among all patients and in the under-/normal-weight group (BMI <23 kg/m2), overweight group (BMI ≥23 kg/m2 and <25 kg/m2), and obese group (BMI ≥25 kg/m2). B: Comparison of the probability of being free of dementia between the under-/normal-weight and overweight/obese groups. BMI: body mass index, PD: Parkinson's disease.

jcn-15-517-g003
Table 1

Baseline clinical and imaging characteristics of the patients with PD according to BMI

jcn-15-517-i001

Data are mean±SD or n (%) values. The Kruskal-Wallis and χ2 tests were used for comparing continuous and categorical variables, respectively.

BDI: Beck Depression Inventory, BMI: body mass index, CCSIT: Cross-Cultural Smell Identification Test, LED: levodopa-equivalent dose, MTA: medial temporal atrophy, NP: neuropsychological test, PD: Parkinson's disease, PIGD: postural instability/gait difficulty, TD: tremor dominant, UPDRS: Unified Parkinson's Disease Rating Scale, WMHs: white-matter hyperintensities.

Table 2

Neuropsychological profiles of the PD patients according to BMI

jcn-15-517-i002

Data are mean±SD or n (%) values. Comparisons of demographic characteristics and each cognitive composite score (z-score) were performed using the Kruskal-Wallis and χ2 tests for continuous and categorical variables, respectively. The duration from PD onset to PDD was calculated only in the patients who have converted to dementia in each BMI group.

Significant differences *Between the under-/normal-weight and overweight groups and Between the under-/normal-weight and obese groups.

BMI: body mass index, CDR-SOB: Clinical Dementia Rating Sum of Boxes, IC: intact cognition, MCI: mild cognitive impairment, MMSE: Mini Mental State Examination, NP: neuropsychological test, PD: Parkinson's disease, PDD: Parkinson's disease dementia.

Table 3

Comparison of longitudinal changes in cognition across time in patients with PD according to BMI

jcn-15-517-i003

Data are mean [standard error] values from a linear mixed model after adjusting for age, sex, years of education, and UPDRS motor score. Bonferroni corrections were applied for the post-hoc p values.

BMI: body mass index, CDR-SOB: Clinical Dementia Rating Sum of Boxes, MMSE: Mini Mental State Examination, PD: Parkinson's disease, UPDRS: Unified Parkinson's Disease Rating Scale.

TOOLS
Similar articles