

 PDF
PDF ePub
ePub Citation
 Print
Print


INTRODUCTION
METHODS
Participants
Procedure and questionnaires
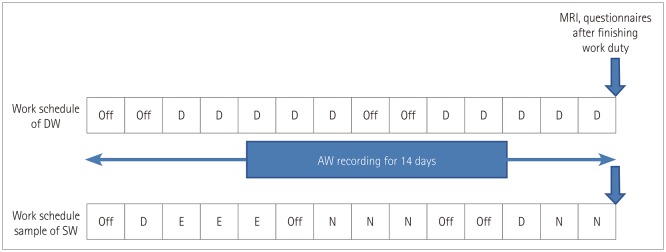
Fig. 1
Diagrammatic representation of work schedule and timeline. The work schedule of DW was constant while that of SW involved rotational three shifts. Participants wore an actigraph for 2 weeks and underwent MRI scanning immediately after working. In the case of SW, MRI scanning was performed on the day after two consecutive night shifts. AW: awakening, D: day work, DW: day workers, E: evening work, N: night work, SW: shift workers.
![]()
Actigraphy
Joggle test
Perfusion MRI
DSC MRI
Quantification of DSC MRI
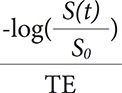 , where Ct(t) is the concentration of contrast agent, S(t) is the signal intensity at time t, and S0 is the baseline signal intensity (Fig. 2A and B). For quantification of DSC-MRI data, the concentration of contrast agent in tissue [Ct(t] can be written as Ct(t=CBF∫t0Cp
 (t)R(t−τ)dτ=Cp(t)⊗[CBF×R(t)], where Cp(t) is the concentration of contrast agent in a large vessel. In model-independent techniques, CBF×R(t) can be estimated using a deconvolution method. CBF×R(t) was computed using singular value decomposition (SVD) with block circulant matrices.19 SVD was implemented using the svd function in MATLAB (The Mathworks, Natick, MA, USA). The threshold for the diagonal matrix generated using SVD was set to 0.15 of the maximum eigenvalue in order to reduce oscillations of the derived tissue residue function R(t).20 The arterial input function [Cp(t)] was manually measured by visually inspecting the concentration–time curves near the M1 segment of the middle cerebral artery (Fig. 2C). rCBF was computed as the maximum of the deconvolved tissue impulse response (CBF×R(t) at t=0) using the property R(0)=1, and the regional CBV was calculated as the ratio of the area under the concentration of contrast agent in a given voxel to the area under the curve of the contrast-agent concentration versus time of the arterial input function (Fig. 2D). MTT corresponded to the ratio of CBV to CBF. To obtain the absolute values of CBF and CBV, their regional values were scaled by assuming a normal white-matter CBF of 22 mL/100 g/min and a CBV of 2 mL/100 g.19 For spatial registration, the DSC-MRI image before injecting contrast agent was registered to the T1-weighted image using the affine transformation (from DSC space to T1 space), and then the T1-weighted image was registered to the Montreal Neurological Institute (MNI) space (the MNI152 template in AFNI software) using the affine transformation (from T1 space to MNI space) for each subject. The affine transformation from DSC space to MNI space was calculated using both the affine transformation matrices from DSC space to T1 space and from T1 space to MNI space. Using the obtained affine transformation from DSC space to MNI space, the computed parametric maps were registered to MNI space for group analysis. We performed a voxelby-voxel comparison of perfusion maps between two groups (3dttest++ function in AFNI), and the statistically significant regions were selected for the further analysis of the correlations of clinical scores.
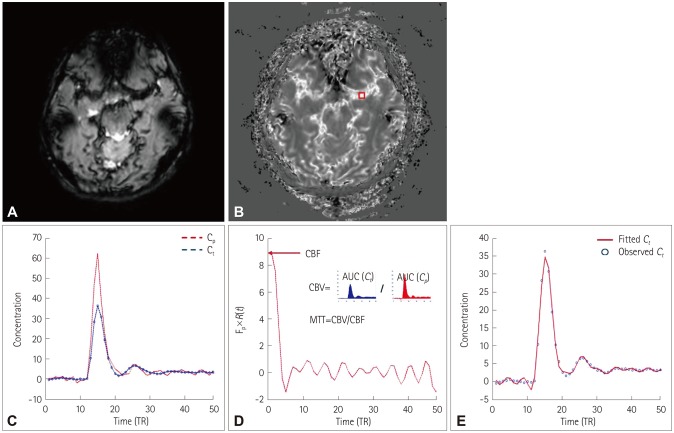
Fig. 2
Flowchart for quantifying the DSC-MRI data. A: DSC-MRI data. B: Concentration of contrast agent. DSC-MRI data were converted into the concentration of contrast agent. C: Concentration–time curves in a large vessel (red box in B) and tissue. The arterial input function was manually determined in large voxels. D: The tissue impulse response function [R(t)] multiplied by the CBF was computed using deconvolution. The regional CBF was computed as the maximum of the deconvolved tissue impulse response, the regional CBV was computed as the ratio of the AUC in a tissue to the AUC of the arterial input function, and the MTT was computed as the ratio of CBV to CBF. E: Observed Ct(t) (blue dots) and fitted curve using the estimated tissue impulse response function and CBF (red line). AUC: area under the curve, CBF: cerebral blood flow, CBV: cerebral blood volume, Cp: concentration of contrast agent in a large vessel, Ct: concentration of contrast agent in tissue, DSC: dynamic susceptibility contrast, MTT: mean transit time, TR: repetition time.
![]()
Statistical analysis
RESULTS
Demographic and clinical characteristics
Table 1
Demographic and clinical characteristics
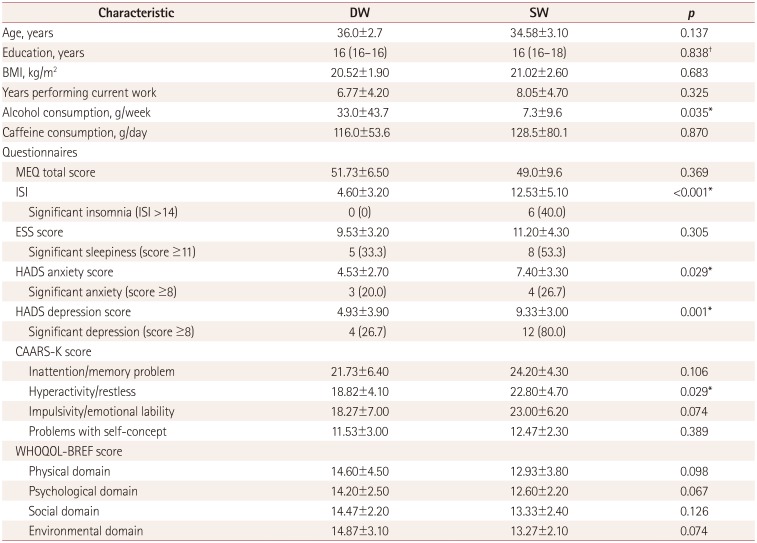
Data are mean±standard-deviation, median (interquartile range), or n (%) values.
*p<0.05, t-test, †Mann-Whitney U test.
BMI: body mass index, CAARS-K: Korean version of Conners' Adult Attention Deficit Hyperactivity Disorder Rating Scales, DW: day workers, ESS: Epworth Sleepiness Scale, HADS: Hospital Anxiety and Depression Scale, ISI: Insomnia Severity Index, MEQ: Horne-Östberg Morning-Eveningness Questionnaire, SW: shift workers, WHOQOL-BREF: World Health Organization Quality of Life Scale Abbreviated Version.
![]()
Actigraph-derived sleep parameters

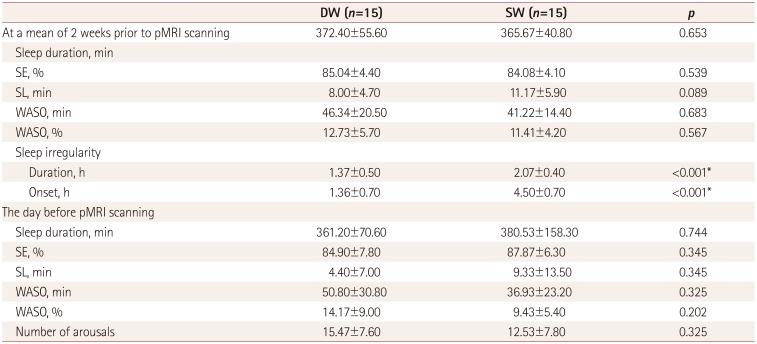
Table 3
Sleep irregularity and its relationships with clinical factors
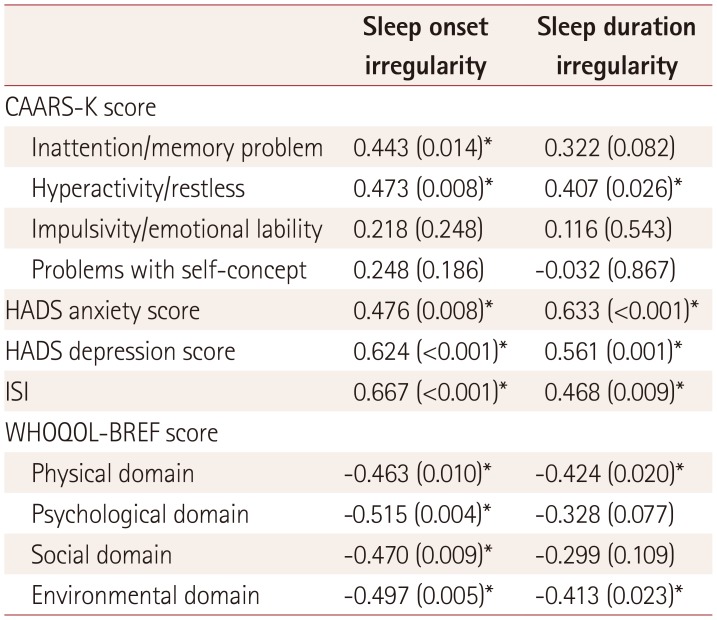
Data are r (p) values.
*p<0.05.
CAARS-K: Korean version of Conners' Adult Attention Deficit Hyperactivity Disorder Rating Scales, HADS: Hospital Anxiety and Depression Scale, ISI: Insomnia Severity Index, r: spearman partial correlation coefficient, WHOQOL-BREF: World Health Organization Quality of Life Scale Abbreviated Version.
![]()
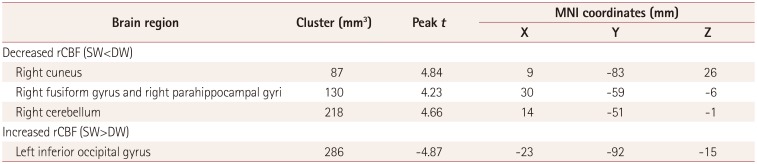
pMRI findings
Fig. 4
Comparison of regional perfusion MRI data between SW and DW. Left inferior occipital gyrus (A), right cerebellum (B), right fusiform/parahippocampal gyri (C), and right cuneus (D). Red color indicates areas with lower CBF in SW compared to DW, and blue color indicates areas with higher CBF. Statistical images are displayed with a cluster probability threshold of p<0.05, corrected for multiple comparisons. CBF: cerebral blood flow, DW: day workers, SW: shift workers.

![]()
 XML Download