

 PDF
PDF Citation
 Print
Print


INTRODUCTION
Prophylaxis for hepatitis B virus (HBV) recurrence is essential after liver transplantation (LT) in patients who had been infected with HBV. Many institution-based protocols for post-LT HBV prophylaxis include treatment with hepatitis B immunoglobulin (HBIG) and/or antiviral nucleos(t)ide analog (NA) administration.1234
Periodic administration of HBIG is a long-lasting prophylaxis regimen. Although clinically effective, it has several demerits, including high financial cost, cumbersome route of administration, occasional occurrence of HBIG-associated adverse events, and development of resistant viral mutations.1256 HBIG monotherapy is primarily based on lifelong maintenance of a high hepatitis B surface antibody (anti-HBs) trough level, which is financially costly and necessitates short intervals of HBIG administration.7 To enhance the prophylactic efficacy and to reduce the financial cost, combination therapy with HBIG and NA has been preferred, in which the target trough level of anti-HBs can be significantly lowered. Recently, HBIG-free or HBIG-sparing prophylaxis regimens are also reported to be more cost-effective than conventional combination therapy.89
To achieve high cost-effectiveness during HBIG-NA combination therapy (HNCT), the intervals and doses of periodic HBIG administration should be adjusted individually after pharmacokinetic (PK) measurement of the half-life of exogenously administered HBIG. However, in practice, these doses have been crudely determined by the institutional protocols or physicians' personal experience because it is not practical to measure the PK half-life of HBIG in every LT recipient. As a result, HBIG has often been administered more frequently and in higher amounts than required, in a considerably large number of LT recipients.
It is hardly possible to estimate the in vivo half-life of exogenous HBIG without meticulous PK studies requiring multiple blood samplings. To replace the actually measured half-life of exogenous HBIG, we developed a simplified simulative method to estimate the half-life, which we have termed the simulative half-life (SHL). This method requires only clinically available parameters, including gender, body weight, hematocrit, interval period of HBIG administration, and trough anti-HBs titer. Thus, there is no need to perform any other PK measurement in the usual practice at the outpatient clinic.
This study intended to establish an individualized HBV prophylaxis protocol, through optimization of the intervals of HBIG administration, with the application of SHL estimation.
METHODS
Study scheme
This study consisted of five parts. Part 1 developed the SHL estimation method, which included a small-volume (n = 20; study cohort 1) PK study, to compare the actual PK measurement of the HBIG half-life and the SHL estimation. Part 2 assessed the long-term inter- and intra-individual variability of the SHL, retrospectively, using a single-center cohort (n = 100; study cohort 2). Part 3 developed a simulation model to apply SHL using the single-center cohort (study cohort 2) mentioned above. Part 4 validated the results of the simulation model, using another single-center cohort (n = 114; study cohort 3), and Part 5 was a cross-sectional study, to reveal the actual status of HBIG infusion intervals in a high-volume single-center cohort (n = 660; study cohort 4).
Patient selection
Since all study patients should be indicated for HBV prophylaxis using HBIG administration, the selection criteria for the study cohorts 1 to 4 included patient age at LT ≥ 18 years; positive for hepatitis B surface antigen (HBsAg) before LT; absence of hepatitis C virus co-infection; regular administration of HBIG with or without NA; no posttransplant development of hepatocellular carcinoma (HCC) recurrence or de novo malignancy; and regular administration of HBIG and anti-HBs measurement at every visit to the outpatient clinic of our institution. We intentionally excluded the patients showing HBV recurrence from this study.
For Part 1 of the study, we randomly selected 20 patients who passed 2–10 years after LT (study cohort 1) because we experienced that the intervals of HBIG administration during long-term follow-up was usually determined at 1–2 years after LT. These patients underwent LT between January 2008 and December 2015, at our institution, and were temporarily re-admitted, due to various causes other than HCC recurrence and liver function abnormality. After informed consent was obtained, the peak serum anti-HBs titer was measured 6–12 hours after intravenous infusion of 10,000 IU HBIG.
For Parts 2 and 3 of the investigation, we randomly selected 100 patients who passed 7–8 years after LT (study cohort 2), those who underwent LT between January 2010 and December 2011, at our institution. This study cohort 2 was used to assess the long-term intra- and inter-individual variability in SHL of exogenous HBIG, and to develop a clinical simulation model using SHL.
For Part 4 of this study, we have recruited > 150 patients who passed 5 years of LT without any eventful episode. A prospective study was undertaken to prolong the intervals of HBIG infusion to 12 weeks (94 days), with a target trough anti-HBs titer of 200 IU/L since January 2015. Of these subjects, we selected 114 patients, who have observed the study protocol for ≥ 2 years (study cohort 3) until June 2018, as an interim analysis.
For Part 5 of this investigation, we selected 660 patients who have passed 5–14 years after LT and been followed-up regularly, only at our institution (study cohort 4). We excluded the patients who had any considerable co-morbidity, except for diabetes mellitus, hypertension, and renal dysfunction. Using this study cohort 4, we conducted a cross-sectional survey to reveal the current status of HBIG infusion intervals at our institution, during 3 months between June 2018 and August 2018. We excluded the patients who were included in the study cohorts 1–3, so no patient was overlapped in all four study cohorts.
Institutional protocol for post-LT HBV prophylaxis
At our institution, 10,000 IU HBIG was infused during the anhepatic phase, daily during the first week, once weekly for the next 1 month, and once monthly after that. After the first 1 year of LT, the interval period between regular HBIG infusions was gradually prolonged toward 8–12 weeks on a patient-by-patient basis, to maintain a trough serum anti-HBs titer ≥ 500 IU/L. There are two highly purified HBIG products available in Korea (Hepabig, GC Pharma, Seoul, Korea; and Hepabulin, SK Plasma Co., Ltd., Seoul, Korea), which safely enable rapid intravenous infusion of 10,000 IU within 30–60 minutes after dilution. A high-genetic barrier NA (entecavir or tenofovir) has often been added as an HNCT, especially, in LT recipients showing rapid HBIG consumption or risk of HCC recurrence.1011
Simulative PK study to assess half-life of exogenous HBIG
The purpose of Part 1 of this study was to develop PK formulae of half-life, using only clinically available parameters, through simulative PK analyses.
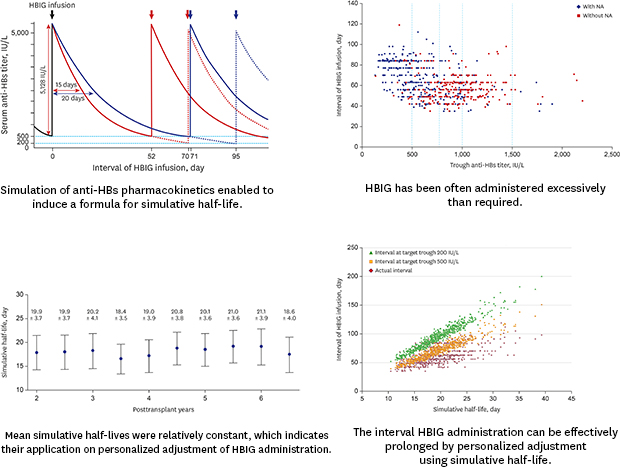
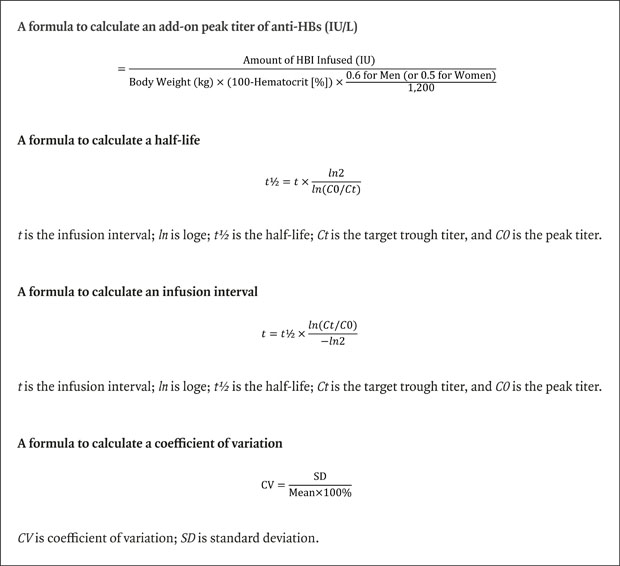
The peak anti-HBs titer shortly after HBIG infusion is not measured in routine clinical practice, but it can be roughly estimated, as follows, because HBIG is primarily distributed within the blood and only a small proportion is dispersed into the interstitial fluid: “amount of HBIG infused (IU) is divided by the blood volume (L).” Total body water = 60% (men) or 50% (women) of body weight; extracellular fluid = total body water/3; interstitial fluid = total body water × 0.25; and intravascular blood = extracellular fluid − interstitial fluid. Since the whole blood consisted of plasma and blood cells, we extracted the volume proportion of red blood cells (hematocrit), and plasma volume was re-calculated as follows: “plasma volume = blood volume × (100 − hematocrit [%])/100”. Therefore, the final formula was modified as follows: “add-on peak titer of anti-HBs (IU/L) = amount of HBIG infused (IU)/(body weight [kg] × (100 − hematocrit [%]) × 0.6 for men [or 0.5 for women]/1,200).” In this way, the peak anti-HBs titer shortly after HBIG infusion is the sum of the pre-existing trough titer and add-on peak titer from HBIG infusion (Fig. 1A).
 | Fig. 1Simulation of antibody to anti-HBs pharmacokinetics and calculation of half-life and application of SHL. (A) The peak anti-HBs titer shortly after HBIG infusion (thick arrows) is the sum of the pre-exist4ing trough titer and add-on peak titer from HBIG infusion. SHL indicates the time to reach 50% of the peak titer. (B) The initial peak titer is the sum of the target trough titer and add-on titer after administration of 10,000 IU HBIG. Once SHL is determined, the serum concentration of anti-HBs decreases along the decay curve. If the SHL is 15 days (red lines) and the target trough titer is 500 IU/L, the infusion interval becomes 52 days. If the target trough titer is 200 IU/L, the interval is prolonged to 70 days. If the SHL is 20 days (blue lines), the infusion interval becomes 71 days and 95 days with the target trough titers of 500 IU/L and 200 IU, respectively.anti-HBs = hepatitis B surface antibody, SHL = simulative half-life, HBIG = hepatitis B immunoglobulin.
|
Measurement of the half-life of exogenous HBIG was simulated by plotting the formula-based peak titer at day 0 and trough titer after certain infusion intervals, and these points were traced by an exponential decay curve.12 A half-life was determined as the period showing 50% of peak titer according to the exponential decay curve, using the following formula: “t½ = t × ln2/ln(C0/Ct)”, where t is the infusion interval; ln is loge; t½ is the half-life; Ct is the target trough titer, and C0 is the peak titer. The HBIG infusion interval for a target trough titer can then be determined since the peak titer and half-life are already derived. This calculation can be solved by using general calculation software, such as Microsoft Excel or the online half-life calculator (http://www.calculator.net/half-life-calculator.html).
Considering the usual institutional protocols for HBIG infusion, the resulting SHL estimation appears to apply to the recipients passing the first 1 year after LT. The mean or lowest value from at least three consecutive SHL may be helpful to compensate the intra-individual variability.
Application of SHL to determine the administration interval of HBIG
The formula to determine the interval of HBIG administration was as follows: “t = t½ × ln(Ct/C0)/−ln2”, where t is the infusion interval; ln is loge; t½ is the half-life; Ct is the target trough titer, and C0 is the peak titer. This formula is directly converted from the abovementioned formula for half-life estimation.
We used both 500 and 200 IU/L as the target trough titers in this study (Fig. 1B). The peak titer was the sum of the target trough titer and add-on titer after administration of 10,000 IU HBIG. We used the actual trough titer at a certain time point, only for estimation of SHL. Once SHL was determined, the actual trough titer was no longer valid for determination of the interval of HBIG administration because it would be automatically moved toward the target trough titer after passing a few sessions of HBIG administration.
The parameters required to determine the interval of HBIG administration for a certain target trough titer are body weight, gender, hematocrit, trough anti-HBs titer, and the interval between two consecutive sessions of HBIG administration. Hence, any additional blood sampling for specific PK study is not necessary.
Statistical analysis
To quantify the variation in SHL of HBIG, the mean ± standard deviation (SD) of consecutive measurements were used. Considering that the patients usually visited the outpatient clinic every 2–3 months for HBIG infusion during the study period, the number of sample sessions per patient was ≥ 10 in Part 2 of the study. Intra- and inter-individual variabilities were reported as mean ± SD and coefficient of variation (CV); wherein the CV is the ratio of the SD in the trough titer to the mean trough titer (expressed as a percentage), as follows: “CV = SD/mean × 100%”.13
To avoid bias from the wide fluctuation of trough anti-HBs titer (intra-individual variability), the lowest trough anti-HBs titer among the latest three consecutive measurements was used for Parts 4 and 5 of the investigation. Two logarithms were used in this study. Base-10 logs (log10) were expressed as log, and natural logs (loge) were expressed as ln. Formulae used in this study are collected at the Appendix 1.
All numerical data are reported as means ± SD or as medians with ranges. Continuous variables were compared using the Student's t-test or analysis of variance. P < 0.05 was considered statistically significant. Statistical analyses were performed using SPSS (version 22; IBM, New York, NY, USA).
RESULTS
PK study to assess the accuracy of simulative anti-HBs peak titer and SHL (Part 1 study)
The profiles of 20 patients (study cohort 1) are summarized in Table 1, and their anti-HBs PK data are provided in Table 2. The actual trough and peak titers of anti-HBs were 617.5 ± 354.1 and 6,262.3 ± 1,224.4 IU/L, respectively, with a mean infusion interval of 69.3 ± 15.6 days. Infusion of 10,000 IU HBIG increased the add-on anti-HBs titer by 5,644.8 ± 1,191.6 IU/L. The mean actual half-life of HBIG was estimated to be 19.6 ± 3.1 days.
Table 1
Collective profiles of patients who were included in the study cohort 1 to 4
Data are presented as mean ± standard deviation or number (%).
LT = liver transplantation, LC = liver cirrhosis, ACLF = acute-on-chronic liver failure, HBsAg = hepatitis B surface antigen, HBeAg = hepatitis B envelope antigen, MELD = model for end-stage liver disease, HCC = hepatocellular carcinoma, NA = nucleos(t)ide analogue, HBV = hepatitis B virus, LDLT = living donor liver transplantation, DDLT = deceased donor liver transplantation, HBIG = hepatitis B immunoglobulin.
![]()
Table 2
Profiles of 20 patients who underwent pharmacokinetic study on HBIG infusion and consumption (study cohort 1)
HBIG = hepatitis B immunoglobulin, LT = liver transplantation, anti-HBs = hepatitis B surface antibody, SD = standard deviation.
![]()
With application of the simulative estimation using the plasma volume, the add-on rise of anti-HBs titer from 10,000 IU HBIG was 5,252.5 ± 873.7 IU/L, which was only 4.4% lower than that from the actual measurement. When adding the trough titer, the peak anti-HBs titer was estimated to be 5,870.0 ± 1,077.4 IU/L. The mean SHL was 20.0 ± 3.7 days, which was only 2.2% longer than that from the actual measurement. Thus, this simulative estimation formula using plasma volume was applied in the subsequent studies.
Assessment of long-term intra-and inter-individual variability of SHL (Part 2 study)
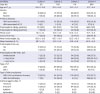
The profiles of 100 randomly selected recipients who passed 7–8 years after LT (study cohort 2) are reviewed in Table 1. All patients underwent regularly administered HBIG infusion and measurement of trough anti-HBs titer, every time. The serial changes in SHL over 5 years, from the posttransplant 2nd to 6th year, are depicted in Fig. 2A.
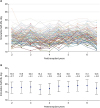 | Fig. 2Serial changes of simulative half-life of exogenously administered HBIG in the 100 patients of the study cohort 2. (A) Individual data of the serial changes of simulative half-life are shown. (B) Collective data of the serial changes of simulative half-life are shown.HBIG = hepatitis B immunoglobulin.
|
The SHL in 10 consecutive measurement sessions of every patient ranged from 18.4 ± 3.5 to 21.1 ± 3.9 days, with a mean of 14.0% ± 3.4% and median of 13.5%, as CV of intra-individual variability. The overall mean SHL of each patient ranged from 18.4 ± 3.5 to 21.1 ± 3.9 days, with a mean of 19.0% ± 1.3% and median of 18.5%, as CV of inter-individual variability in 100 patients (Fig. 2B). The mean overall SHL of 19.9 ± 2.8 days in Part 2 was comparable with that of 20.0 ± 3.7 days in Part 1 (P = 0.27).
We assessed the influence of pretransplant HBV DNA load on SHL. The mean SHL was 20.1 ± 4.4 days, in 25 patients showing HBV DNA of undetectable level (< 15 IU/mL or 84 copies/mL); 20.4 ± 2.6 days, in 40 patients showing HBV DNA ≤ 4 log IU/mL; and 19.7 ± 2.9 days, in 35 patients showing HBV DNA > 4 log IU/mL (P = 0.23), respectively.
We also assessed the influence of concurrent posttransplant NA administration on SHL. The mean SHL was 19.6 ± 2.7 days in 64 patients receiving HNCT, and 20.7 ± 3.9 days in 36 patients receiving HBIG monotherapy (P = 0.14), respectively.
Development of clinical simulation model using SHL (Part 3)
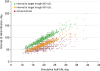
The trough anti-HBs titer and intervals of HBIG infusion of overall 1,000 measurement sessions in 100 patients (study cohort 3) are depicted in Fig. 3. Only 111 measurement sessions (11.1%) showed a trough anti-HBs trough titer < 500 IU/L, and 439 measurement sessions (43.9%) showed an anti-HBs trough titer ≤ 1,000 IU/L. Considering that the institutional target level of trough anti-HBs titer was set at 500 IU/L, and some reserve in anti-HBs titer (additional 250 IU/L) is permitted, these results suggest that a majority of our patients have received HBIG infusion more frequently than required.
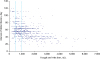 | Fig. 3Scatter plot showing the association between the trough anti-HBs titer and HBIG infusion intervals in the 100 patients of the study cohort 2.anti-HBs = hepatitis B surface antibody, HBIG = hepatitis B immunoglobulin.
|
For clinical application, we developed a clinical simulation model, to effectively adjust the interval of HBIG infusion. For example, a men patient with a body weight of 65 kg and hematocrit of 40% has a plasma volume of 1.95 L, so the add-on peak titer of anti-HBs after infusion of HBIG 10,000 IU is 5,128 IU/L. If the target trough anti-HBs titer is 500 IU/L and SHL is 15 versus 20 days, the infusion interval becomes 52 versus 70 days, respectively. If the target trough titer is 200 IU/L and SHL is 15 versus 20 days, the infusion interval becomes 71 versus 95 days, respectively (Fig. 1B).
In the 100 patients of the study cohort 2, the actual trough anti-HBs titers, according to the mean HBIG infusion intervals and SHL, were 1,236.8 ± 758.0 IU/L (median, 1,045) and 20.0 ± 8.6 days for a 50-day interval (47–53 days); 1,105.1 ± 508.7 IU/L (median 1,018) and 21.3 ± 3.5 days for a 60-day interval (57–63 days); 1,022.0 ± 550.6 IU/L (median 866) and 21.3 ± 3.8 days for a 70-day interval (57–63 days); 918.0 ± 469.7 IU/L (median, 713) and 22.2 ± 3.3 days for an 80-day interval (77–83 days); 712.0 ± 292.1 IU/L (median, 582) and 21.3 ± 4.3 days for a 90-day interval (87–93 days); and 642.4 ± 307.8 IU/L (median, 480) and 21.6 ± 3.3 days for a 100-day interval (97–103 days), respectively. These actual data supported that time-dependent consumption of exogenous HBIG roughly followed the simulation model using SHL.
Validation of the simulation model using SHL (Part 4)
We performed a prospective study to prolong the intervals of HBIG infusion to 12 weeks (94 days), with a target trough anti-HBs titer of 200 IU/L. The study protocol included slow progressive prolongation of the interval of HBIG infusion toward 12 weeks, with concurrent use of NA. We compared the actually measured and SHL-bases trough anti-HBs titers to validate the accuracy of titer prediction as a validation study. If the trough anti-HBs titer is in the 200–500 IU/L range, we keep the interval unchanged; if it is below 200 IU/L, the interval is shortened by 1–2 weeks until 8 weeks, and if it is above 500 IU/L, the interval is prolonged by 1–2 weeks until 16 weeks. More than 150 patients have been recruited, to date. For this interim analysis, we selected 114 patients who observed the study protocol for ≥ 24 months (study cohort 3). During the follow-up period, progressive prolongation of the interval of HBIG decreased the trough anti-HBs titer, accordingly to the target trough titer. The profiles of these 114 patients are summarized in Table 1. The lowest trough anti-HBs levels among the latest three measurements were used for calculation of SHL.
The infusion intervals of HBIG were 8–9 weeks in 3 patients (2.6%) and their trough anti-HBs level and mean SHL were 685.3 ± 270.7 IU/L and 19.8 ± 4.6 days, respectively; 10–11 weeks in 10 patients (8.8%), and their trough anti-HBs level and mean SHL were 352.7 ± 196.9 IU/L and 18.2 ± 3.5 days, respectively; 12 weeks in 84 patients (73.7%), and their trough anti-HBs level and mean SHL were 359.5 ± 144.1 IU/L and 20.7 ± 3.0 days, respectively; 13–14 weeks in 16 patients (14.0%), and their trough anti-HBs level and mean SHL were 615.2 ± 239.4 IU/L and 27.6 ± 4.5 days, respectively; and 16 weeks in 1 patient (0.9%), and the trough anti-HBs level and mean SHL were 369 IU/L and 27.4 days, respectively. Prolongation of the intervals of HBIG infusion ≥ 12 weeks was successfully achieved in 101 patients (88.6%). The distribution of infusion intervals and lowest trough anti-HBs levels are depicted in Fig. 4.
A cross-sectional study on empirical determination of HBIG infusion intervals (Part 5)
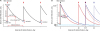
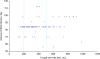
We performed a cross-sectional study, to reveal the current status of HBIG infusion intervals in our institution during the recent 3 months. We selected 660 patients who have passed 5–14 years after LT and been regularly followed-up only at our institution (study cohort 4). Nine transplant surgeons of our institution independently determined the interval of HBIG infusion on a patient-by-patient basis under the simplified principle, to maintain a trough serum anti-HBs titer ≥ 500 IU/L. The profiles of these 660 patients are summarized in Table 1. The lowest trough anti-HBs levels among the latest three measurements were used for calculation of SHL. The distribution of infusion intervals and lowest trough anti-HBs levels are depicted in Fig. 5.
 | Fig. 5Scatter plot showing the association between the trough anti-HBs titer and HBIG infusion intervals after stratification according to concurrent use of NA in the 660 patients of the study cohort 4. Diamonds and squares indicate patients with and without NA administration, respectively.anti-HBs = hepatitis B surface antibody, HBIG = hepatitis B immunoglobulin, NA = nucleos(t)ide analog.
|
The mean trough anti-HBs level was 751.1 ± 340.0 IU/L and simulative add-on anti-HBs level was 5,842.5 ± 1,169.6 IU/L, for which, the peak anti-HBs level was 6,572.6 ± 1,283.4 IU/L. Since the mean infusion interval was 62.5 ± 15.0 days, the resulting mean SHL was 19.5 ± 4.4 days.
After stratification, according to concurrent use of NA as HNCT (n = 374) and HBIG monotherapy (n = 286) groups, the mean trough anti-HBs levels were 609.1 ± 302.5 IU/L in the HNCT group and 934.6 ± 295.3 IU/L in the HBIG monotherapy (P < 0.001), respectively; the mean infusion intervals were 66.2 ± 15.9 and 57.8 ± 12.2 days, respectively (P < 0.001); and the mean SHLs were 19.3 ± 4.2 and 19.8 ± 4.3 days, respectively (P = 0.13). These findings implicate HBIG was less frequently administered in the HNCT group than in the HBIG monotherapy group.
The trough anti-HBs level was < 500 IU/L in 181 patients (27.4%); 500–749 IU/L in 164 (24.9%); 750–999 IU/L in 163 (24.7%); 1,000–1,499 IU/L in 140 (21.2%); and ≥ 1,500 IU/L in 12 patients (1.8%), respectively. Considering the reserve for fluctuation of trough anti-HBs level (empirically up to 250 IU/L), only 164 patients (24.9%) exactly met the target level; 181 patients (27.4%) did not reach the target level; and 315 patients (47.7%) showed excessively higher titers than the target level.
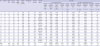
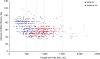
Given the target trough anti-HBs level was 500 IU/L (peak anti-HBs titer becomes the sum of 500 IU/L and add-on peak titer from HBIG 10,000 IU infusion), and individual SHL was applied, the mean HBIG infusion interval was estimated to be 70.9 ± 16.6 days in these 660 patients (Fig. 6). Thus, a mean interval of 10 weeks can be applied to achieve a trough anti-HBs level of 500 IU/L. Comparing with the actual infusion intervals, 355 patients (53.8%) can be indicated for interval prolongation by ≥ 7 days, and 89 patients (13.5%) can be indicated for interval shortening by ≥ 7 days.
 | Fig. 6Scatter plot showing the association between the simulative half-life of HBIG and intervals of HBIG infusion according to the target anti-HBs titers in the 660 patients of the study cohort 4.HBIG = hepatitis B immunoglobulin, anti-HBs = hepatitis B surface antibody.
|
Given the target trough anti-HBs level was 200 IU/L, and individual SHL was applied (peak anti-HBs titer becomes the sum of 200 IU/L and add-on peak titer from HBIG 10,000 IU infusion), the mean HBIG infusion interval was estimated to be 95.2 ± 22.0 days (Fig. 6). Hence, a mean interval of 13 weeks can be applied to achieve a trough anti-HBs level of 200 IU/L. Comparing with the actual infusion intervals, 623 patients (94.4%) can be indicated for interval prolongation by ≥ 7 days, and only 1 patient (0.2%) can be indicated for interval shortening by ≥ 7 days.
DISCUSSION
The primary background reason for undertaking this study was our recognition that the posttransplant HBV prophylaxis protocols in Korea have been already moved toward HNCT, but the protocols for HBIG infusion were not correspondingly changed in many Korean LT centers, including our institution.
HBV prophylaxis protocols have primarily originated with HBIG monotherapy. Thus, HNCT has begun to simply add an NA to HBIG monotherapy, with or without lowering the target trough anti-HBs titer. In the real-world practice in Korea, a majority of LT centers have still adopted high-dose HBIG prophylactic therapy, with or without NA, because there is no consensus or practical guideline to lower the target trough anti-HBs titer, primarily due to the meager medical cost, with the patients paying only 60–120 US dollars per 10,000 IU HBIG (5%–10% of total cost). We believe that the target trough anti-HBs titer would have been lowered if the medical cost for HBIG infusion had not been so low in Korea.
HNCT is well known to be more effective than HBIG monotherapy or HBIG-free NA monotherapy. Considering the high efficacy of HNCT, it must be reasonable to make the target trough anti-HBs titer lower than that of HBIG monotherapy. Consequently, it is necessary to develop a practical method to readjust the target trough anti-HBs titer logically, in LT recipients regularly administering HBIG. In the current LT setting in Korea, prolongation of HBIG infusion interval is more convenient to the patients than reduction in the amount of HBIG infusion. For this reason, we only investigated the intervals of HBIG infusion in this study because adjustment of HBIG amount can be easily performed later, through simple modification of the add-on peak titer.
Since the in vivo half-life of HBIG varies widely with occasion or time, as well as person, it is difficult to reliably make the trough anti-HBs titer close to the target level. Hence, a considerable number of patients have shown much higher trough titer than the target level, as verified in this study, which implies that HBIG has been administered too much or too frequently than required. It had been previously thought that the anti-HBs titer was proportional to the efficacy of preventing HBV recurrence, thereby explaining the much higher anti-HBs titer than the target trough level, but such a concept is no longer valid in the current clinical field of LT. After passing the very early posttransplant period of active HBV neutralization by HBIG, an excessively high anti-HBs titer is not as effective as expected because HBIG consumption is very highly accelerated or HBIG is no longer effective if HBV-resistant mutants develop. In contrast, high genetic-barrier NAs are very effective to suppress HBV replication,8 but it still carries the risk of development of drug-resistant mutants. Thus, HNCT is the most effective prophylactic regimen, so far.
From the viewpoint of cost-effectiveness, simple addition of NA to HBIG monotherapy increases medical cost, making it necessary to decrease the financial burden, through reduction of excessively infused HBIG. However, any change in the real-world clinical practice requires robust evidence because it is often related to the safety of patients. Thus, we focused on designing a practical method to safely prolong the interval of HBIG infusion, which can lead to reduction in the total amount of HBIG infused. Prolongation in the interval of HBIG infusion means that the patients visit the outpatient clinic less frequently, creating patient-friendly as well as cost-effective outcomes.
An in vivo PK study of HBIG administration in each patient is ideal, but not practical. We searched for a practical method to replace the cumbersome PK study, by which we developed the concept of SHL estimation. To our knowledge, HBIG administration, according to its personalized half-life, has not been reported before. In Part 1 of the present study, we demonstrated that there was only a difference of 4.4% between the estimated and actually measured add-on rise of anti-HBs titer after infusion of 10,000 IU HBIG. This small discrepancy meant the SHL was only 2.2% longer than that of the actual measurement. The ranges of such differences were considerably small, so we believed that SHL estimation could be reliably used in Parts 2–5 of this research.
In Part 2, we focused on the intra- and inter-individual variabilities of HBIG consumption in patients who passed the first 1 year after LT. Analysis of the SHL revealed a mean of 14.0% ± 3.4% for intra-individual CV and 19.0% ± 1.3% for inter-individual CV. These results imply that there are non-negligible patient-to-patient discrepancies in HBIG consumption, but intra-individual time-to-time fluctuation was rather smaller than patient-to-patient disparities, and so we suggest that individualized SHL is reliably applicable lifelong. A Korean prospective multicenter study determined that the trough anti-HBs titer stabilized after 16 weeks of LT, according to the usual protocol described in the method section of this study.10 Therefore, individualized adjustment of intervals for HBIG infusion toward a certain target trough titer can be reliably determined by adoption of SHL at 1 year after LT.
We also investigated the potential factors that can affect SHL. We assessed the influence of pretransplant HBV DNA load, but there was no association between the long-term SHL and pretransplant HBV DNA load. This finding is not consistent with our previous study, in which high pretransplant HBV load was associated with rapid HBIG consumption requiring a shortened interval of HBIG infusion and high incidence of HBV recurrence.1 We think that there is a definite difference in selection of the study patients, in which our present study did not include the patients with recurrence of HBV or HCC, but our previous study included the whole single-center cohort including the patients suffering from HBV or HCC recurrence.1 In a Korean multicenter analysis, blood HBV DNA was detectable at 1 week after LT in 13 of 79 patients, and their pretransplant HBV DNA was 823,143 ± 1,506,950 IU/mL, which was marginally higher than other 66 patients showing no HBV DNA positivity at posttransplant 1 week.10 One of them showed persistent blood HBV DNA positivity up to 8 weeks.10 However, after passing the very early posttransplant period requiring high-dose HBIG, the trough anti-HBs titer became stabilized. These findings indicate that it is beneficial to perform pretransplant NA treatment actively to reduce the HBV viral load because HBIG with/without NA at the time of LT operation cannot eradicate viral load in the circulating blood or extrahepatic sites. However, once occult HBV viral load is fully suppressed by HBIG after passing the very early posttransplant period, it may not accelerate HBIG consumption unless HBV reactivation develops. At first, we had wondered whether concurrent posttransplant NA administration might be associated with prolonged SHL, but we found that there was no significant difference in SHL between HBIG monotherapy and HNCT in patients without HBV reactivation, as shown in Parts 2 and 5 of this investigation.
In Part 3 of this work, we developed a clinical simulation model to adjust the interval of HBIG infusion effectively. The required parameters were gender, body weight, hematocrit, SHL, and target trough anti-HBs titer. Through 1,000 measurement sessions in Part 2 of this research, we learned that the mean SHL might be around 20 days, with an intra-individual CV of 14.0% ± 3.4% and inter-individual CV of 19.0% ± 1.3%. Based on our long-term follow-up experience, we have set the interval of HBIG infusion at 8–12 weeks for a target trough anti-HBs titer of 500 IU/L, which often resulted in the actual trough anti-HBs titer between 500 and 1,000 IU/L.
Although the target trough anti-HBs titer was set at 500 IU/L, the actual level in clinical practice was usually higher than the target level. To enhance the cost-effectiveness of HBV prophylaxis, we intended to lower the target trough anti-HBs titer toward 200 IU/L, in Part 4 of this research. We observed that 114 patients were successfully managed with a regular HBIG infusion at ≥ 8-week intervals, which could be prolonged to ≥ 12 weeks in 101 patients (88.6%). Considering that only 11.1% of measurement sessions showed anti-HBs trough titers < 500 IU/L (Part 2 of this work), we believe that a majority of our patients are indicated for prolongation of HBIG infusion intervals. If the target trough anti-HBs titer is set at 200 IU/L, the interval of HBIG infusion will be prolonged in nearly all of our patients.
In Part 5 of this investigation, we analyzed the actual intervals of HBIG infusion in 660 patients who passed 5 years after LT. We found that only 24.9% exactly met the target anti-HBs trough titers ≥ 500 IU/L, with a reserve of an additional 250 IU/L. Another 27.4% did not meet the target level, and 47.7% exceeded the target level. Comparing with the actual infusion intervals, simulative analyses revealed that 53.8% of the patients could be indicated for interval prolongation by ≥ 7 days, and 13.5% could be indicated for interval shortening by ≥ 7 days, respectively, when setting the anti-HBs trough titer at ≥ 500 IU/L. If the target anti-HBs trough titer is lowered to 200 IU/L, 94.4% of the patients could be indicated for interval prolongation by ≥ 7 days, while only 0.2% could be indicated for interval shortening by ≥ 7 days.
There are a few recent studies about HBIG-free and HBIG-sparing HBV prophylaxis regimens.89 Theoretically, HBIG-free NA prophylaxis cannot prevent intraoperative HBV infection of naïve graft hepatocytes unless sustained virological response (SVR) is achieved before LT operation. Thus, it may be reasonable to attempt HBIG-free NA prophylaxis only to the patients who show SVR before LT. In a report of entecavir monotherapy from the University of Hong Kong,8 Two hundred six of 242 (85%) patients showed HBsAg seroclearance, and HBsAg seroclearance occurred within 1 year in 90% of the patients. The HBsAg reappearance rate was 13% at 3 years. The 265 patients, including 99 patients having undetectable HBV DNA at LT, showed an HBsAg seroclearance rate of 92% and an HBV DNA undetectable rate of 100%, at 8 years. At 1 year of LT, the HBsAg seroclearance rates were 98%, 92%, 81%, and 60% for HBV DNA at LT of undetectable levels, ≤ 4 log, > 4–6 log, and > 6 log IU/mL, respectively (P < 0.001). The authors have also commented that additional HBIG administration would invariably lead to a decreased rate of HBsAg. From the viewpoint of prophylactic efficacy and cost-effectiveness, if pretransplant SVR is not achieved, NA prophylaxis with concurrent HBIG administration, at least for a short period, is beneficial to minimize perioperative HBV infection of the graft hepatocytes.9
Considering the high effectiveness of NA prophylaxis, there is no reason to maintain the trough anti-HBs titer as high as that in HBIG monotherapy. Maintenance dosing for HBIG infusion is highly variable across LT centers worldwide.14 The target levels for trough anti-HBs titer decreases with time after LT: generally, the anti-HBs titer levels were maintained at greater than 500 IU/L during 1–3 months; at greater than 250 IU/L until 6–12 months; and at greater than 50 to 100 IU/L, after that. Some studies using low-dose HBIG had successful HBV prophylaxis with target trough anti-HBs titers of 100 or 50 IU/L.15–17 The optimal trough anti-HBs titer needed to prevent recurrence in the medium- and long-term follow-up is unknown, but probably reduced if NA therapy is combined with HBIG. A meta-analysis with 19 studies, including 1,484 patients, indicated HBIG administration was helpful to reduce HBV recurrence and virus mutants, and subgroup analysis showed that in patients with positive pretransplant HBV DNA status, HBIG was necessary to reduce the HBV recurrence rate.18 In contrast, in patients with negative HBV DNA, HNCT gained no significant advantages.18
This study has some limitations. First, three of the five study parts were performed retrospectively. Second, it is a single-center study, although the study cohorts were sizeable. Third, we intentionally excluded the patients who showed HBV recurrence, for simplification of the study design, and so risk factor analysis for HBV recurrence was not carried out.
In conclusion, SHL estimation, using clinically available parameters, seems to be reliably accurate when compared with the results from the actual measurement. We believe that SHL estimation is helpful to establish an individualized HBV prophylaxis protocol, to optimize the interval of HBIG administration. Further prospective and multicenter studies are necessary to validate the clinical role of SHL estimation.
 XML Download