

 PDF
PDF Citation
 Print
Print


INTRODUCTION
Diabetes mellitus (DM) is a well-known risk factor, not only for coronary artery disease (CAD), but also for the development of diabetic cardiomyopathy. The diabetic cardiomyopathy develops independently of CAD and hypertension and causes increased cardiovascular morbidity and mortality.12 DM causes chronic vascular changes in both micro- and macrovascular systems and ultimately leads to multi-organ dysfunction. Regarding the macrovascular changes, DM is associated with accelerated atherosclerosis and premature coronary, peripheral, and cerebrovascular disease. The effect of DM on the coronary macrovasculature, i.e., epicardial coronary artery, has been extensively studied; however, data on coronary microvasculopathy are scarce compared to those of the major microvascular complications, such as nephropathy, retinopathy, and neuropathy.
Previous studies have reported a “paradoxical” absence of significant stenosis in epicardial arteries in patients with significant ischemic symptoms and positive exercise test,345 implying the existence of coronary microvasculopathy. Diabetic cardiomyopathy is known to be associated with abnormal coronary microcirculation which is characterized by reduced levels of bioavailable nitric oxide.67 However, the characteristics of abnormal coronary microcirculation is not well defined with the current diagnostic modalities.
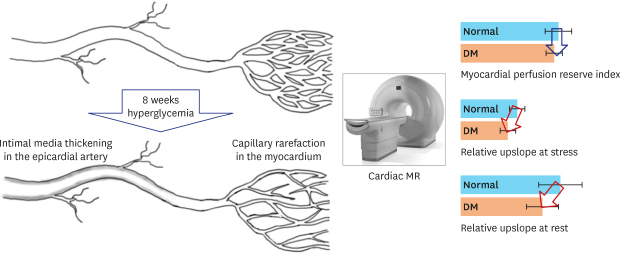
Altered glucose homeostasis, metabolic, humoral, and hemodynamic disturbances contribute to the initiation and progression of vasculopathy in diabetic patients.8 Suggested mechanisms include hyperglycemia-induced apoptosis or structural changes in vascular endothelial (VE) cells and cardiomyocytes through inflammation, oxidative stress, glycated products, or protein kinase C activation.12 Recently, we found a novel mechanism where abnormal intercellular signaling in endothelial cells decreased the capillary diameter and induced microvascular rarefaction in diabetic conditions in a human in-vitro model of angiogenesis and in the retina, heart, skeletal muscle, and kidney of mice.910 The microvascular changes in DM has not been evaluated in a large animal model or human. The diagnosis of coronary microvasculopathy in patients with DM is challenging because macrovascular changes often coexist and the histologic examination of microvessels is not feasible. In the present study, we sought to determine the effect of DM on macro- and microvascular abnormalities in diabetic pigs using the state-of-the-art diagnostic modalities. In addition, we also validated our findings in diabetic patients using cardiac magnet resonance (CMR) imaging.
METHODS
Study design and animals
A total of 8 domestic female pigs weighing between 20 and 25 kg were used for this study. Type I DM was induced in four pigs by intraperitoneal injection of streptozotocin at a dose of 150 mg/kg.1112 Consecutive measurements of serum glucose were performed at pre-determined time points. Sustaining blood glucose levels > 250 mg/dL were considered as having diabetes. If blood glucose exceeds 400 mg/dL, 4 to 8 units of long-acting insulin (Lantus®; Sanofi-Aventis, Paris, France) were injected to avoid acute complications such as diabetic ketoacidosis or hyperosmolar coma. The pigs underwent coronary angiography (CAG) with optical coherence tomography (OCT) at 1 and 2 months and CMR imaging and coronary computed tomography angiography (CCTA) at 2 months. After invasive and non-invasive imaging the pigs were sacrificed for histologic analyses (Fig. 1A).
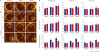
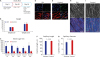 | Fig. 1Microvascular changes of the heart in diabetic pigs. (A) Study flow. (B) Weight of the pigs on day 0 and day 56. (C) The results of serum glucose tests of the pigs at certain time points. (D, E) Myocardial capillaries of the DM and control pigs. (F, G) Quantification of the capillaries between diabetic and control pigs. (H, I) Capillary endothelial junction (VE-cadherin) in the diabetic and control pigs.DM = diabetes mellitus, CAG = coronary angiography, OCT = optical coherence tomography, CCTA = coronary computed tomography angiography, CMR = cardiac magnet resonance, VE = vascular endothelial; DAPI = nucleus, α-SMA = alpha-smooth muscle actin, Lectin = BS-1 lectin, Merge = merged figure.
|
Coronary angiogram
The animals were given aspirin (300 mg) and clopidogrel (300 mg) 1 day before the procedure. The pigs received premedication with intramuscular injection of atropine sulfate (0.5 mg/kg), and then Zoletil (4–6 mg/kg) and Xylazine (4.4 mg/kg). After endotracheal intubation, the anesthesia was maintained with 70% N2O and isoflurane (1%–2%) in oxygen (2 L/min) by an experienced veterinarian.
A 6-French vascular sheath was introduced into the femoral artery using the Seldinger technique under sonographic guidance. Under fluoroscopic guidance, 6-French Judkin right 3.5 guiding catheters were positioned in the left coronary ostium. After the intracoronary administration of nitroglycerin (200 μg), CAG was performed. Intracoronary administration of 5,000 units of unfractionated heparin was given to prevent thrombus formation.
OCT
OCT images were acquired using the OCT system consisting of an optical fiber, a proximal low pressure occlusion balloon catheter (Helios™ Goodman; Advantec Vascular Corp™, Sunnyvale, CA, USA), and an OCT system mobile cart containing the optical imaging engine and computer for signal acquisition, analysis, and image reconstruction (M2CV OCT Imaging System; LightLab, Westford, MA, USA).
The left anterior descending artery (LAD) and left circumflex artery were wired with a 0.014-inch Runthrough guide wire (Terumo, Tokyo, Japan) and then replaced by an OCT ImageWire™ and the occlusion balloon. The occlusion balloon was pulled-back and positioned in a proximal-segment of the arteries. Inflation was performed gently up to 0.4 to 0.7 atmosphere with a dedicated inflation device. The vessel segments were imaged using an automated pull-back (1.0 mm/sec) from the distal to proximal segments. Images were acquired at 15 frames per second and displayed in a real-time 2D array at different transverse positions.
CCTA
All pigs underwent CCTA with a 64-slice multi-detector computed tomography (CT) scanner (Brilliance 64; Philips Medical Systems, Best, The Netherlands) in the prone-position. Prior to CCTA, all animals with a baseline heart rate > 70 beats/min received 10 to 30 mg of intravenous esmolol (Jeil Pharm, Seoul, Korea). CCTA was performed with a 64 × 0.625 mm section collimation, 420-ms rotation time, 120-kV tube voltage, and 800-mA tube current. During CCTA acquisition, a bolus of 80 mL iomeprol (Iomeron 400; Bracco, Milan, Italy) was injected intravenously (4 mL/sec). The animals' electrocardiogram (ECG) was simultaneously recorded to allow for retrospective segmental data reconstruction. Images were initially reconstructed at the mid-diastolic phase (75% of R-R interval) of the cardiac cycle. Compartment analysis was performed by using the cardiac CT viewer tool of the workstation (IntelliSpace Portal ISP, version 8.0; Philips Medical Systems). Center lines were rotated to the sagittal plane to acquire suitable short-axis pig heart image. Hounsfield units (HU) of region of interest were measured using the dedicated software in the 16 segments (American Heart Association [AHA] model, true apex not imaged) of the heart, ascending and descending aorta, and left ventricular (LV) cavity in 2 or 3 phases of the heart cycle. We calculated the ratio of HU of the myocardial segments to the averaged HU of the aorta and LV cavity.
CMR imaging and perfusion
All CMR studies were performed using a 1.5 T magnetic resonance (MR) imaging scanner (Siemens Avanto, Erlangen, Germany or Intera CV release 10; Philips Medical Systems) with a phased array cardiac coil. Cine images were acquired retrospectively with ECG-gated steady-state free precession (SSFP) sequences (image matrix 128 × 128, read field of view [FOV] 340 mm, phase FOV 75%–100% of the FOV read, echo time 1.12 ms, flip angle 70°) with a slice thickness of 8 mm and intersection gaps of 12–15 mm.
We performed pharmacological stress and rest perfusion studies. After the acquisition of cine scans at rest in the standard views, adenosine was intravenously infused at a dose of 140 μg/kg/min for up to 6 minutes via a 20-gauge cannula using a syringe pump (Graseby® 3500; Smiths Medical, Minneapolis, MN, USA). Within the last minute of infusion, a bolus of gadodiamide (Omniscan; GE healthcare, Chicago, IL, USA) was injected (dose, 0.1 mmol/kg; injection rate, 4 mL/sec) and stress perfusion MR images were obtained with a gradient-echo sequence by using saturation-recovery SSFP. After 15 to 25 minutes, an identical MR perfusion scan was performed at rest.
Data were analyzed using a dedicated software (QMass; Medis, Leiden, the Netherlands). First-pass perfusion images at stress and rest states were analyzed semiquantitatively. The AHA 16-segment model was used (true apex not imaged), resulting in a total of 32 segments per pig (16 for the stress examination and 16 for the resting examination). Signal intensity (SI)-time curves were generated for all segments. The relative upslope at rest or at stress (RRU or SRU) was calculated by the maximum upslope of the LV myocardium divided by the maximum upslope of the LV cavity at stress and rest states. The myocardial perfusion reserve index (MPRI) was calculated as the ratio of the segmental upslope values during adenosine stress and rest (MPRI = SRU/RRU).
Immunofluorescence staining and confocal microscopic analysis
After euthanasia of the pigs, the coronary arteries were perfused with phosphate-buffered saline (PBS) and 2% paraformaldehyde (PFA) in PBS at room temperature. The isolated tissues were embedded in an optimal cutting temperature compound (Sakura Finetek, Torrance, CA, USA) and stored in a −80°C deep freezer. Frozen sagittal sections were cut into 25 to 30 μm slices using a cryostat (HM 550 MP; Microm, Walldorf, Germany). The sections were fixed with 4% PFA in PBS for 10 minutes and permeabilized with 10% fetal bovine serum and 0.5% Triton-X100 in PBS for 4 to 6 hours. We incubated the slices with tetramethyl rhodamine isothiocyanate-conjugated Bandeiraea simplicifolia 1-lectin (Sigma Aldrich, St. Louis, MO, USA) and fluorescein isothiocyanate-conjugated alpha smooth muscle actin (Sigma Aldrich) overnight at 4°C. We also stained the slices overnight at 4°C with specific primary antibody, anti-VE-cadherin (Santa Cruz Biotechnology, Santa Cruz, CA, USA), followed by incubation with fluorescent-tagged secondary antibodies (Invitrogen, Carlsbad, CA, USA) overnight at 4°C. The images were acquired by a confocal laser scanning microscope system (LSM 710; Carl Zeiss AG, Oberkochen, Germany) and processed with Zen 2008 (Carl Zeiss AG) and ImageJ (NIH, Bethesda, MD, USA) software. A water- or oil-immersion objective (40× or 63×, 1.4 numerical aperture) with the pinhole set for a section thickness of 0.8 to 1.2 μm (1 airy unit in each channel) was used. To visualize the three-dimensional reconstructed image, a Z-stack of 20-μm thickness was obtained. Diode 405 nm, Multi-Argon 488 nm, HeNe 543 nm, and HeNe 633 nm laser lines were selected and images were sequentially acquired using separate laser excitations to avoid cross-talk between different fluorophores.
Immunofluorescence quantification of microvasculopathy in the myocardium
For comparative analysis we created images under same conditions of light, contrast, and magnification. Total capillary length and average diameter of the capillaries in images of tissues from mid-ventricular six segments of each pig were measured with ImageJ software (NIH). Therefore, 24 fields for each group were selected for image analysis. For evaluation of the capillary diameter at various points of interest in z-stack images, we measured the width of the lectin-positive area that was perpendicular to the capillary length. As consequence, the capillary diameter in this study corresponds to the abluminal diameter.
Patients
We retrospectively enrolled patients with ST-segment elevation myocardial infarction (STEMI) who underwent CMR 5 to 7 days and 6 months after the onset of myocardial infarction (MI) from January 2005 to November 2012. We then compared the myocardial perfusion in non-infarct segments between patients with and without DM.
Statistical analysis
Continuous variables are expressed as mean ± standard deviation or mean ± standard error and categorical variables are presented as absolute numbers and proportions (%). Overall comparisons between groups were performed with the Student's t-test or the Wilcox rank sum test for continuous variables and the χ2 or Fisher exact test for categorical variables. In the MR perfusion experiments, we measured RRU, SRU, and MPRI values for 16 segments according to the AHA 16-segments model in all animals and tested whether the measured values differed between the groups. Because the measured values may also be influenced by the segments, the segment was treated as a factor as well. As consequence, we included both segments and groups as factors in the analyses and applied the two-way analysis of variance (ANOVA) to evaluate ‘the effect of the groups’ after adjusting ‘the effect of the segments.’ To check the normality of the data, we analyzed the residuals of each models using the following two methods. First, we confirmed that SRU and MPRI satisfy the normal distribution with the Shapiro tests. Second, we also visually confirmed the normality using histogram with normal density and QQ-plot. Both methods confirmed the normal distribution of the data. The appropriateness of two-way ANOVA models was tested with the Levene test and the Bartlett test.
Analyses were performed with SPSS version 22.0 (IBM Corp., Armonk, NY, USA) and R programming version 3.1.0 (The R Foundation for Statistical Computing, Vienna, Austria). A two-sided P value < 0.05 was considered statistically significant. The statistical analyses were performed by a professional statistician (SHK).
Ethics statement
The present study protocol was reviewed and approved by the Institutional Review Board (IRB) of Seoul National University Bundang Hospital (IRB No. B-1703-388-102). Informed consent was waived because of the retrospective design and inability to obtain by the IRB.
The current study protocol was approved by the Institutional Animal Care and Use Committee (IACUC) of Seoul National University Bundang Hospital (IACUC No. BA1111-093/071-01). All animals were treated according to the study protocol and the principles of care of laboratory animals.
RESULTS
Microvascular changes
There was no difference in pigs' weights between the groups on days 0 and 56 (Fig. 1B). Both groups showed similar weight gain during the experiment. Blood glucose level in the diabetic pigs was significantly higher than that in the control pigs during the experiment (Fig. 1C). For the evaluation of microvasculature, we first evaluated the capillary anatomy. The two components of interest were the capillary lengths and diameter (Fig. 1D and E). There was no difference in the capillary lengths (129.1 ± 0.44 μm vs. 129.4 ± 0.48 μm; P = 0.365) between diabetic and control pigs; however, diabetic pigs had a significantly shorter capillary diameter (11.7 ± 0.33 μm vs. 13.5 ± 0.53 μm; P < 0.001) as we previously reported (Fig. 1F and G). We also found that VE-cadherin expression in the diabetic capillary was decreased and discontinued compared to that in the control (Fig. 1H and I, Supplementary Videos 1 and 2). Overall, the capillaries in the diabetic pigs were more irregular and disconnected; the capillary diameter was highly variable with frequent acellular capillaries, so called string vessels.
Myocardial flow analysis
MR perfusion
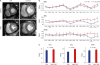
The myocardial perfusion by CMR at rest and during stress was measured in the sixteen myocardial segments in the diabetic and control pigs (Fig. 2A and B). Diabetic pigs had lower mean values of RRU and SRU in most segments. However, MPRI showed no difference. We calculated estimated mean of the RRU, SRU, and MPRI of the 16 segments (Fig. 2C). Diabetic pigs had significantly lower RRU than control pigs (31.3 ± 5.9 vs. 37.9 ± 8.1; P = 0.011) (Fig. 2D). Diabetic pigs also had lower SRU for myocardial perfusion than control pigs (18.0 ± 3.0 vs. 21.6 ± 2.8; P = 0.007). However, there was no difference in MPRI between diabetic and control pigs (0.59 ± 0.05 vs. 0.62 ± 0.08; P = 0.380).
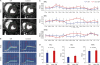 | Fig. 2Cardiac magnetic resonance perfusion in the diabetic pigs. (A) Representative figures measuring the myocardial perfusion in the 6 segments of the mid ventricle at rest and under adenosine stress. (B) Representative figures of the measured myocardial perfusion graphs. Red line = SI-time curve of the left ventricular cavity; cyan lines = SI-time curve of the 6 midventricular myocardial segments. (C) Mean values of the RRU, SRU, and MPRI of the 16 myocardial segments. (D) Estimated mean of RRU, SRU, and MPRI in diabetic and control pigs. P value by two-way analysis of variance. Error bars = standard deviation.BA = basal anterior, BAS = basal anteroseptal, BIS = basal inferoseptal, BI = basal inferior, BIL = basal inferolateral, BAL = basal anterolateral, MA = mid anterior, MAS = mid anteroseptal, MIS = mid inferoseptal, MI = mid inferior, MIL = mid inferolateral, MAL = mid anterolateral, AA = apical anterior, AS = apical septal, AI = apical inferior, AL = apical lateral, DM = diabetes mellitus, SI = signal intensity, RRU = relative upslope at rest, SRU = relative upslope at stress, MPRI = myocardial perfusion reserve index.
|
CT angiography
Myocardial SI in the arterial phase of the CT angiography represents myocardial texture and the amount of contrast in the myocardial microvessels. Therefore, we measured the HU of 16 segments of the left ventricle in the arterial phases and compared them to that of the aorta (Fig. 3A). CT perfusion showed similar results in that the estimated mean ratio of myocardial SI to aortic SI was significantly lower in the diabetic pigs compared to the control pigs (0.43 ± 0.05 vs. 0.48 ± 0.02; P < 0.001) (Fig. 3B).
 | Fig. 3CT angiography. (A) Quantification of contrast-enhanced myocardial SI in the arterial phases of CT angiography. Regions of interest were drawn in the six segments of mid ventricle in the diabetic and control pigs. (B) Estimated mean of ratio of myocardial SI to aortic SI. P value by two-way analysis of variance.DM = diabetes mellitus, CT = computed tomography, SI = signal intensity.
|
Macrovascular changes
CAG and optical coherent tomography
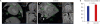
According to the protocol, CAG and OCT were performed at three time points: baseline, 1 month, and 2 months (Fig. 4A). The coronary artery of the pigs increased with their growth. There was no difference in the vessel size of the proximal LAD between diabetic and control pigs (at baseline: 5.59 ± 0.60 mm vs. 5.68 ± 1.26 mm, P = 0.906; at 8 weeks: 7.31 ± 1.34 mm vs. 7.34 ± 1.47, P = 0.983) (Fig. 4B). The lumen diameter of the proximal LAD did not differ (at baseline: 4.56 ± 0.43 mm vs. 4.72 ± 1.16 mm, P = 0.806; at 8 weeks: 5.45 ± 1.29 mm vs. 6.07 ± 1.22 mm, P = 0.582). However, diabetic pigs, but not the control pigs, showed a significant increase in intima-media thickness (IMT), a marker for atherosclerotic changes of a vessel, from baseline to 8 weeks. Consequently, diabetic pigs had a greater IMT than control pigs (at 4 weeks 1.50 ± 0.19 mm vs. 1.02 ± 0.17 mm, P = 0.019; at 8 weeks: 1.86 ± 0.30 mm vs. 1.27 ± 0.27 mm, P = 0.065). There was no hemodynamically significant stenosis in the epicardial coronary arteries in both groups.
 | Fig. 4Epicardial coronary artery. (A) Optical coherence tomography images of the coronary arteries of diabetic and control pigs at baseline, 4 weeks, and 8 weeks. (B) Vessel size, lumen diameter, and intima media thickness of the three segments of LAD at baseline, 4 weeks, and 8 weeks.DM = diabetes mellitus, LCX = left circumflex artery, LAD = left anterior descending artery.
|
Myocardial flow analysis in patients with MI
We retrospectively enrolled 79 patients with STEMI who underwent CMR. Baseline characteristics, MI-culprit lesions, baseline LV function, and infarct size did not differ between the patients with and without diabetes (Table 1). Patients with diabetes reported the duration of DM as median 3 and interquartile range 1–10 years. They had a higher serum glucose 250 ± 113 mg/dL vs. 146 ± 34 mg/dL and hemoglobin A1c (HbA1c) level (7.61% ± 0.28% vs. 5.95% ± 0.11%; P < 0.001) at the time of MI. Patients with diabetes had lower RRU and SRU than those without diabetes, whereas MPRI showed no difference (Fig. 5), as we had observed in the pig model.
Table 1
Clinical characteristics and CMR data of patients with myocardial infarction
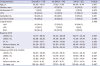
Data are presented as mean ± standard deviation or number (%).
DM = diabetes mellitus, PCI = percutaneous coronary intervention, HTN = hypertension, LAD = left anterior descending artery, LCX = left circumflex artery, RCA = right coronary artery, CMR = cardiac magnet resonance, LVEDV = left ventricular end-diastolic volume, LVESV = left ventricular end-systolic volume, EF = ejection fraction, LV = left ventricular.
![]()
 | Fig. 5Representative figures of cardiac MR perfusion of diabetic and control patients. (A) MR perfusion images under stress and at rest in diabetic and control patients (B) Mean values of the RRU, SRU, and MPRI of the 16 myocardial segments. (C) Estimated mean of RRU, SRU and MPRI in diabetic and control patients. P value by two-way analysis of variance. P value by Wilcoxon rank sum test. Error bars = standard deviation.MR = magnetic resonance, BA = basal anterior, BAS = basal anteroseptal, BIS = basal inferoseptal, BI = basal inferior, BIL = basal inferolateral, BAL = basal anterolateral, MA = mid anterior, MAS = mid anteroseptal, MIS = mid inferoseptal, MI = mid inferior, MIL = mid inferolateral, MAL = mid anterolateral, AA = apical anterior, AS = apical septal, AI = apical inferior, AL = apical lateral, RRU = relative upslope at rest, SRU = relative upslope at stress, MPRI = myocardial perfusion reserve index.
|
During follow-up, despite a significant decrease in HbA1c, patients with diabetes had higher HbA1c than those without diabetes (6.78% ± 0.18% vs. 5.92% ± 0.09%; P < 0.001), indicating adequate diabetes control. The follow-up CMR revealed that LV end-systolic volume in patients with DM was significantly larger than that in non-DM patients (55.8 ± 14.9 mL vs. 61.5 ± 14 mL; P = 0.047). LV end-diastolic volume (142 ± 48 mL vs. 130 ± 29 mL, P = 0.267) was numerically larger and ejection fraction (55% ± 14% vs. 61% ± 14%, P = 0.180) was numerically lower in DM patients than in non-DM. Kaplan-Meier analysis showed that the composite of all-cause death, re-MI, and revascularization did not differ between the groups during a median follow-up of 3 years (Fig. 6).
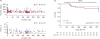 | Fig. 6Blood glucose and HbA1c and clinical outcomes. (A) Diabetic patients have higher glucose and HbA1c levels. (B) There was no difference in MACE between patients with and without diabetes during a median follow-up of 3 years.DM = diabetes mellitus, HbA1c = hemoglobin A1c, MACE = major adverse cardiovascular outcome, MI = myocardial infarction.
|
DISCUSSION
In this study, we evaluated the effect of DM on microvascular and macrovascular changes in diabetic pigs using state-of-the-art diagnostic tools including CAG, OCT, CCTA, and CMR, among others, and found the following: 1) DM caused alterations in capillary structures, 2) without causing significant narrowing in the epicardial coronary artery during the in-vivo experiment period, 3) suggesting that the observed decreased myocardial microvascular perfusion is the result of microvascular changes. In addition, 4) we also showed that STEMI patients with diabetes also had decreased myocardial perfusion. To the best of our knowledge, our study is the first showing DM-related changes in microvascular structure and defects in myocardial microvascular perfusion independent of epicardial CAD in a large-animal model.
We recently reported a novel mechanism in that abnormal intercellular signaling in endothelial cells induces microvascular rarefaction in diabetic mice.910 Briefly, Notch ligand Jagged1 is a key molecule which is involved in the diabetic microvasculopathy. Elevated Jagged1 reduces the nuclear localization of Notch1 intracellular domain and leads to dysregulation of VE-cadherin and N-cadherin in endothelial cells. Diabetic capillary changes began within a few days in vitro and after 4 to 6 weeks in vivo. Interestingly, the changes were reversible by modulation of Jagged1.
In the current study, we could reproducibly show the capillary changes along with down-regulation of VE-cadherin in the diabetic porcine model. VE-cadherin is a junctional adhesion molecule that stabilizes the established endothelium.13 Likewise, the reduced expression and disruption of VE-cadherin correlated with the observed capillary changes such as a smaller capillary diameter, frequent presence of acellular capillaries, and disruptions and rarefication of the capillary.
In fluid hemodynamics, at a constant pressure, the flow is mainly determined by the resistance. Accordingly, in coronary circulation, the coronary flow will be determined by microvascular resistance. These structural changes of capillaries can lead to capillary dysfunction and increase in myocardial resistance in the coronary microcirculation. We repeatedly showed a decrease in myocardial perfusion by CCTA and CMR in the absence of significant epicardial stenosis, suggesting that the reduced myocardial perfusion in subjects with diabetes is mainly due to microvascular changes. In humans, histologic examination was not feasible; however, we also observed similar decrease in myocardial perfusion in diabetic STEMI patients as in the diabetic pigs. Taken together, our study provides reasonable evidence that the diabetes-induced capillary changes occur in small and large animals, as well as in humans.
While the capillary changes in the animal models begins at an early phase of hyperglycemia, the time span in humans is yet to be determined: it may begin in the early stage of DM considering the rapid changes in in-vitro and animal models910; however, clinically significant microvascular complications such as retinopathy or nephropathy develop over 7 years in patients with type 1 DM.14 It is also of note that, until now, we do not know how to define a clinically significant myocardial microvasculopathy. Furthermore, we did not find a difference in clinical mid-term outcome between diabetic and non-diabetic STEMI patients. This was not unexpected considering the small number of patients of this study and the good control of DM reflected by reduction in HbA1c (7.6% at baseline and 6.8% at follow-up). Of note, we found that LV end-systolic volume was getting increased during follow-up in the DM group, which might be affected by the diminished myocardial perfusion. The natural course and long-term effect on the myocardial function and clinical outcomes should be further investigated.
In humans, functional and structural abnormalities of the coronary microcirculation are often observed in diabetic patients with normal coronary arteries.151617 The coronary flow reserve (CFR) is the ratio between hyperemic and resting coronary flow like MPRI in our study. In the absence of significant stenosis of the epicardial coronary arteries, the reduction of CFR has been reported to represent coronary microvascular dysfunction.18 A reduction in CFR and myocardial blood flow was associated with increased cardiac mortality in diabetic patients without coronary artery stenosis.19202122 In the present study, we examined the segmental myocardial perfusion in the porcine heart two months after the induction of DM and observed impaired myocardial blood flow at rest and stress but not the decrease in MPRI in contrast to previous reports.22 In line with our previous reports,9 we think that diabetic microvasculopathy progresses at an early stage of hyperglycemia due to capillary remodeling which does not involve arteriole or epicardial CAD and thus does not impair the CFR or MPRI in the porcine model.
Currently, OCT is the clinically applicable imaging modality with the highest spatial resolution for the visualization of the coronary anatomy. In this study, OCT displayed no hemodynamically significant stenosis, but it did show a greater IMT in the coronary arteries of diabetic pigs. IMT represents early atherosclerotic changes of a vessel. Vascular remodeling is a homeostatic response to changes in flow and circumferential stretch to maintain or restore normal shear stress and wall.23 Theoretically, decreased coronary flow due to impaired microcirculation can lead to a decrease in vessel diameter24 and may also accelerate atherosclerosis. Whether the increase in IMT in diabetic pigs is a result of hemodynamic alteration or a result of hyperglycemia-induced changes needs further investigation. In addition, due to the limited duration of the experiment, it is unknown whether longer exposure to hyperglycemia would have led to significant macrovascular changes as well. Nonetheless, the decrease in perfusion in the present study is not affected by the epicardial arterial changes.
In our previous studies, we could reverse microvascular abnormalities by modulating the intercellular signaling, which could be a potential therapeutic target.910 Therefore, a non-invasive monitoring tool for the development or improvement of microvasculopathy in patients with diabetes is of clinical interest and is challenging. We showed that CMR showed decreased myocardial perfusion in diabetic patients, thus CMR may be a good candidate for the non-invasive assessment of microvascular changes. However, STEMI patients group may not be considered as the same target group in the animal experiment because of co-existing CAD and the possible microvasculature alteration in the non-infarct area affected by the infarcted territories. Ideally, the human experiment should have been conducted in subjects without significant CAD. Because the number of diabetic patients is not large enough, we did not perform additional subgroup analyses according to the presence of significant CAD. Nonetheless, further studies with an adequate sample size are warranted before applying the CMR findings to clinical practice.
In conclusion, DM causes microvascular remodeling and a decrease in myocardial perfusion in large animals and humans, which occurs at a very early stage of the disease course. Early and effective interventions are necessary to interrupt the progression of vascular complications in diabetic patients.
 XML Download