

 PDF
PDF Citation
 Print
Print


To the Editor,
The incidence of ovarian cancer is steadily increasing in Japan, with more than half of the women with ovarian cancer having advanced disease at presentation [12]. The standard treatment for epithelial ovarian cancer comprises primary debulking surgery (PDS), followed by platinum-based chemotherapy [3]. However, PDS is associated with a relatively high risk of morbidity and mortality because of its invasiveness. Previous studies demonstrated non-inferiority of overall survival in women with advanced ovarian cancer who received neoadjuvant chemotherapy followed by interval debulking surgery (NACT/IDS) compared with those who underwent PDS [456]. More recent approaches for the initial treatment of epithelial ovarian cancer may have changed. Therefore, we examined temporal trends in the utilization of NACT and changes in survival for epithelial ovarian cancer in Japan.
We conducted a retrospective observational study using data from the Japan Society of Obstetrics and Gynecology (JSOG) gynecological tumor registry database from 2002 to 2015 (n=48,426). This database is an organ-based cancer registry of gynecological malignancies that is supported and managed by the gynecologic tumor committee of JSOG; the database records cancer subtypes, characteristics, treatments, and survival data [7]. The present study was conducted after obtaining approval from our Institutional Review Board.
Information extracted from the database included patient demographics (age, area of registry, and calendar year at diagnosis), tumor histology (serous, mucinous, endometrioid, and clear cell), treatment type (staging surgery, including lymphadenectomy and NACT), and survival outcome (cause-specific survival (CSS). Patients were classified by age according to the definition of the Ministry of Health, Labor and Welfare in Japan: non-elderly (<64 years), young-elderly (65–74 years), and elderly (≥75 years) [89].
The primary objective of this study was to examine time-specific trends of the proportion of women treated using NACT/IDS among patients with primary epithelial ovarian cancer in Japan. The secondary objective was to investigate the temporal trends of the 5-year CSS rate from 2002 to 2011.
Statistical analyses were performed as follows. Continuous variables were assessed using the Mann-Whitney U test or Student's t-test. Ordinal and categorical variables were analyzed using χ2-test. The Joinpoint Regression Program (version 4.7.0.0), provided by the National Cancer Institute (Bethesda, MD, USA), was utilized to evaluate temporal trends, which were analyzed using linear segmented regression [10]. Log transformation was then performed to determine the annual percent change of the slope with 95% confidence intervals (CIs). All hypotheses were 2-tailed, and values of p<0.05 were considered to indicate statistical significance. Statistical analysis was performed using Statistical Package for Social Sciences (version 25.0; IBM SPSS, Armonk, NY, USA).
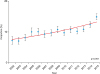
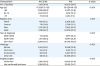
Among 48,426 women, 5,153 (10.6%, 95% CI=10.3–10.9) received NACT (Supplementary Fig. 1). Women who received NACT were more likely to be old, have a recent diagnosis, and be residents of East Japan, but were less likely to be residents of West Japan (p<0.05 for all; Table 1). During the study period, there was a significant increase in the utilization of NACT among the entire cohort: 7.2% to 14.9% (2.1-fold increase, p<0.001; Fig. 1).
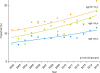
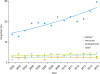
Stratification by patient age (Fig. 2) revealed a significant increase in NACT use among the 3 age groups, with the elderly group exhibiting the largest interval increase (non-elderly, 6.4% to 12.2% [90.6% relative increase, p<0.001]; young-elderly, 11.1% to 21.1% [90.1% relative increase, p=0.002]; and elderly, 6.4% to 18.0% [2.8-fold increase, p=0.001]). Among the 4 histology types (Fig. 3), only serous (13.8% to 29.7%, 2.2-fold increase, p<0.001) and clear cell (1.4% to 4.8%, 3.4-fold increase, p=0.014) types showed interval increases in the utilization of NACT, with the clear cell type exhibiting the largest interval increase. This increase was not observed for the mucinous and endometrioid types (p>0.05 for both).
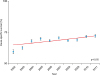
Survival analysis examining cases from 2002 to 2011 (n=24,041) showed that the median follow-up for censored cases was 5.0 (interquartile range, 3.6–5.7) years, with 6,992 (29.5%) deaths occurring because of ovarian cancer. Among the entire cohort, the 5-year CSS rate significantly increased from 59.5% to 72.3% during the study period (21.5% relative increase, p=0.015; Fig. 4).
The present study demonstrated a significant increase in the utilization of NACT in Japan, with one in 7 women with epithelial ovarian cancer receiving NACT in 2015. This increased use of NACT was particularly prominent in elderly women as well as those with clear cell histology. Our study also indicated cohort-level increases in the utilization of NACT as well as 5-year survival rates. A recent study in a US population also reported a shift toward the use of NACT that was associated with a decrease in postoperative mortality and improved cohort-level survival [11].
Patient selection for NACT/IDS should be personalized based on tumor histology because chemoresistant tumors such as clear cell carcinoma may be disadvantageous to this treatment strategy. Japanese women have a higher frequency of clear cell carcinoma occurrence compared with that seen in the US or other Western countries [2]. Therefore, NACT/IDS may not always be a substitute for PDS for the initial treatment of epithelial ovarian cancer in Japanese women. Further studies are required to assess the association between NACT/IDS and this specific histology.
Our study has some limitations. This was a retrospective study; therefore, there may be confounding factors that could have affected the results. For instance, data for cancer stage prior to NACT, indications for NACT, and tumor differentiation to distinguish high-grade and low-grade serous tumors were not available in the JSOG database. Moreover, the database only focuses on leading hospitals in Japan, such as university hospitals and cancer centers, thereby increasing the possibility of selection bias.
In conclusion, there was a significant increase in the use of NACT for epithelial ovarian cancer in Japan. The shift toward NACT may be associated with improved survival among the entire cohort. While this trend may be encouraging for the treatment of chemosensitive tumors with high-grade serous ovarian cancer, its oncological safety remains undetermined in chemoresistant histology types. Therefore, consideration of NACT/IDS in women with ovarian cancer requires careful counseling and individualized treatment discussions with patients due to the unknown safety of this treatment among this population.
 XML Download