

 PDF
PDF ePub
ePub Citation
 Print
Print


INTRODUCTION
Peripheral pulmonary artery stenosis is commonly associated with cyanotic congenital heart disease (1). It may aggravate cyanosis and arterial hypoxemia and even impair lung growth in young patients. Therefore, surgical or interventional pulmonary artery angioplasty is performed in symptomatic patients with severe peripheral pulmonary artery stenosis (23). For treatment planning and post-treatment monitoring, non-invasive imaging methods such as lung perfusion scintigraphy and cardiac magnetic resonance imaging (MRI) are frequently performed in clinical practice (45).
It was recently reported that pulmonary vascular volume ratio measured by cardiothoracic computed tomography (CT) can provide an accurate measure of differential pulmonary vascularity in patients with congenital heart disease (6). The results are particularly promising in children because cardiothoracic CT is originally performed for morphologic evaluation of the pulmonary vasculature and the pulmonary vascular volume ratio can be obtained without additional radiation exposure. However, it remains unknown whether CT vascular volume ratio can be used to evaluate the post-treatment effects of pulmonary artery angioplasty. Therefore, the purpose of this study was to explore whether CT pulmonary vascular volume ratio can be used to evaluate the effectiveness of pulmonary artery angioplasty in patients with peripheral pulmonary artery stenosis.
MATERIALS AND METHODS
This retrospective study was approved by the local Institutional Review Board and the requirement for informed consent was waived.
Study Population
Between June 2011 and November 2018, 38 patients (median age at first cardiothoracic CT, 13 years; range, 9 months to 23 years; M:F = 25:13) who underwent electrocardiography (ECG)-synchronized cardiothoracic CT examinations using a second-generation dual-source scanner (SOMATOM Definition Flash; Siemens Healthineers, Forchheim, Germany) at least twice for evaluating pulmonary artery morphology were included in the study population. CT examinations obtained at the end-systolic phase were included because this cardiac phase provides more accurate CT pulmonary vascular volumes (7). In other words, CT examinations obtained at the mid- or end-diastolic phase were excluded from this study. A total of 80 cardiothoracic CT examinations were available for this study: two CT examinations were available in 34 patients and three were available in four patients. The median time interval between serial CT examinations was 2.9 years (range, 49 days to 6.6 years). Diagnoses in the study population included tetralogy of Fallot (n = 26), pulmonary atresia with ventricular septal defect (n = 6; one patient with major aortopulmonary collateral arteries), Fallot-type double outlet right ventricle (n = 2), isolated peripheral pulmonary artery stenosis (n = 1), transposition of the great arteries with intact ventricular septum (n = 1), left pulmonary artery sling (n = 1), and congenital left diaphragmatic hernia (n = 1). No patient had substantially altered lung anatomy. Before the initial cardiothoracic CT, a total of 24 patients had a history of pulmonary artery angioplasty: among them, 12 had a history of surgical pulmonary artery angioplasty, 11 had a history of pulmonary artery stent placement, and two had a history of percutaneous transcatheter balloon pulmonary artery angioplasty. One patient underwent both surgical and interventional pulmonary artery angioplasty. In contrast, the remaining 14 patients had no history of surgical or interventional pulmonary artery angioplasty. Between serial CT examinations, a total of 15 patients underwent pulmonary artery angioplasty (group 1): among them, surgical pulmonary artery angioplasty was performed in 14 patients, and interventional pulmonary artery angioplasty was performed in two. One patient underwent both surgical and interventional pulmonary artery angioplasty. In contrast, the remaining 23 patients did not undergo pulmonary artery angioplasty between serial CT examinations (group 2). The body surface area on cardiothoracic CT was recorded from electronic medical records. In addition to cardiothoracic CT data, results of lung perfusion scintigraphy, cardiac MRI, and cardiac catheterization were reviewed.
Cardiothoracic CT
Fundamental scan parameters of cardiothoracic CT were as follows: 2 × 64 × 0.6-mm slices with the z-flying focal spot technique, gantry rotation time 0.28 seconds, temporal resolution 75 ms, slice width 0.75 mm, and reconstruction interval 0.4 mm. CT protocols were optimized to minimize the radiation dose and maintain diagnostic image quality by isocentering the patient in a CT gantry using combined tube current modulation (CARE Dose 4D; Siemens Healthineers), the individual body size-adapted radiation dose before scan range adjustment, an aggressive version of the ECG-controlled tube current modulation (MinDOSE; Siemens Healthineers), a biphasic chest pain protocol for a retrospectively ECG-gated spiral scan, and a sinogram-affirmed iterative reconstruction (SAFIRE; Siemens Healthineers) with a medium smooth kernel (I26f) and strength 5 (891011121314).
For ECG-synchronized data acquisition, breath-hold retrospectively ECG-gated spiral scan was used in 65 CT examinations and free-breathing combined prospectively ECG- and respiratory-triggered sequential scan in 15 examinations. For free-breathing children, additional respiratory triggering applied to prospectively ECG-sequential scan using a respiratory gating system (AZ-733V; Anzai Medical Co., Ltd., Tokyo, Japan) can achieve image quality comparable to that of the breath-hold retrospectively ECG-gated spiral scan with lower radiation dose (15). For free-breathing examination in young children (younger than 6 years of age), oral chloral hydrate (50 mg/kg) was given initially to sedate the patient, and intravenous midazolam (0.1 mg/kg) or ketamine (1 mg/kg) was subsequently administered as required. Low tube voltage was used for greater radiation dose efficiency and iodine contrast-to-noise ratio as follows: 70 kV was used in seven examinations, 80 kV in 32, 100 kV in 35, and 120 kV in six. A 32-cm phantom-based volume CT dose index and dose-length product values of cardiothoracic CT were 8.8 ± 5.3 mGy and 191.6 ± 131.2 mGy·cm, respectively. The effective dose estimate of cardiothoracic CT, which was calculated by multiplying the dose-length product by the age, sex, and tube voltage-specific conversion factors for chest CT (16), was 2.6 ± 1.4 mSv.
Iodinated contrast agent (Iomeron 400, iomeprol 400 mg I/mL; Bracco Imaging SpA, Milan, Italy; 1.5–2.0 mL/kg) was administered intravenously using a dual-head power injector at an injection rate of 1.0–3.0 mL/s depending on body size and angiocatheter size. A tri-phasic injection protocol, in which administration of undiluted contrast agent was followed by 50% diluted contrast agent and 5% diluted contrast agent, was utilized for the retrospectively ECG-gated spiral scan to achieve uniform cardiovascular enhancement and minimal peri-venous streak artifacts from the undiluted contrast agent. For prospectively combined ECG- and respiratory-triggered sequential scan, a quadriphasic injection protocol with decremental injection rates was utilized to lengthen peak vascular enhancement times required for longer total scan times as follows: first two phases of undiluted contrast agent was followed by a third phase of 50% diluted contrast agent and a fourth phase of 5% diluted contrast agent (15). Injection rates in the quadriphasic protocol were gradually diminished by 0.1–0.2 mL/s mandatorily between the first and second phases, and optionally between the other phases (15). The scan delay time was determined by a bolus tracking technique with a trigger threshold of 150 Hounsfield units (HU) in the left ventricular cavity.
CT Pulmonary Vascular Volumetry
CT pulmonary vascular volumetry was performed using a commercially available workstation (Advantage Workstation 4.6; GE Healthcare, Milwaukee, WI, USA). After the bony thorax was removed, an attenuation threshold of 200 HU was applied to isolate the thoracic cardiovascular structures from other soft tissues, except in one patient in whom 270 HU was used to exclude atelectasis from pulmonary vessels. The right and left pulmonary vessels were then segmented by eliminating the central part of the thoracic cardiovascular structures at the pulmonary artery bifurcation and the atrial-pulmonary venous junctions. In patients with pulmonary artery stents, the stents were excluded from the pulmonary vessels by applying an attenuation threshold of 800 HU. The volumes of the segmented right and left pulmonary vessels were calculated using the “volumetry” menu of the workstation. From the right and left pulmonary vascular volumes, the pulmonary vascular volume percentages were calculated. An approximate post-processing time of 15–20 minutes was required for each patient.
Effectiveness of Pulmonary Artery Angioplasty in Group 1
Of 15 patients (group 1) who underwent pulmonary artery angioplasty between serial CT examinations, effective pulmonary artery angioplasty was regarded to be achieved when a decreased peak pressure gradient (≥ 40% or < 10 mm Hg) at peripheral pulmonary artery stenosis was observed after the procedure, indexed branch pulmonary artery diameter normalized to body surface area was increased (≥ 50%) on follow-up cardiothoracic CT examination after the procedure, or lung perfusion or pulmonary flow percentage was increased (> 10%) on follow-up lung perfusion scintigraphy or cardiac MRI after the procedure (17-20). Aggravation of peripheral pulmonary artery stenosis was considered present when the peak pressure gradient at peripheral pulmonary artery stenosis was aggravated after the procedure, increased peripheral pulmonary artery stenosis (≥ 50%) was observed on follow-up cardiothoracic CT examination after the procedure, or lung perfusion or pulmonary flow percentage was paradoxically aggravated on follow-up lung perfusion scintigraphy or cardiac MRI after the procedure. These patients were assigned together to group 1A. The remaining patients who did not meet the above-mentioned criteria were assigned to group 1B, and pulmonary artery angioplasty in these patients was regarded
to be ineffective.
Data Analyses
Continuous variables are presented as mean ± standard deviation or median with range, and categorical variables are expressed as frequency with percentage. Changes in the pulmonary vascular volume percentages between serial CT examinations were compared among the three groups (group 1A, group 1B, and group 2) by using unpaired t tests, and one-way analysis of variance combined with Tukey's honestly significant difference post-hoc test to correct for multiple comparisons. Statistical analyses were performed using IBM SPSS Statistics for Windows, Version 24.0 (IBM Corp., Armonk, NY, USA). A p value < 0.05 was considered statistically significant.
RESULTS
In group 1 (n = 15), the results of pulmonary artery angioplasty between serial cardiothoracic CT examinations were determined to be improved in seven patients, ineffective in seven patients, and aggravated in one patient. As a result, eight patients were assigned to group 1A and seven patients were assigned to group 1B. All patients in group 1A demonstrated increased or decreased indexed branch pulmonary artery diameter greater than 50% (range, 71.5–163.0%) on follow-up cardiothoracic CT examination after the procedure. Based on cardiac catheterization data available in three patients, the peak pressure gradients at peripheral pulmonary artery stenosis were decreased by 80.0% and 86.8% in two patients with improved peripheral artery stenosis, and the peak pressure gradient was increased by 17.7% in one patient with aggravated peripheral artery stenosis. Based on lung perfusion scintigraphy or cardiac MRI data available in six patients, only two showed improved lung perfusion or pulmonary blood flow greater than 10% (12.9% and 19.6%), and the changes were smaller than 10% in the remaining four patients including one patient with aggravated peripheral pulmonary artery stenosis. On the other hand, all patients in group 1B demonstrated no substantial changes (< 50%; range, 0.8–43.1%) in the indexed branch pulmonary artery diameter on follow-up cardiothoracic CT examination after the procedure. Cardiac catheterization data were available in one patient, and the peak pressure gradient at peripheral pulmonary artery stenosis was decreased by 16.1%. Lung perfusion scintigraphy or cardiac MRI data were available in one patient, and the changes were smaller than 10% (3.4%).
In group 2 (n = 23, without interim pulmonary artery angioplasty between serial cardiothoracic CT examinations), 21 patients (91.3%, 21/23) showed no substantial changes (< 50%) in the indexed branch pulmonary artery diameter on follow-up cardiothoracic CT examination. Cardiac catheterization data were not available in this group, and lung perfusion scintigraphy or cardiac MRI data were available in three patients, and the changes were smaller than 10% (0.4%, 2.9%, and 3.9%).
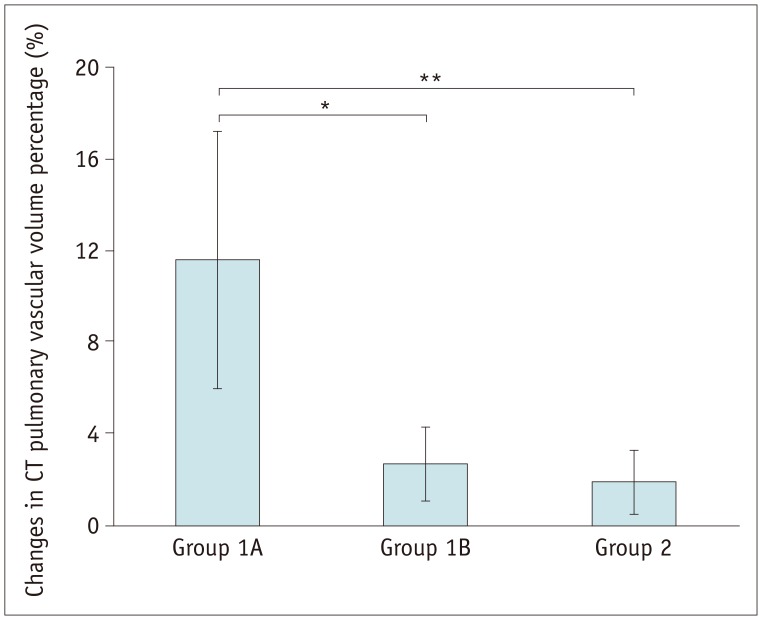
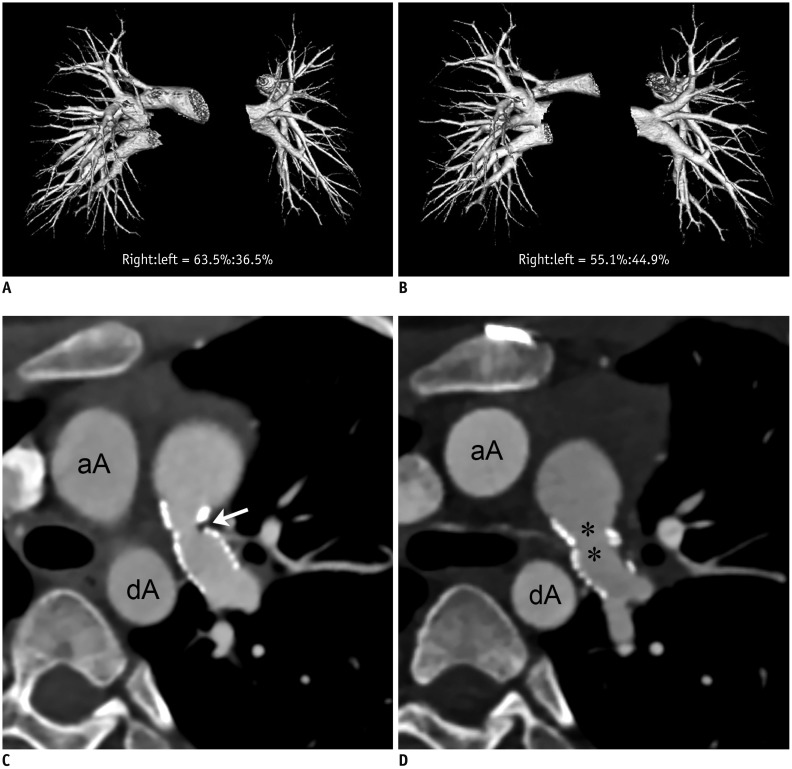
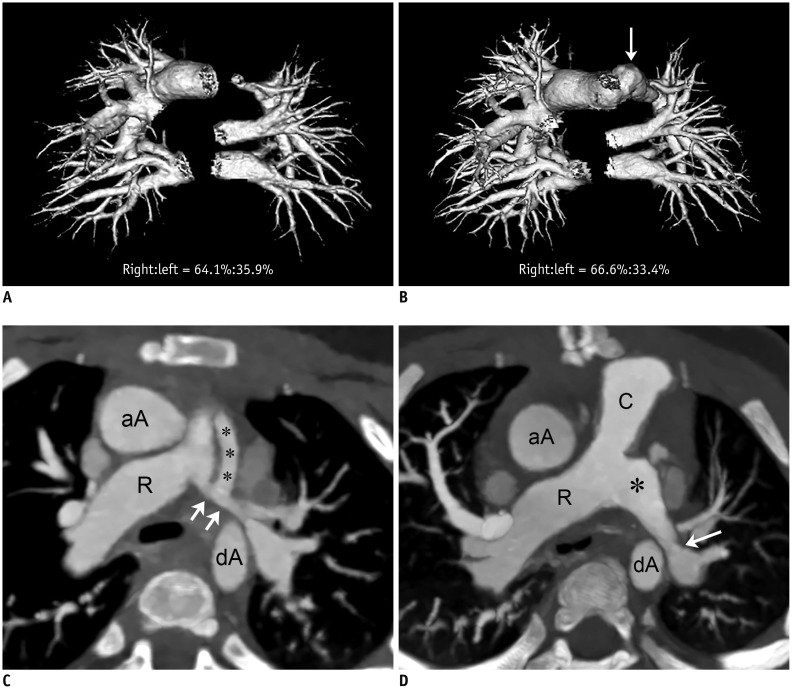
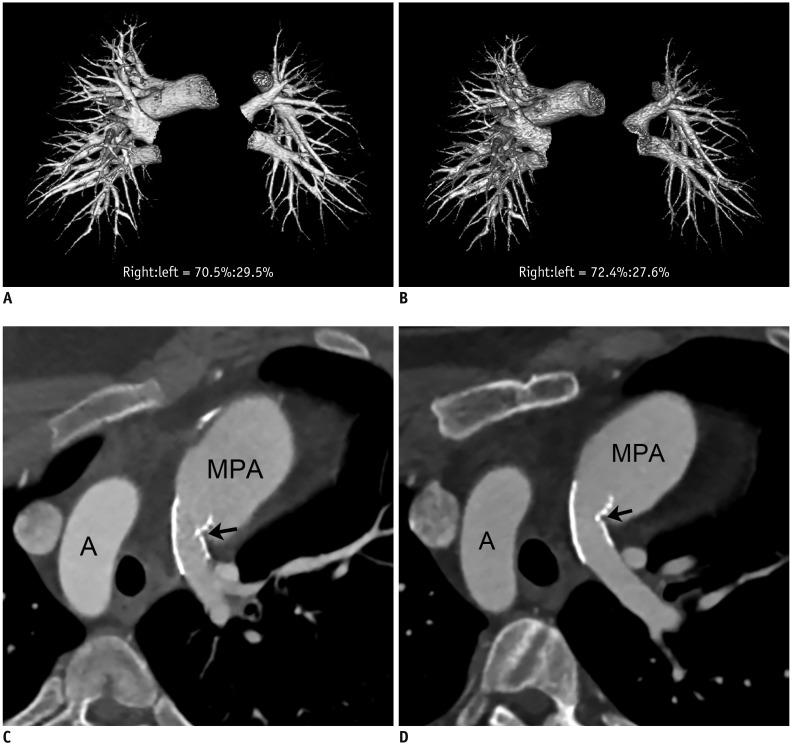
According to the one-way analysis of variance combined with Tukey's honestly significant difference post-hoc test, changes in the pulmonary vascular volume percentages measured with cardiothoracic CT were statistically significantly different among groups 1A, 1B, and 2 (11.6 ± 5.6%, 2.7 ± 1.6%, and 1.9 ± 1.4%, respectively; p < 0.001) (Fig. 1, Table 1). According to the unpaired t tests, changes in the CT pulmonary vascular volume percentages in group 1A (Fig. 2) were statistically significantly greater than those in group 1B (Fig. 3) (p < 0.003; 95% confidence interval lower 4.1%, upper 13.7%) and group 2 (p < 0.002; 95% confidence interval lower 5.0%, upper 14.5%), while no statistically significant difference was found between groups 1B and 2 (Fig. 4) (p > 0.1; 95% confidence interval lower −0.4%, upper 2.1%).
DISCUSSION
In this study, it was found that CT pulmonary vascular volume ratio can be used to evaluate the effectiveness of pulmonary artery angioplasty in patients with peripheral pulmonary artery stenosis. Based on the preliminary results of this study, changes in the CT pulmonary vascular volume percentage greater than 5% on serial cardiothoracic CT examinations could differentiate the successful or aggravated cases (group 1A) from ineffective cases (group 1B) after pulmonary artery angioplasty with 100% accuracy. In addition, all patients in group 2 (no interim surgical or interventional pulmonary artery angioplasty) showed smaller than 5% changes in the CT pulmonary vascular volume percentage between serial cardiothoracic CT examinations, except in one case that showed a 5.2% increase with aggravated left pulmonary artery stenosis (a 145.9% decrease in indexed diameter) on follow-up CT. The average change (11.6%) in the CT pulmonary vascular volume percentage in group 1A was comparable to the average change (11%) in lung perfusion percentage, as measured by lung perfusion scintigraphy previously reported in children with peripheral pulmonary artery stenosis in whom balloon angioplasty was successful (19, 20).
Right ventricle-to-aortic pressure ratio, right ventricular systolic pressure, cardiac output, pulmonary artery diameter, and lung perfusion or flow have been used as outcome measures after pulmonary artery angioplasty (31721). As right ventricular and aortic pressures as well as cardiac output are not consistently measured during cardiac catheterization in our institution, these outcome measures could not be used in this study. Therefore, other available data including peak pressure gradients at peripheral pulmonary artery stenosis, branch pulmonary artery diameter measured on cardiothoracic CT, and perfusion or pulmonary flow percentage on lung perfusion scintigraphy or cardiac MRI, were used as outcome measures after pulmonary artery angioplasty in this study. Cardiothoracic CT is already commonly used for the morphologic evaluation of pulmonary arteries in patients with peripheral pulmonary artery stenosis. Its diagnostic value as a non-invasive imaging method may be further enhanced by providing two essential outcome measures after pulmonary artery angioplasty: pulmonary vascular volume ratio as well as pulmonary artery size and morphology, as demonstrated in this study. Therefore, pulmonary artery angioplasty may be considered when the CT pulmonary vascular volume percentage of the affected lung is severely decreased (e.g., less than 30% based on expert opinions). Post-treatment effects also can be monitored using the same imaging data without additional radiation exposure.
To minimize quantification errors, the CT pulmonary vascular volumes were calculated using optimal cardiac phase and attenuation threshold in this study. The end-systolic cardiac phase was reported to provide more accurate CT pulmonary vascular volumes (7). Nonetheless, other confounding factors such as pulmonary regurgitation, collateral flow, and pulmonary vein obstruction might produce small errors (6). Severe pulmonary vein obstruction results in redistribution of pulmonary arterial flow (22). Inclusion of the pulmonary veins in the pulmonary vascular volumes might make the CT pulmonary vascular volume ratio slightly less asymmetric in patients with peripheral pulmonary artery stenosis as a result of collateral flow developed in the affected lung.
To predict postoperative hemodynamics, and thus, to determine optimal surgical strategies in patients with peripheral pulmonary artery stenosis, computational simulation with virtual surgery may be used (23). In this regard, three-dimensional imaging data of the pulmonary vasculature obtained from pre- and postoperative cardiothoracic CT may help improve the accuracy of such virtual simulation.
A retrospective study design and the small study population are the major limitations of this study, particularly in subgroup analysis. To validate the clinical value of the CT pulmonary vascular volume ratio in patients with peripheral pulmonary artery stenosis, further prospective studies are warranted. The evaluation of changes in pulmonary blood flow after pulmonary artery angioplasty using changes in the CT pulmonary vascular volume ratio might be problematic in cases (10.5%, 4/38) with bilateral lesions. In these cases, more severe side was selected to be stenotic to evaluate the treatment effect. Nevertheless, the results of this study could unveil the potential of CT pulmonary vascular volume ratio in monitoring the post-therapeutic effect of pulmonary artery angioplasty in patients with peripheral pulmonary artery stenosis.
Based on the results of the present study, lung perfusion scintigraphy or cardiac MRI, which is often requested to quantitatively assess the post-treatment effect of pulmonary artery angioplasty by clinicians, can be omitted if we use cardiothoracic CT data for the quantitative evaluation of pulmonary vascular volume ratio. This is the main objective of this study. Because the growth potential of lung vessels after effective pulmonary artery angioplasty is relatively high in young patients, the diagnostic task is highly relevant in the age range. With respect to pulmonary artery diameter, the CT measurements indexed to body surface area showed a good correlation with the CT pulmonary vascular volume ratio in this study. We generally report absolute diameter with stenosis percentage but do not use such indexed diameter in clinical practice. Therefore, it is suggested that the diagnostic value of the simple two-dimensional measurements may be enhanced if we change our practice and index the measurements to body surface area of each patient. One of ultimate goals of this study would be to prove additional value of CT pulmonary vascular volume ratio, which was not fully proven by the present study because clinical outcome measures, including pulmonary artery and right ventricular pressure data obtained during cardiac catheterization, necessary for such study were only partly available in this study.
In conclusion, CT pulmonary vascular volume ratio can be used to evaluate the effectiveness of pulmonary artery angioplasty in patients with peripheral pulmonary artery stenosis.

 XML Download