

 PDF
PDF ePub
ePub Citation
 Print
Print


INTRODUCTION
Many inflammatory markers, such as erythrocyte sedimentation rate, C-reactive protein level, and white blood cell count, are non-specific laboratory tests for the diagnosis of bacterial infections [1]. The diagnosis of bacterial infections in patients admitted to the intensive care unit (ICU) is difficult, due to the multiple etiologies of fever including non-infectious diseases [2]. Patients admitted to the ICU with fever always receive empirical antimicrobial therapy, even when the diagnosis of infection is doubtful [3]. This is an important contributory factor to antimicrobial resistance [4]. Therefore, an accurate diagnosis is of utmost importance to avoid unnecessary antibiotic usage. Moreover, the early diagnosis of bacterial sepsis might decrease the associated mortality rate [5].
Procalcitonin (PCT), the most studied biomarker, has been specifically related to bacterial infections [6]. Serum PCT level significantly increases within the first 4–8 hours in response to bacterial infections [7]. Normal PCT levels in healthy volunteers are undetectable (<10 pg/mL) [7]. An increased serum PCT level has been reported in different types of bacterial infections: intra-abdominal infections, meningitis, urinary tract infections, pneumonia, and sepsis [6]. Some authors have previously reported that a high PCT level could differentiate between fevers due to bacterial infections and those due to non-infectious causes [8910]. PCT level was recommended as a useful diagnostic marker for the recognition of sepsis in the Surviving Sepsis Campaign Guidelines 2012 [11]. In 2013, a meta-analysis reported that PCT was a good biomarker for the diagnosis of systemic inflammation response syndromes due to sepsis in critically-ill patients [12]. However, the definition of sepsis was revised in 2016 [13]. The level of PCT is no longer recommended since the definition was changed from the concept of an inflammatory response to one regarding organ dysfunction [13]. In 2016, the guideline for the management of hospital-acquired pneumonia and ventilator-associated pneumonia recommended that the level of PCT should only be used as a marker for the discontinuation of antibiotic administration and not for the initiation of antibiotic administration [14]. Furthermore, the guideline for the implementation of the Antibiotic Stewardship Program, which was published in 2016, suggested that the PCT level should be used in patients admitted to an ICU as a marker for decreasing antibiotic usage [15]. However, no specific cut-off value of PCT was recommended for the initiation of antibiotic therapy [15]. Thus, this retrospective study was conducted to determine the optimal cut-off value of PCT for the diagnosis of bacterial infections in critically-ill patients.
Materials and Methods
This retrospective study collected data at Phyathai II International Hospital, a private facility located in Bangkok, Thailand. The protocol for this study was approved by the Institutional Review Board, Faculty of Dentistry and Faculty of Pharmacy, Mahidol University, Thailand, with reference number 2017/045.2208. The committee waived the need for informed consent. Adult patients (aged >18 years) who were clinically suspected of having severe infections and who required admission to the medical or surgical ICU for more than 24 hours from 2013 to 2015 were enrolled. At least, one blood test for PCT level was performed for all patients within the first 24 hours of suspecting an infection. Patients with clinically suspected severe infections were defined as those who had signs and symptoms compatible with infection, verified by staff physicians. The exclusion criteria included pregnant women, human immunodeficiency virus-infected patients, and those with incomplete data regarding the symptoms of fever. Surgical patients were defined as those who had undergone surgical procedures during hospital admission, and who developed a fever after the procedures. Those surgical patients required admission to the surgical ICU.
The data for the study were extracted from patients' medical records. We collected data regarding sex, age, weight, height, underlying diseases, vital signs, presence of mechanical ventilation, medications, clinical and laboratory data for the evaluation of the sequential organ failure assessment (SOFA) score, type of surgery, complete blood count, presence of positive hemocultures including other positive isolates from other specimens, length of hospital stay, and PCT level. Moreover, the clinical features, results of laboratory examination, including radiography, and microbiological response, were evaluated. Patients' statuses at discharge were classified as cured, dead, or referred.
PCT levels were measured using a commercially available electrochemiluminescence immunoassay device (Elecsys BRAHMS PCT; Roche Diagnostics, Indianapolis, IN, USA). The analytical measurement range and functional sensitivity of this instrument were 0.02 – 100 ng/mL and 0.06 ng/mL, respectively.
Patients with fever were diagnosed with bacterial infections if the source of infection was compatible with the laboratory test results and imaging findings. The table of definable sources of infection used in this study was a modified form of a version obtained from the Center for Disease Control/National Healthcare Safety Network [16] (Supplementary Table 1). The patients were diagnosed with bacterial sepsis if they obtained SOFA scores of two or more. Patients without bacterial infection were defined as those whose diagnostic investigations did not yield findings compatible with the criteria specified for bacterial infections.
Continuous variables are presented as mean and standard deviation, or median and interquartile range and compared using the Student t-test or Mann-Whitney U test, as appropriate. Categorical variables are presented as percentages and compared in each group using Fisher's exact test or Pearson's chi-square test, as appropriate. The PCT levels among patients in the bacterial infection group were compared to those of patients in the non-bacterial infection group (as the control group) and assessed for sensitivity, specificity, negative predictive value, and positive predictive value. The area under the receiver operating characteristic curves (AUC) was calculated to assess the ability of PCT level to discriminate between bacterial and non-bacterial infections. The optimal cut-off value and AUC were determined among all patients and in the subgroup populations.
Patients in the bacterial infection group were divided into three subgroups. The first group comprised all patients with positive microbiological culture results at the source of infection (culture-proven infections). The second group comprised all patients diagnosed with sepsis based on their clinical presentation (patients with sepsis). The last group comprised all patients for whom a clinical diagnosis of sepsis was made and for whom positive microbiological cultures were obtained at the source of infection (patients with sepsis and positive microbiological culture results). In addition, the authors determined specific cut-off values and the AUC values according to medical or surgical conditions of the patients. Values with P <0.05 were considered statistically significant. Independent variables associated with PCT levels above the optimal cut-off value or in-hospital mortality rate were assessed via multivariate analysis. Variables with a P-value <0.10 in the univariate analysis were included in the multivariate analysis. Multivariate analysis was performed using the logistic regression model. Statistical analyses were performed using SPSS version 20 for Windows (SPSS Inc., Chicago, IL, USA).
Results
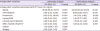
Out of a total of 311 patients enrolled, there were 157 with bacterial infections and 154 without bacterial infections. The baseline characteristics of the patients are shown in Table 1. The in-hospital mortality rate was significantly higher among patients with bacterial infections than among those without bacterial infections (25.5% vs. 13.0%, P = 0.005). Patients with bacterial infections had significantly higher white blood cell counts than did those without bacterial infections (median: 13,800 cell/mm3 vs. 10,400 cell/mm3, P <0.001). A higher proportion of patients with bacterial infections also had signs of systemic inflammatory response syndrome (88.5% vs 52.6%, P <0.001).
Table 1
Baseline characteristics of patients enrolled in the study
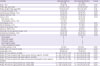
IQR, interquartile range; COPD, chronic obstructive pulmonary diseases; WBC, white blood cell count; SIRS, systemic inflammation response syndrome; PCT, procalcitonin.
![]()
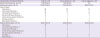
Table 2 presents a summary of the characteristics of patients diagnosed with bacterial infection. Of 157 patients with bacterial infections, 119 patients (75.8%) were diagnosed with sepsis and 94 (59.9%) had positive microbiological evidence from the source of infection. The three most common sites of infection were the pulmonary system, urinary tract, and abdomen. Seventeen of 157 patients (10.8%) had positive hemoculture results. The primary source of infection could not be identified in 5 out of 157 patients, all of whom were diagnosed with sepsis.
Table 2
Characteristics of bacterial infections
![]()
The median PCT levels are summarized in Table 1. The patients with bacterial infections had significantly higher PCT levels than did those without bacterial infections (median: 1.90 ng/mL vs. 0.16 ng/mL, P <0.001). Among patients with bacterial infections, there was no statistically significant difference in the median PCT level between medical and surgical patients (2.05 ng/mL vs. 1.52 ng/mL, P = 0.686). Similarly, among patients without bacterial infections, no difference was noted between medical and surgical patients (0.16 ng/mL vs 0.11 ng/mL, P = 0.368).
The receiver operating characteristic curve for PCT is shown in Figure 1. The AUC for discriminating between bacterial and non-bacterial infections was 0.874 (95% confidence interval [CI]: 0.834, 0.914; P <0.001). The measures of diagnostic accuracy, including the sensitivity, specificity, positive predictive value, and negative predictive value of PCT level are shown in Table 3. The optimal cut-off value of PCT was 0.50 ng/mL with a sensitivity of 84.7%, specificity of 79.9%, positive predictive value of 81.1%, and negative predictive value of 83.7%. The diagnostic performances of the subgroup analyses are summarized in Table 3. The optimal cut-off values of PCT were 0.50 ng/mL in the subgroup of patients with sepsis and 0.60 ng/mL in the subgroups of patients with culture-proven infections, sepsis, and positive microbiological culture results. In addition, the optimal cut-off value of PCT was 0.50 ng/mL for medical patients. As a parameter with more practical use, the optimal cut-off value was 0.5 ng/mL for surgical patients. However, the specificity (0.55 ng/mL) was higher than that of the cut-off point (0.50 ng/mL).
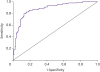 | Figure 1Receiver operating characteristic curve of procalcitonin for the diagnosis of bacterial infection in critically-ill patients.
|
Table 3
Diagnostic performances of procalcitonin
AUC, area under the receiver operating characteristic curves; CI, confidence interval; PCT, procalcitonin; PPV, positive predictive value; NPV, negative predictive value.
![]()
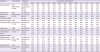
The independent variables associated with PCT level ≥0.5 ng/mL among a total of 311 patients are shown in Table 4. In the multivariate analysis, factors independently associated with PCT level ≥0.5 ng/mL were sepsis (odds ratio [OR] = 24.08; 95% CI: 10.30, 56.34; P <0.001), hemodialysis (OR = 8.89; 95% CI: 2.88, 27.51: P <0.001), and pneumonia (OR = 3.41; 95% CI: 1.35, 8.62; P=0.009).
Table 4
Univariate and multivariate analysis of data from 311 patients
OR, odds ratio; CI, confidence interval; PCT, procalcitonin; SIRS, systemic inflammation response syndrome; WBC, white blood cell count.
![]()
Discussion
Our study results showed that the median PCT level was significantly higher among patients with bacterial infections than among those without bacterial infections, which corroborates the results of previous studies [8910]. The proposed stimuli for PCT induction were lipoteichoic acid of Gram-positive bacteria, lipopolysaccharide of Gram-negative bacteria, and pro-inflammatory cytokines (tumor necrosis factor-alpha and interleukin-6) [171819]. Bacterial structure was the most potent stimulus of PCT production, while pro-inflammatory cytokines in the absence of bacteria were not strong inducers [72021]. A previous study showed a correlation between the level of pro-inflammatory cytokines and PCT level in bacterial infection [18]. Excessive pro-inflammatory cytokines were produced in patients with sepsis; thus, high PCT levels were observed in patients with sepsis [22].
We performed a large-scale study using the SOFA score for the detection of bacterial sepsis. We identified an optimal cut-off value of 0.5 ng/mL, with a sensitivity of 84.7% and a specificity of 79.9%. Previous studies that aimed to identify the optimal cut-off value of PCT for differentiating between sepsis and systemic inflammation response syndrome, reported different optimal cut-off values ranging from 1.1–2.415 ng/mL with sensitivities and specificities that varied from 63–97% and 78–91%, respectively [8910]. Moreover, surgical patients had higher PCT levels than did surgical patients [23]. Our findings were discordant with those of previous studies [891023]. The differences could be explained by the differences in the number of enrolled patients and conditions other than sepsis found to be the cause of elevated PCT level such as trauma, surgery, pancreatitis, invasive fungal infection, cardiogenic shock, and severe renal failure [18242526].
Interestingly, previous study attributed the higher PCT level among surgical patients than among medical patients [23]. The majority of surgical procedures were either abdominal or thoracic surgeries [23]. The post-operative PCT level were > 0.5 ng/ml of patents undergoing abdominal surgery or those undergoing thoracic surgery [2427]. The increase in PCT level may be due to the intestinal translocation of the bacteria or the transient bacteremia during surgical procedures [2829]. Contrary to the findings of this study, the majority of our surgical procedures were either neurological or orthopedic surgeries; thus, transient bacteremia did not occur and PCT levels were reported as <0.2 ng/mL and 0.26 ng/mL, respectively [2030]. The increase in PCT levels in patients after orthopedic surgery and neurosurgery may be due to the up-regulation of pro-inflammatory cytokines [18193132]. For this reason, only slight increases in post-operative PCT levels occurred in our surgical patients and were not different from those found in medical patients. In our study, the majority of 31 of 154 patients without bacterial infection who had PCT levels >0.5 ng/mL were trauma patients and patients with chronic renal failure on hemodialysis (Supplementary Table 2). In the multivariate analysis, no false positive results were identified among patients undergoing hemodialysis. Our study found a median PCT level of 0.62 ng/mL among patients undergoing hemodialysis and without bacterial infection (data not shown). This finding was concordant with that of a previous study that showed that the mean PCT level among those patients was as high as 0.58 ng/mL [26]. Due to the composition of the non-bacterial infection group in our study, the majority of whom were stroke patients (33.7%) and congestive heart failure patients (12.3%), surgery was not a strong PCT inducer (data not shown). For these reasons, PCT levels in patients without bacterial infection were lower in our study than those declared in previous reports [8910].
The sensitivity of the optimal cut-off value was lower in our study (84.7%) than that reported by Harbarth et al. (97%), while the specificity was similar (79.9% in our study vs. 78% reported by Harbarth et al.) [9]. The observed difference could be explained by the difference in the characteristics of the patients enrolled in the bacterial infection group. All the patients enrolled in the study conducted by Harbarth et al. had sepsis [9]. In our study, 75.8% of patients had sepsis, while the remaining had localized infections. Our results showed that all patients with localized infections, including skin and soft tissue infections and bronchitis had PCT levels <0.5 ng/mL (data not shown). In addition, 56.4% of patients with urinary tract infections without sepsis had PCT levels <0.5 ng/mL (data not shown). Our findings were concordant with those of previous studies [333435]. Notably, only patients with sepsis in this study showed a high sensitivity of 93.3% when using an optimal cut-off value of 0.5 ng/mL. This finding confirmed that localized infection is a stimulus for PCT production, but does so to a lesser extent than sepsis.
Our results provided the optimal cut-off value of PCT for the accurate diagnosis of bacterial infections in critically-ill patients. Using the PCT level to guide the initiation of antibiotic administration, could reduce the mortality rate as well as the rate of unnecessary antibiotic use. However, some non-infectious diseases, as mentioned above, were causes of elevated PCT levels ≥0.5 ng/mL.
Our study had some limitations. First, the data were collected retrospectively. Some data such as the APACHE-II score and lactate level could not be retrieved. However, this study reported the in-hospital mortality rate for comparison of severity between both groups. Second, this study did not classify patients according to the status of septic shock based on the new criteria because blood lactate data were missing. Further investigations are needed to determine and classify patients with septic shock based on the new criteria.
Despite these limitations, our study had some strengths. First, there were clear criteria for the diagnosis of bacterial infections, especially sepsis. Second, our study enrolled patients with either positive or negative microbiological culture results in the bacterial infectious diseases group that represented a real situation in clinical practice. Finally, we enrolled many patients with PCT values, which would make our assessment of the optimal cut-off more accurate for the detection of sepsis.
In conclusion, the biomarker PCT, can be used as an indicator of severe bacterial infection, including sepsis. It is helpful to differentiate between fevers due to bacterial infections from those due to non-bacterial infections. The optimal cut-off value for the diagnosis of bacterial infection was 0.5 ng/mL.
 XML Download