

 PDF
PDF Citation
 Print
Print


INTRODUCTION
Uric acid is a product of xanthine oxidase in purine metabolism. Besides causing gout, uric acid stimulates vascular smooth muscle cells and is associated with endothelial dysfunction. Of note, hyperuricemia is known to be related to not only cardiovascular diseases but also metabolic syndrome. However, no clear cause-and-effect relationship has been proven between hyperuricemia and the diseases mentioned above.123
Homocysteine (Hcy), one of the non-essential amino acids, is an intermediate metabolite of methionine metabolism, which is eventually converted into cysteine. It is known to be elevated in different conditions, such as genetic diseases in Hcy metabolism, vitamin B12 and folate deficiency, renal dysfunction, metabolic abnormality, or smoking.4567 In animal models, Hcy promotes vascular smooth muscle hypertrophy and inhibits endothelial cell growth, leading to atherosclerosis via excessive platelet aggregation and thrombus formation.8 Hyperhomocysteinemia is one of the important risk factors of cardiovascular diseases including coronary artery disease, cerebrovascular disease, peripheral vascular disease, deep vein thrombosis, and pulmonary embolism.9
Both hyperuricemia and hyperhomocysteinemia are reported to be associated with vessel endothelial dysfunction and are considered as main risk factors for atherosclerotic diseases.39 Although the pathogenesis of atherosclerosis in patients with hyperuricemia has not been clearly elucidated yet, some previous studies have reported a positive correlation between serum uric acid levels and serum Hcy levels.101112
Carotid intima-media thickness (IMT) is one of the noninvasive and easy methods for the estimation of arterial wall changes in early atherosclerosis.13 Carotid IMT correlates well with the histological changes in atherosclerosis and is related to progressive atherosclerosis, such as carotid artery disease.14 We evaluated the relationship between the carotid arterial IMT and various clinical factors, such as serum Hcy level and renal function in hyperuricemic patients. We also investigated the possible mechanism by which hyperuricemia is associated with an increase in carotid IMT.
METHODS
Study design and subjects
This study was a cross-sectional study. This study was conducted for all people over the age of 18 who have received a carotid IMT examination through a health check-up. We included 1,222 individuals who visited the Health Promotion Center of Chung-Ang University Hospital in Seoul, Korea for routine health check-up from January 2013 to December 2015. We obtained the data from all individuals who underwent both carotid ultrasonography and laboratory measurements, including serum Hcy level and renal function test.
Laboratory assessments and imaging process
Age, gender, and past medico-surgical history were recorded via history taking. Blood sampling and carotid ultrasonography were performed on the same day. The serum Hcy, uric acid, blood sugar, blood urea nitrogen (BUN), creatinine (Cr), total cholesterol, high-density lipoprotein cholesterol (HDL-C), low-density lipoprotein cholesterol (LDL-C), and triglyceride levels and other test results were obtained. The serum Hcy levels were determined with competitive immunoassays using the direct chemiluminescence method (ADIVA Centaur Hcy; Siemens Centaur Immunoassay system, Las Vegas, NV, USA). The intra assay coefficient of variation was 3.38 and standard deviation index was 1.01 for the Hcy measurement. Hyperuricemia was defined as serum uric acid level > 7.0 mg/dL for men or > 5.6 mg/dL for women.15 Hyperhomocysteinemia was defined as serum Hcy level > 15.0 μmol/L.16 The estimated glomerular filtration rate (eGFR) was calculated using the Modification of Diet in Renal Disease formula as follows17:
eGFR (mL/min/1.73 m2) = 175 × Serum Cr [exp(−1.154)] × Age [exp(−0.203)] × (0.742 in women) × (1.212 if black)
Carotid IMT was measured using the B-mode ultrasonography (LOGIUQ-29 and LOGIQ P5; General electrics, Boston, MA, USA and IU22; Philips, Amsterdam, The Netherlands) at the site where double-line patterns were observed without an atherosclerotic plaque in the common carotid artery. One of the highest levels from the bilateral carotid IMTs was selected and used for the analysis. Carotid IMT can vary widely depending on the presence of underlying diseases, age, and gender. An abnormal carotid IMT is generally defined as a thickness > 0.9 mm according to the 2013 European Society of Hypertension (ESH)/European Society of Cardiology (ESC) guidelines for hypertension for controlling cardiovascular risk factors on hypertensive patients.18 Atherosclerotic plaques in the carotid artery were defined as a localized thickening of > 1.2 mm that did not uniformly involve the entire left or right common carotid bifurcation with or without flow disturbance.19 Atherosclerotic changes in the carotid artery were defined as increased carotid IMT or presence of plaques.
Statistical analyses
All data are expressed as the means ± standard deviations. If the values were not normally distributed, values were represented as median (interquartile range). The Student's t-test was used for comparing the mean values. When variables do not follow a normal distribution, Mann-Whitney U test was used. Pearson's χ2 test was used to compare the differences between the categorical variables for analyzing correlations. A multivariable logistic regression analysis using serum Hcy level, fasting plasma glucose, LDL-C, triglyceride and C-reactive protein was performed to obtain the respective odds ratios (ORs). In all analyses, a P value of < 0.05 was considered statistically significant. All statistical analyses were conducted using SPSS version 20.0 (IBM Corp, Armonk, NY, USA).
Ethics statement
The study was approved by the Institutional Review Board (IRB) of Chung-Ang University Hospital (1708-007-16091) and the requirement of obtaining informed consent was waived by the IRB due to the retrospective nature of this study. The study adhered to the reporting of observational studies in epidemiology (STROBE): cross-sectional statement.
RESULTS
Baseline characteristics of the study participants
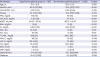
Among the 1,222 subjects, 185 subjects met the definition of hyperuricemia, and the other 1,037 subjects were classified into the normouricemic group. The median serum uric acid level in the hyperuricemic group was 7.4 mg/dL, and that in the normouricemic group was 5.2 mg/dL (P < 0.001). The average age of the 1,222 subjects was 50.8 years (range, 19−87), and there was no significant age difference between the hyperuricemic and the normouricemic groups (51.3 ± 9.5 vs. 50.8 ± 9.0 years, P = 0.472). When compared to the normouricemic group, the hyperuricemic group had a significantly lower eGFR (84.4 vs. 94.5 mL/min/1.73 m2, P < 0.001), a higher serum total cholesterol level (205 vs. 190 mg/dL, P < 0.001), a higher serum LDL-C level (126.0 ± 35.9 vs. 117.9 ± 32.2 mg/dL, P = 0.002), higher serum triglyceride level (133 vs. 100 mg/dL, P < 0.001), and a lower serum HDL-C level (48 vs. 50 mg/dL). The baseline characteristics of the participants are summarized in Table 1.
Table 1
Baseline characteristics of the study participants
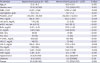
Data are presented as means ± standard deviations, percentage (number), or number (%). If the values were not normally distributed, values were represented as median (interquartile range).
WBC = white blood cell count, FPG = fasting plasma glucose, eGFR = estimated glomerular filtration rate, BUN = blood urea nitrogen, Cr = creatinine, AST = aspartate aminotransferase, ALT = alanine aminotransferase, T-CHOL = total cholesterol, HDL-C = high-density lipoprotein cholesterol, LDL-C = low-density lipoprotein cholesterol, TG = triglyceride, ESR = erythrocyte sedimentation rate, CRP = C-reactive protein.
![]()
Carotid IMT and serum Hcy levels according to serum uric acid levels
Carotid IMT values were significantly higher in patients with hyperuricemia than in individuals with normouricemia (1.12 ± 0.64 vs. 1.02 ± 0.50 mm, P = 0.043) (Fig. 1A). The hyperuricemic group showed higher serum Hcy levels as compared to the normouricemic group (13.39 ± 4.42 vs. 11.69 ± 3.65 μmol/L, P < 0.001) (Fig. 1B). In the hyperuricemic group, the carotid IMT significantly correlated with the serum Hcy levels (γ = 0.196, P = 0.008) (Fig. 2A). Multivariable logistic regression analysis was performed to identify the risk factors for carotid plaque (Table 2). Serum Hcy level (OR, 1.050; 95% confidence interval [CI], 1.009–1.092) and fasting glucose level (OR, 1.018; 95% CI, 1.011–1.026) were independent risk factors for the carotid plaque.
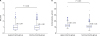 | Fig. 1Comparison of the carotid IMT and Hcy levels between the hyperuricemic and normouricemic groups. (A) Carotid IMT values and (B) serum Hcy levels were significantly higher in hyperuricemic group than in normouricemic group.IMT = intima-media thickness, Hcy = homocysteine.
|
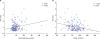 | Fig. 2Correlation between Hcy level and eGFR with carotid IMT in the hyperuricemic group. (A) Carotid IMT showed significant correlations with serum Hcy level and (B) eGFR.Hcy = homocysteine, IMT = intima-media thickness, eGFR = estimated glomerular filtration rate.
|
Table 2
Multivariable logistic regression analyses for high-risk of carotid plaque

OR = odds ratio, CI = confidence interval, FPG = fasting plasma glucose, LDL-C = low-density lipoprotein cholesterol, TG = triglyceride, CRP = C-reactive protein.
![]()
Associations of carotid IMT and serum Hcy levels with renal function and other parameters in patients with hyperuricemia
The carotid IMT had a significant association with eGFR, serum BUN level, and serum Cr level (γ = −0.297, P < 0.001; γ = 0.199, P = 0.007; and γ = 0.266, P < 0.001, respectively) (Fig. 2B). However, the serum lipid profile did not statistically correlate with the carotid IMT (total cholesterol, γ = −0.025, P = 0.733; HDL-C, γ = −0.021, P = 0.780; LDL-C, γ = 0.000, P = 0.995; and triglyceride, γ = 0.09, P = 0.899).
In hyperuricemic group, the serum Hcy level well correlated with eGFR, BUN level, and serum Cr level (γ = −0.478, P < 0.001; γ = 0.358, P < 0.001; and γ = 0.490, P < 0.001, respectively), but it did not correlate well with the serum lipid profile (total cholesterol, γ = 0.094, P = 0.203; HDL-C, γ = 0.014, P = 0.846; LDL-C, γ = 0.111, P = 0.141; and triglyceride, γ = 0.089, P = 0.229). In patients with hyperhomocysteinemia, the carotid IMT significantly increased to 1.00 mm as compared to 0.90 mm in patients with normohomocysteinemia (P = 0.025). The eGFR in patients with hyperhomocysteinemia was significantly lower than those with normohomocysteinemia (84.37 ± 19.56 vs. 96.27 ± 16.47, P = 0.003) (Table 3).
Table 3
Comparison of the atherosclerotic risk factors according to serum homocysteine levels
Data are presented as means ± standard deviations, percentage (number), or number (%). If the values were not normally distributed, values were represented as median (interquartile range).
IMT = intima-media thickness, FPG = fasting plasma glucose, eGFR = estimated glomerular filtration rate, BUN = blood urea nitrogen, Cr = creatinine, AST = aspartate aminotransferase, ALT = alanine aminotransferase, T-CHOL = total cholesterol, HDL-C = high-density lipoprotein cholesterol, LDL-C = low-density lipoprotein cholesterol, TG = triglyceride, ESR = erythrocyte sedimentation rate, CRP = C-reactive protein.
![]()
DISCUSSION
In this study, we assessed the relationship between carotid IMT and serum Hcy level and renal function and investigated the mechanism by which hyperuricemia affects carotid IMT. The carotid IMT in hyperuricemic patients was proportionate to the degree of hyperuricemia and was associated with the elevated serum Hcy levels. With 1 μmol/L increase in the serum Hcy level, the carotid plaque increased by 1.050-fold. We suggest that the deterioration in renal function of hyperuricemic patients may induce the increase in carotid IMT through an elevation of the serum Hcy levels. According to Choi and Curhan,20 the all-cause mortality rate increased by 28% (95% CI, 1.15−1.41) in men with gout without any history of cardiovascular diseases as compared to that in men without a history of gout and cardiovascular diseases. The mortality rate in patients with cardiovascular disease and coronary artery disease also increased significantly.20 These reports suggested that the control of comorbid diseases, such as cardiovascular diseases, is very important in patients with gout.
The mechanism by which the risk of cardiovascular diseases increases in presence of gout is not yet clear. Several studies have verified the mechanism associated with hyperuricemia and the risk of developing cardiovascular diseases. In an animal model, hyperuricemia was shown to reduce the production of nitric oxide in the blood, causing endothelial dysfunction and leading to complications, such as hypertension and vascular disease.21 One of the possible factors that can explain the association between hyperuricemia and atherosclerosis is Hcy, which is regarded as one of the important cardiovascular risk factors.9 Both uric acid and Hcy are known as risk factors for the development of cardiovascular diseases. In this study, we identified a positive correlation between Hcy level and carotid IMT in hyperuricemic patients, and patients with hyperhomocysteinemia had higher carotid IMT values than those with normohomocysteinemia.
Until now, the mechanism of the association between serum Hcy and uric acid remains obscure. Unbalanced metabolism of methionine-Hcy has been suggested as a possible mechanism.11 S-adenosylmethionine, the product of methionine metabolism, is converted to S-adenosylhomocysteine (SAH) by methyltransferase, which is reversibly degraded by adenosine and Hcy by SAH hydrolase. Adenosine and Hcy at a ratio of 1:1 is converted back to SAH by SAH hydrolase. When adenosine is rapidly degraded into uric acid in case of hypoxia or tissue necrosis, this process leads to the accumulation of Hcy via a reduction of SAH formation resulting in hyperhomocysteinemia.11
One of the other hypotheses that we can consider is the metabolic process associated with methylenetetrahydrofolate reductase. Hcy is a metabolite of methionine, which is produced by the S-adenosylmethionine-dependent transmethylation reaction. In excess production of methionine, Hcy is irreversibly converted to cysteine by the transsulfuration pathway by cystathionine β-synthase, which is a vitamin B6-dependent enzyme.16 When methionine reduction occurs, the re-methylation of Hcy in most of the tissues is catalyzed by methionine synthase, which uses vitamin B12 as a cofactor and methyl-tetrahydrofolate as a substrate.16 The production of methyl-tetrahydrofolate is catalyzed by methylenetetrahydrofolate reductase, a vitamin B12-dependent enzyme.16 In this process, Hcy accumulation can result from enzyme deficiency or vitamin deficiency, which is needed for regulating Hcy metabolism.
In our study, both the carotid IMT and serum Hcy level were significantly associated with the eGFR (Fig. 2B), and eGFR was well correlated with the carotid IMT (γ = −0.478, P < 0.001). The increase in uric acid level leads to renal damage by renal atherosclerosis, such as arteriopathy, interstitial fibrosis, and glomerular hypertrophy, in which sustained hyperuricemia is known to worsen renal damage.1 Hcy, and not uric acid itself, has been reported to be associated with renal dysfunction in patients with gout and hyperuricemia.12 Hyperhomocysteinemia can also be observed in patients with chronic kidney disease, which could be attributed to several factors, such as renal dysfunction, renal artery atherosclerosis, metabolic dysfunction, unexplained genetic disorders, and vitamin deficiencies.22 Therefore, it can be speculated that hyperuricemia may induce renal dysfunction, which may subsequently increase Hcy levels. Moreover, multiple pathological mechanisms attributable to renal dysfunction, such as increased transmethylation, decreased remethylation, and reduced Hcy excretion also can induce hyperhomocysteinemia.23
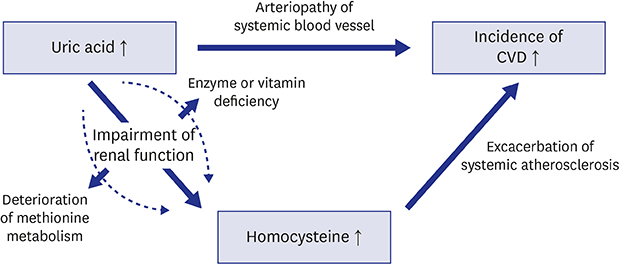
Therefore, we suggest the following mechanism as a cause of increased carotid IMT in patients with hyperuricemia (Fig. 3). Hyperuricemia induces systemic arteriopathy, including the renal vessels, which may cause renal dysfunction. A reduced renal secretion of uric acid due to renal dysfunction aggravates hyperuricemia and subsequent renal damage. In this process, impairment of renal function affects the suppression of the metabolism and excretion of Hcy. This increases Hcy levels in the blood, resulting in the exacerbation of systemic atherosclerosis represented by the carotid IMT and eventually increasing the incidence of cardiovascular diseases.
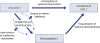 | Fig. 3The suggested mechanism of atherosclerosis in patients with hyperuricemia.CVD = cardiovascular disease.
|
This study has some limitations. First, it is well known that atherosclerosis is closely related to the occurrence of cardiovascular diseases,1314 so we evaluated the carotid IMT instead of cardiovascular diseases. However, carotid IMT does not directly indicate the occurrence of cardiovascular diseases. Further prospective studies on the actual occurrence of cardiovascular diseases are necessary. Second, this study was based on the data of patients who underwent health screening, and thus, the characteristics of the study population were not properly assessed, for example, drug history including methotrexate, serum folate or vitamin B12 levels, body weight, blood pressure, and underlying diseases, such as autoimmune diseases, renal stone or gout. Third, the lack of the reproducibility tests for the IMT and carotid plaque measurements was another limitation. However, the sample size was relatively high, and that might overcome the issue of reproducibility to some extent. Finally, our hospital's health check-up program includes an optional carotid IMT measurement. Therefore there may be a risk of selection bias, because a carotid IMT examination was not performed on all individuals who took part in health check-up.
In conclusion, carotid IMT was greater in the hyperuricemic patients than in the normouricemic ones. This study suggests that an impaired renal function in hyperuricemic patients may induce an increase in carotid IMT via increased serum Hcy level. It would be helpful for the patients with hyperuricemia to evaluate the serum Hcy levels and carotid IMT for the prevention of cardiovascular disease.
 XML Download